HAL Id: hal-02066027
https://hal.archives-ouvertes.fr/hal-02066027
Submitted on 21 Aug 2020
HAL is a multi-disciplinary open access
archive for the deposit and dissemination of
sci-entific research documents, whether they are
pub-lished or not. The documents may come from
teaching and research institutions in France or
abroad, or from public or private research centers.
L’archive ouverte pluridisciplinaire HAL, est
destinée au dépôt et à la diffusion de documents
scientifiques de niveau recherche, publiés ou non,
émanant des établissements d’enseignement et de
recherche français ou étrangers, des laboratoires
publics ou privés.
Submillimeter spectroscopy and astronomical searches of
vinyl mercaptan, C2H3SH
M.-A. Martin-Drumel, K. Lee, A. Belloche, O. Zingsheim, S. Thorwirth, S.
Mueller, F. Lewen, R. Garrod, K. Menten, M. Mccarthy, et al.
To cite this version:
M.-A. Martin-Drumel, K. Lee, A. Belloche, O. Zingsheim, S. Thorwirth, et al.. Submillimeter
spec-troscopy and astronomical searches of vinyl mercaptan, C2H3SH. Astronomy and Astrophysics - A&A,
EDP Sciences, 2019, 623, pp.A167. �10.1051/0004-6361/201935032�. �hal-02066027�
https://doi.org/10.1051/0004-6361/201935032
c
M.-A. Martin-Drumel et al. 2019
Astronomy
&
Astrophysics
Submillimeter spectroscopy and astronomical searches of vinyl
mercaptan, C
2
H
3
SH
?
M.-A. Martin-Drumel
1,2,??, K. L. K. Lee
2, A. Belloche
3, O. Zingsheim
1, S. Thorwirth
1, H. S. P. Müller
1, F. Lewen
1,
R. T. Garrod
4, K. M. Menten
3, M. C. McCarthy
2, and S. Schlemmer
11 I. Physikalisches Institut, Universität zu Köln, Zülpicher Str. 77, 50937 Köln, Germany
e-mail: [email protected]
2 Harvard-Smithsonian Center for Astrophysics, 60 Garden Street, Cambridge, MA 02138, USA 3 Max-Planck-Institut für Radioastronomie, Auf dem Hügel 69, 53121 Bonn, Germany
4 Departments of Astronomy & Chemistry, University of Virginia, McCormick Road, PO Box 400319, Charlottesville,
VA 22904-4319, USA
Received 8 January 2019/ Accepted 13 February 2019
ABSTRACT
Context. New laboratory investigations of the rotational spectrum of postulated astronomical species are essential to support the assignment and analysis of current astronomical surveys. In particular, considerable interest surrounds sulfur analogs of oxygen-containing interstellar molecules and their isomers.
Aims. To enable reliable interstellar searches of vinyl mercaptan, the sulfur-containing analog to the astronomical species vinyl alco-hol, we investigated its pure rotational spectrum at millimeter wavelengths.
Methods. We extended the pure rotational investigation of the two isomers syn and anti vinyl mercaptan to the millimeter domain using a frequency-multiplication spectrometer. The species were produced by a radiofrequency discharge in 1,2-ethanedithiol. Addi-tional transitions were remeasured in the centimeter band using Fourier-transform microwave spectroscopy to better determine rest frequencies of transitions with low-J and low-Kavalues. Experimental investigations were supported by quantum chemical
calcu-lations on the energetics of both the [C2,H4,S] and [C2,H4,O] isomeric families. Interstellar searches for both syn and anti vinyl
mercaptan as well as vinyl alcohol were performed in the EMoCA spectral line survey carried out toward Sgr B2(N2) with ALMA.
Results. Highly accurate experimental frequencies (to better than 100 kHz accuracy) for both syn and anti isomers of vinyl mercaptan are measured up to 250 GHz; these deviate considerably from predictions based on extrapolation of previous microwave measure-ments. Reliable frequency predictions of the astronomically most interesting millimeter-wave lines for these two species can now be derived from the best-fit spectroscopic constants. From the energetic investigations, the four lowest singlet isomers of the [C2,H4,S]
family are calculated to be nearly isoenergetic, which makes this family a fairly unique test bed for assessing possible reaction path-ways. Upper limits for the column density of syn and anti vinyl mercaptan are derived toward the extremely molecule-rich star-forming region Sgr B2(N2) enabling comparison with selected complex organic molecules.
Key words. astrochemistry – molecular data – method: laboratory: molecular – ISM: individual objects: Sagittarius B2 (N) – ISM: molecules – surveys
1. Introduction
From the diatomic SH+ and SH radicals (Menten et al. 2011;
Neufeld et al. 2012) to the large complex organic molecule ethyl mercaptan (ethanethiol, C2H5SH;Kolesniková et al. 2014), nearly 20 sulfur-bearing species have been observed in the interstellar medium (ISM) and in the circumstellar envelopes of evolved stars. This total is substantial, representing roughly 10% of all the known interstellar or circumstellar compounds. While the abundance of S-containing species in the diffuse ISM is consistent with the estimated cosmic abundances of sulfur (Savage & Sembach 1996) and is well reproduced by current astrophysical models (Neufeld et al. 2015), the same set of com-pounds only accounts for ∼0.1% of the expected sulfur
abun-? Tables B.1 and B.2 are only available at the CDS via anonymous ftp
tocdsarc.u-strasbg.fr(130.79.128.5) or viahttp://cdsarc. u-strasbg.fr/viz-bin/qcat?J/A+A/623/A167
?? Present address: Institut des Sciences Moléculaires d’Orsay
(ISMO), CNRS, Univ. Paris-Sud, Université Paris-Saclay, 91405 Orsay, France.
dance in the cold, dense clouds and circumstellar regions around young stellar objects (Joseph et al. 1986;Tieftrunk et al. 1994). This remarkable disparity has given rise to a simple, but cur-rently unanswered, question: Where is the missing sulfur? Sev-eral potential reservoirs have been investigated, including atomic sulfur (Anderson et al. 2013), S-bearing species trapped on icy dust grains (Jimenez-Escobar & Munoz Caro 2011), and S-containing molecules in the gas phase (Martin-Domenech et al. 2016; Cazzoli et al. 2016), along with other possibili-ties. From studies of shocked gas, however, atomic sulfur can only account for at most 5–10% of the total sulfur cosmic abun-dance (Anderson et al. 2013), implying that additional sulfur sinks must exist. Many studies propose that the depletion of sulfur reflects accretion onto dust grains, where it could be sequestered in various forms as inorganic and organic molecules (Scappini et al. 2003), or atomic and polymeric Sn chains and rings (Wakelam et al. 2004). So far, however, only two sulfur molecules, OCS and SO2, have been detected on grains, both in too low abundance for either species to be a major reservoir of sulfur (Palumbo et al. 1995;Boogert et al. 1997). Since H2S
Open Access article,published by EDP Sciences, under the terms of the Creative Commons Attribution License (http://creativecommons.org/licenses/by/4.0),
A&A 623, A167 (2019)
is the most abundant sulfur-bearing molecule in cometary ices (Bockelee-Morvan et al. 2000), its presence on ice grains has also received some attention, but the rather low upper limit on its abundance also appears to rule out this species as a major sink for sulfur (Smith 1991; Jimenez-Escobar & Munoz Caro 2011). Finally, photoprocessing of sulfur-containing ice prod-ucts could yield gaseous S-bearing species in the dense ISM in molecular forms that are yet to be identified (Jimenez-Escobar & Munoz Caro 2011). Consequently, the identification of missing interstellar sulfur carriers requires the detection of new gaseous sulfur containing compounds, which in turn requires laboratory investigations of their rotational spectra. Transient species are particularly appealing candidates, but are often challenging to characterize in the laboratory compared to their stable, often commercially available, counterparts, especially in the millimeter- and submillimeter-wave region in which high-altitude, high-sensitivity radio facilities such as the Atacama Large Millimeter/submillimeter Array (ALMA) operate.
WhileKolesniková et al. (2014) reported the detection of ethyl mercaptan in Orion, its presence there is not without con-troversy (Müller et al. 2016). Regardless, experimental data on related molecules that might also be present in the ISM and par-ticipate in the same chemical network, for instance unsaturated variants, may prove helpful in resolving this controversy. The isomeric family with the elemental formula [C2,H4,S] – thioac-etaldehyde (CH3CHS), thiirane (c-C2H4S), and vinyl mercaptan (CH2CHSH) – are of particular interest as all three isovalent oxy-gen counterparts (acetaldehyde, oxirane, and vinyl alcohol) have been detected in the ISM (Gottlieb 1973;Dickens et al. 1997;
Turner & Apponi 2001). Structural isomers are an invaluable tool to probe the chemical dynamics of astrophysical environ-ments. While a minimum energy principle was once proposed to assert molecular abundance in space (Lattelais et al. 2009), the general consensus is that chemical kinetics, rather than ther-modynamic stability, is driving the formation of molecules in astronomical sources (Loomis et al. 2015). Interestingly, rela-tively little is known about isomers of relarela-tively large astrophys-ical species (five atoms and more); this is in part because of the difficulties involved in both producing and detecting these species in the laboratory, and the [C2,H4,S] family is no excep-tion. While the pure rotational spectrum of each of these three singlet isomers has been investigated in the microwave domain (Kroto et al. 1974;Cunningham et al. 1951;Tanimoto & Saito 1977), high-resolution measurements at millimeter and shorter wavelengths have only been published for thiirane (Hirao et al. 2001;Bane et al. 2012), which is a likely reflection of the stabil-ity of this compound in the laboratory. In contrast, thioacetalde-hyde polymerizes rapidly, with a lifetime on the order of ten seconds (Kroto et al. 1974), and consequently it must, as with vinyl mercaptan, be produced in situ for spectroscopic studies. To confidently detect these two transient species in the ISM, lab-oratory measurements at higher frequency are essential, particu-larly in spectral bands in which ALMA operates.
In this study we measured the pure rotational spectrum of the synand anti isomers of vinyl mercaptan in their ground vibra-tional state up to 250 GHz. From the newly recorded transitions, we derived highly accurate rotational and centrifugal distortion constants for both species, ensuring that astronomical searches in the millimeter domain can now be undertaken with confidence. Using the new experimental data, we carried out searches on the spectral line survey EMoCA (Exploring Molecular Complexity with ALMA) performed toward the region of high-mass star for-mation Sagittarius (Sgr) B2(N) (Belloche et al. 2016). As part of this work, we also investigated the energetics of the [C2,H4,S]
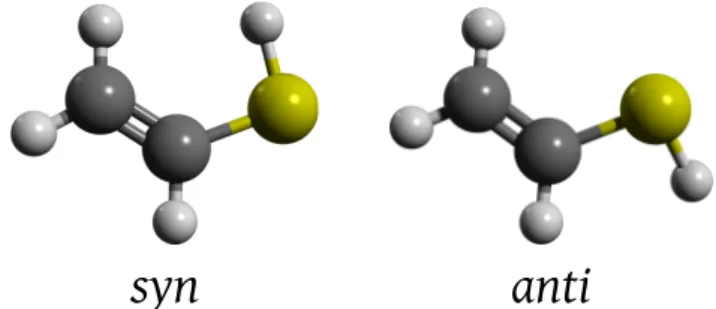
syn
anti
Fig. 1. Molecular representation of planar syn and quasi-planar anti vinyl mercaptan.
isomeric family and its isovalent oxygen counterparts via high-level quantum chemical calculations.
2. Methods
2.1. Spectroscopic background
Vinyl mercaptan exists in the gas phase in two distinct rotameric forms, the planar syn and quasi-planar anti isomers (Fig. 1); the former is only slightly more stable than the latter by about 0.6 kJ mol−1 (Almond et al. 1983, 1985; Plant et al. 1992), which yields a syn/anti ratio at room temperature of about 1.2. It is worth noting that while the equilibrium structure of the anti isomer is non-planar, with a calculated SH torsional angle of about 130–150◦, the barrier to linearity (0.14 kJ mol−1) is small compared to the zero-point vibration, which results in a vibrationally averaged planar structure (Tanimoto & Macdonald 1979; Almond et al. 1985). As a consequence, both isomers can be considered as belonging to the Cs point group symmetry (Almond et al. 1983).
Experimental studies on vinyl mercaptan are limited. Photoelectron (Chin et al. 1994) and low-resolution vibrational spectra (Almond et al. 1977,1983) have been reported, while pure rotational spectra of the two isomers in the ground and several excited vibrational states have only been measured up to 50 GHz (Almond et al. 1977; Tanimoto & Saito 1977; Tanimoto et al. 1979; Tanimoto & Macdonald 1979). Isotopic investigations of the microwave spectra of the SD isotopologs1 (Tanimoto & Saito 1977;Tanimoto et al. 1979;Tanimoto & Macdonald 1979), and extensive studies of deuterated variants of the syn isomer (Almond et al. 1985) that followed, enabled a determination of a partial geometry. Owing to the absence of experimental data for isotopic species involving substitution at any of the three heavy atoms, a complete structure has not been reported. Additionally, accurate dipole moments in the ground vibrational state are available from Stark measurements: µa= 0.813(1) D, µb= 0.376(4) D, µtot= 0.896(3) D for the syn isomer; and µa= 0.425(10) D, µb= 1.033(10) D, µtot= 1.117(14) D for the antiisomer (Tanimoto et al. 1979;Tanimoto & Macdonald 1979). 2.2. Computational details
Quantum-chemical calculations of the [C2,H4,S] and [C2,H4,O] isomeric families were performed at the coupled-cluster level with single, double, and perturbative triple excita-tions [CCSD(T)] (Raghavachari et al. 1989). All calcula-tions were performed using the Coupled-Cluster techniques for
1 I.e., in which the single hydrogen atom bonded to the S atom is
replaced by a deuterium atom. A167, page 2 of8
Table 1. Ground state molecular parameters (in MHz) of syn and anti vinyl mercaptan derived in this study compared with previously published values (Tanimoto et al. 1979;Tanimoto & Macdonald 1979) and those calculated theoretically (Calc.).
syn-CH2CHSH anti-CH2CHSH
This worka Previousa Calc.b This worka Previousa Calc.b
Ae · · · 50 304.4 · · · 49 843.5 ∆A0 · · · 431.2 · · · 36.4 Be · · · 5866.0 · · · 5912.5 ∆B0 · · · 38.1 · · · 31.9 Ce · · · 5253.4 · · · 5308.9 ∆C0 · · · 37.3 · · · 50.6 A0 49 816.0376 (11) 49 815.28 (6) 49 873.2 49 423.5726 (11) 49 422.75 (5) 49 807.1 B0 5835.708685 (92) 5835.716 (14) 5827.9 5897.21162 (11) 5897.215 (9) 5880.6 C0 5222.075531 (85) 5222.081 (11) 5216.1 5279.43951 (13) 5279.436 (9) 5258.3 DJ× 103 2.724203 (89) 2.85 (17) 2.716 3.09729 (17) 3.12 (11) 3.117 DJK× 103 −33.4874 (12) −33.2 (21) −35.89 −37.6145 (40) −38.5 (17) −40.02 DK 0.79113 (14) · · · 0.8100 0.80990 (18) · · · 0.9496 d1× 103 −0.424456 (88) −0.425 (35) −0.4239 −0.47324 (19) −0.498 (51) −0.4143 d2× 103 −0.023739 (73) · · · −0.0211 −0.03110 (25) · · · −0.0411 HK J× 106 −3.1367 (59) · · · −4.356 (31) · · · · # of lines 333 37 · · · 205 32 · · · RMS/kHz 43 · · · 49 · · · · σc 0.95 · · · · · · 1.03 · · · · · ·
Notes. (a)Numbers in parentheses are 1σ uncertainties in units of the last digit.(b)A
e, Be, and Ce rotational constants derived from structure
calculated at the ae-CCSD(T)/cc-pwCVQZ level of theory. Zero-point vibrational corrections ∆A0,∆B0, and∆C0and quartic centrifugal distortion
constants were calculated at the fc-CCSD(T)/cc-pV(T+d)Z level.(c)Reduced standard deviation (unitless).
Computational Chemistry (CFOUR) program package (Stanton et al. 2017;Harding et al. 2008a) in combination with Dunning’s hierarchies of correlation consistent polarized valence and polar-ized core-valence sets (Dunning et al. 2001;Peterson & Dunning 2002). The best estimate equilibrium structures have been cal-culated at the all-electron (ae) CCSD(T)/cc-pwCVQZ level of theory, which has previously been shown to yield equilibrium structures of very high quality for molecules harboring second-row elements (see, e.g., Coriani et al. 2005;Thorwirth & Harding 2009;Thorwirth et al. 2015). Centrifugal distortion constants and zero-point vibrational corrections∆B0to the rota-tional constants were calculated in the frozen-core (fc) approxi-mation at the fc-CCSD(T)/cc-pV(T+d)Z level and ground state rotational constants were obtained as B0 = Be−∆B0. In this work, the equilibrium rotational constants Beare calculated from the ae-CCSD(T)/cc-pwCVQZ structures. The calculated spec-troscopic parameters for both syn and anti vinyl mercaptan are given in Table1, and the elements of their Z-matrices are given in AppendixA.
The relative energetics of the [C2,H4,O] and [C2,H4,S] isomers were calculated using a composite thermochemistry scheme similar to the High Accuracy Extrapolated Ab ini-tio Thermochemistry (HEAT) approaches (see Bomble et al. 2006;Harding et al. 2008b). Using the CCSD(T)/cc-pwCVQZ
geometries, a series of additive contributions are calculated: the extrapolated CCSD(T)/aug-cc-pCVXZ (X = D, T, Q) correlation energy; the correlation energy from perturbative quadruple excitations with fc-CCSDT(Q)/cc-pVDZ; the anhar-monic zero-point contribution with CCSD(T)/cc-pV(T+d)Z; the diagonal Born-Oppenheimer correction with HF/aug-cc-pVTZ; and 1- and 2-electron scalar relativistic corrections with CCSD(T)/aug-cc-pCVTZ.
The relative stabilities, with CH3CHO and CH3CHS as the point of reference, are shown in Fig.2. The energetic ordering
Aldehyde
syn
-vinyl
anti
-vinyl
Cyclic
0
20
40
60
80
100
120
acetaldehyde 40.5sy
n
-VA 45.1an
ti
-VA 115.5 oxirane thioacetaldehyde 4.8sy
n
-VM 5.3an
ti
-VM 4.8 thiirane Oxygen SulfurRelative energy (kJ/mol)
Fig. 2.Energetics of the [C2,H4,X] species (X = O or S), relative to
the respective aldehydic forms, i.e., acetaldehyde and thioacetaldehyde, both set to 0 kJ mol−1.
of [C2,H4,O] isomers is in agreement with previous calculations byLattelais et al.(2009) andKarton & Talbi(2014): CH3CHO is the most stable isomer, followed by vinyl alcohol and oxi-rane. In particular, the energetics computed at the W2-F12 level byKarton & Talbi (2014) for the syn isomer of vinyl alcohol are within ∼1 kJ mol−1 of the values presented in this work. The energy difference between the syn and anti isomers has been examined theoretically (Nobes et al. 1981) and experimen-tally; the value presented (4.6 kJ mol−1) is in excellent agreement with both the microwave (4.5 ± 0.6 kJ mol−1,Rodler 1985) and the far-infrared semi-experimental determination (4.0 kJ mol−1,
A&A 623, A167 (2019)
210.2
210.25
210.3
210.35
210.4
Frequency /GHz
*
*
*
5
6
7
8
9 10 11 12 13 14 15
K
adischarge ON
discharge OFF
Fig. 3.Portion of the millimeter-wave spectrum recorded with RF dis-charge on (in red) and off (in black) showing the Kaseries in theqR(18)
(J0
← J00 = 19 ← 18) branch of syn vinyl mercaptan. For the lowest
Kavalue visible on the plot, the asymmetry splitting (Ka+ Kc = J or
J+1) is resolved. Transitions in black most likely arise from the precur-sor while transitions in red labeled with an asterisk remain unidentified (see text).
Bunn et al. 2017). The sulfur analogs [C2,H4,S] on the other hand are near-isoenergetic at the current level of treatment. With the exception of CH3CHS, the three remaining isomers are within ∼0.5 kJ mol−1 of one another, where anti-vinyl mercap-tan is the highest in energy (5.3 kJ mol−1). Our ab initio energy difference between the vinyl mercaptan isomers (0.5 kJ mol−1) is in quantitative agreement with the 0.6 kJ mol−1 estimate by Almond et al.(1985).
2.3. Millimeter-wave spectroscopy
Millimeter-wave measurements on vinyl mercaptan were per-formed using the Cologne (sub)millimeter direct absorp-tion spectrometer in the spectral regions 70–120 GHz and 170–250 GHz. The radiation was produced by a commercial amplifier-multiplier chain (Virginia Diodes Inc.) and optimized by in-house electronics. To reduce 1/ f noise, frequency mod-ulation was used with a 2 f demodmod-ulation, yielding line shapes close to a second-derivative for all recorded transitions. The 5 m long discharge cell, equipped with a roof-top mirror on one end, allows 10 m of absorption path length. A detailed description of the apparatus can be found inMartin-Drumel et al.(2015). Vinyl mercaptan was produced by a radio-frequency (RF) discharge in a continuous flow of 1,2-ethanedithiol (HSCH2CH2SH) at a pressure of about 10 µbar. It should be noted, however, that since the pressure was measured between the cell and pumping stage, a sizable pressure gradient may have been present in the cell. Sim-ilar to a previous study on OSSO (Martin-Drumel et al. 2015), the strongest signals of vinyl mercaptan were observed when the RF power was reduced to fairly low powers. However, to main-tain stable discharge conditions in the cell, and thus to limit the noise induced by a “blinking” plasma, a discharge power of no less than 5 W was applied.
Upon ignition of the discharge, relatively strong transitions of both syn and anti isomers of vinyl mercaptan were observed, as illustrated in Fig.3. To derive rest frequencies as accurate as possible, rotational transitions were measured individually using frequency steps of 10 and 20 kHz in the 70–120 GHz and 170–
−0.4
−0.2
0
0.2
0.4
−1
−0.5
0
0.5
1
Offset frequency /MHz
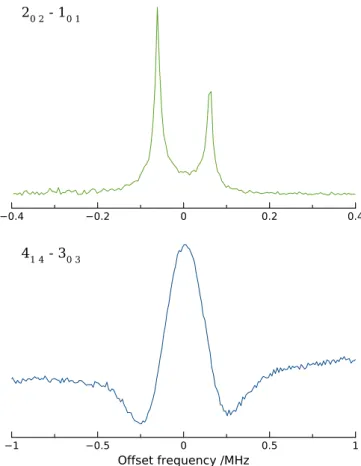
2
0 2- 1
0 14
1 4- 3
0 3Fig. 4. Two transitions of anti vinyl mercaptan recorded in the microwave (top trace, in green) and millimeter-wave (bottom trace, in blue) domains. The frequency axis is given as an offset from the rest frequencies, 22 346.6731 and 85 467.985 MHz, respectively. The dou-blet structure of the microwave transition (top spectrum) is caused by Doppler splitting, which arises because of the coaxial arrangement of the cavity axis with respect to the axis along which the gas expands; the rest frequency is taken as the average of the two components. The second derivative line shape aspect of the millimeter transition (bottom spectrum) arises from 2 f demodulation of the modulated frequency.
250 GHz regions, respectively, and signal averaging was used to reach a signal-to-noise ratio of at least 10, and up to 50 in some cases (Fig.4). The accuracy on each line frequency was derived from a fit to the line profile, accounting for the full width at half maximum (FWHM), frequency step, and signal-to-noise ratio as described inMartin-Drumel et al.(2015). Using this approach, rest frequencies were derived with uncertainties as low as 10 kHz. Ultimately, nearly 300 and 150 new transi-tions (both a- and b-type) of syn and anti isomers of vinyl mer-captan were recorded in the millimeter domain with quantum numbers up to J00= 22, K00a = 17 and J00= 19, Ka00= 14, respec-tively. We note that, besides vinyl mercaptan, other species were produced under our experimental conditions (as indicated in Fig.3). Although some of their transitions were observed with high signal-to-noise ratios, they could not be assigned to any known species using the Cologne Database for Molecular Spec-troscopy (CDMS) and NASA Jet Propulsion Laboratory (JPL) catalogs (Endres et al. 2016; Pickett et al. 1998). The carriers of these lines may be vibrational satellites of vinyl mercaptan or its precursor, 1,2-ethanedithiol, or other species produced in the discharge. Since no wide spectral surveys were conducted, however, no further line assignment attempts were made at this juncture.
2.4. Centimeter-wave spectroscopy
For each isomer of vinyl mercaptan, roughly ten transitions pre-viously observed by Tanimoto et al. (1979) and Tanimoto & Macdonald (1979) were remeasured between 10 and 35 GHz using the Cambridge Fourier-transform microwave spectrome-ter, which was described elsewhere (McCarthy et al. 2000). In doing so, uncertainties on the rest frequencies of these lines were reduced by nearly two orders of magnitude, from 100 kHz to 1 kHz. In this experiment, vinyl mercaptan was generated by a 1 kV DC discharge in the throat of a small nozzle through a mix-ture of C2H2 and H2S heavily diluted in neon and the result-ing products were supersonically expanded into a large vacuum chamber. By the time the products reach the center of the Fabry-Perot cavity, where they are probed by the microwave radiation, the rotational temperature falls to 10 K or less. An example of a microwave transition of syn-CH2CHSH is presented in Fig.4. 2.5. Astronomical observations
We searched for vinyl mercaptan in the EMoCA spectral line survey performed toward the Sgr B2(N) star-forming region with ALMA. We focused our analysis on the hot molecular core Sgr B2(N2) at the position (α, δJ2000) = (17h47m19.86s, −28◦22013.400). Details about the observations, data reduction, and method used to identify the detected lines and derive column densities can be found inBelloche et al.(2016). In short, the EMoCA survey covers the frequency range from 84.1 GHz to 114.4 GHz with a spectral resolution of 488.3 kHz (1.7 to 1.3 km s−1). It was performed with five frequency tunings called S1 to S5. The median angular resolution is 1.600.
3. Results and discussion
3.1. Rest frequencies and derived spectroscopic parameters The transitions recorded in this study are summarized in Appendix B. From these measurements, and previously pub-lished data (Tanimoto et al. 1979;Tanimoto & Macdonald 1979), a fit to a Watson-S Hamiltonian in the Ir representation was performed using the SPFIT/SPCAT suite of programs (Pickett 1991). The resulting best-fit spectroscopic constants are given in Table1.
The large number of transitions recorded in this work cou-pled with the detection of lines that originate from much higher values of J and Ka compared to the previous studies enable centrifugal distortion (CD) parameters up to sixth order to be precisely determined. In some cases, the precision of these CD parameters has been improved by as much as four orders of mag-nitude. To reproduce the measured transitions to their experi-mental accuracy, a total of nine parameters are required, includ-ing two quartic CD terms (DKand d2) and one sextic term (HK J) that were not determined previously. The much larger dataset used in the present investigation and the relatively small number of additional parameters needed point to the rapid convergence of the Hamiltonian model and the robustness of the fit. On the basis of the best-fit parameters in Table 1, the astronomically most interesting lines either have been measured or can now be predicted throughout the entire millimeter domain to better than 50 kHz up to 250 GHz (0.06 km s−1in terms of radial velocity). 3.2. Poor predictive power of extrapolating high-frequency
transitions from microwave measurements
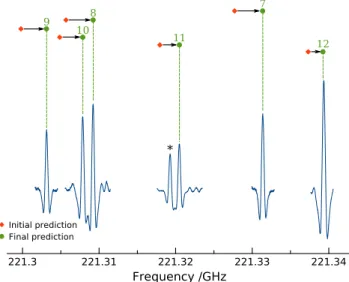
While frequency predictions based on the spectroscopic param-eters from Tanimoto et al.(1979) andTanimoto & Macdonald
221.3
221.31
221.32
221.33
221.34
Frequency /GHz
Initial prediction Final prediction7
8
9
10
11
12
*
Fig. 5.Individual transitions measured in theqR(19) branch of syn vinyl
mercaptan and comparison between the initial (red diamonds) and final (green dots) predictions. The Ka value of each transition is indicated
in green; the asymmetry splitting is not resolved for these lines. The transition labeled with an asterisk is unidentified. The line shape appears as a second derivative owing to the employed detection scheme.
(1979) have enabled many new lines to be assigned in the millimeter-wave band, this parameter set alone is inadequate to detect lines of vinyl mercaptan in astronomical sources. Many high-J, high-Katransitions, for example, were shifted from their initial predictions by a few to up to tens of MHz; e.g., the tran-sition 163 14 − 162 15 initially predicted at 226 581.2 MHz was measured at 226 532.7 MHz. In space, the most relevant tran-sitions are theqRseries for the syn isomer (∆J = 1, ∆Ka= 0) as these are the strongest lines at temperatures ranging from a few tens to a few hundreds of K. For these lines, the typical devia-tion from the initial predicdevia-tion was in the range 2–5 MHz around 200 GHz (Fig.5), corresponding to a significant fraction of the 2–10 km s−1linewidths that typify hot cores and corinos in star-forming regions. This example illustrates the pitfalls of extrapo-lating from the microwave to the millimeter and submillimeter domain, particularly for non-rigid molecules, and emphasizes the value of high-frequency laboratory measurements of astro-physically relevant species, even when microwave spectrum data are already available.
3.3. Isomers
The relative stability of isomers may be an important factor in predicting isomeric abundances in the ISM. With this motivation in mind, we performed high-level ab initio calculations (Fig.2) to determine the relative stability of [C2,H4,S] isomers and the corresponding isovalent oxygen analogs; for the former, the cal-culations presented are – to the knowledge of the authors – the first report of the relative energetics at 0 K. Because our calculations for the [C2,H4,O] isomeric family are in excellent agreement with experiments, we can in turn be confident of the [C2,H4,S] thermochemistry, which is significantly less well con-strained by measurements.
In contrast to the oxygen isomers, the four lowest single [C2,H4,S] isomers are effectively isoenergetic at our current level of theoretical sophistication. While it is unclear if a higher level of treatment (requiring sub-kJ/mol) changes the energetic order-ing of these isomers, the near-degeneracy of [C2,H4,S] isomers
A&A 623, A167 (2019)
Table 2. Parameters of our best-fit LTE model (or upper limit) of selected complex organic molecules toward Sgr B2(N2).
Molecule Statusa N
detb Sizec Trotd Ne Cf ∆Vg Voffh NNrefi Ref.
(00) (K) (cm−2) (km s−1) (km s−1) CH3SH, v= 0? d 12 1.40 180 3.4 (17) 1.00 5.4 −0.5 1 2 gauche-C2H5SH n 0 1.40 180 <1.6 (16) 1.95 5.4 −0.5 >22 2 syn-C2H3SH n 0 1.40 180 <3.7 (16) 1.22 5.4 −0.5 >9 1 anti-C2H3SH n 0 1.40 180 <1.6 (16) 1.63 5.4 −0.5 >21 1 CH3CN, v8= 1? d 20 1.40 170 2.2 (18) 1.00 5.4 −0.5 1 3 C2H5CN, v= 0 d 154 1.20 150 6.2 (18) 1.38 5.0 −0.8 0.35 3 C2H3CN, v= 0 d 44 1.10 200 4.2 (17) 1.00 6.0 −0.6 5 3 CH3OH, vt= 1? d 16 1.40 160 4.0 (19) 1.00 5.4 −0.2 1 2 C2H5OH d 168 1.25 150 2.0 (18) 1.24 5.4 0.0 20 2 syn-C2H3OH n 0 1.25 150 <4.0 (16) 1.00 5.4 0.0 >1000 1 anti-C2H3OH n 0 1.25 150 <1.2 (16) 1.00 5.4 0.0 >3333 1
Notes.(a)d: detection, n: non-detection.(b)Number of detected lines (conservative estimate, see Sect. 3 ofBelloche et al. 2016). One line of a given
species may mean a group of transitions of that species that are blended together.(c)Emission diameter (FWHM).(d)Rotational temperature.(e)Total
column density of the molecule, except for the syn and trans conformers of vinyl mercaptan and vinyl alcohol, which are in each case considered as independent species. For these species, the column density represents the column density of each conformer separately. X(Y) means X × 10Y. ( f )Correction factor that was applied to the column density to account for the contribution of vibrationally or torsionally excited states or other
conformers, in the cases where this contribution was not included in the partition function of the spectroscopic predictions.(g)Linewidth (FWHM). (h)Velocity offset with respect to the assumed systemic velocity of Sgr B2(N2), V
lsr = 74 km s−1.(i)Column density ratio, with Nrefthe column
density of the previous reference species marked with a ?.
References. (1) This work, (2)Müller et al.(2016), (3)Belloche et al.(2016).
presents a fairly unique test bed to assess possible reaction path-ways in astrochemical objects. The role of icy grains in [C2,H4,O] formation has been suggested as the underlying factor as to why abundance ratios depart from thermodynamic equilibrium (Bennett et al. 2005). Having established that both isomers of vinyl mercaptan and thiirane are effectively isoenergetic, their rel-ative interstellar abundance should present a more sensitive probe of local processes (e.g., shock and grain chemistry) than their oxy-gen analogs, which are more widely spaced in energy (Fig.2). A systematic astronomical investigation of the [C2,H4,S] fam-ily of isomers, however, is currently limited by the lack of reli-able frequencies in the millimeter and submillimeter domains for thioacetaldehyde, which is the remaining isomer for which no data has presently been published beyond the microwave domain. 3.4. Astronomical searches
Searches for the syn and anti isomers of vinyl mercaptan were performed with the EMoCA spectrum of Sgr B2(N2) using the best-fit parameters in Table 1. Weeds (Maret et al. 2011) was used to produce synthetic spectra of both isomers under the local thermodynamic equilibrium (LTE) approximation, and the same parameters (emission size, rotational temperature, linewidth, and velocity offset with respect to the assumed systemic velocity of the source) as those derived for methyl mercaptan inMüller et al.
(2016) were assumed. Hence, the only free parameters are the column densities of the syn and anti forms of vinyl mercaptan, which we consider as independent species.
No evidence was found for either isomer in the EMoCA spectrum. The upper limits of the column densities are reported in Table 2, along with the column densities or upper limits thereof derived for other molecules in our previous EMoCA studies (Müller et al. 2016; Belloche et al. 2016). In addi-tion, no evidence was found for the syn and anti isomers of vinyl alcohol using predictions derived from the pure rota-tional works reported in Saito (1976) and Rodler (1985). The corresponding upper limits of their column densities are summarized in Table2as well. The non-detection of vinyl
alco-hol with ALMA along with its non-detection with the Insti-tut de Radioastronomie Millimétrique (IRAM) 30 m telescope (Belloche et al. 2013) confirms that if vinyl alcohol were present in the Sgr B2(N) star-forming region at the level reported byTurner & Apponi(2001), whose observations with the Kitt Peak 12 m telescope did not resolve the multiple hot cores embedded in Sgr B2(N), then its emission must arise from the source envelope on large scales (>1 pc) and not from the much more compact hot cores, as already stated byBelloche et al.(2013). Surveys like the Prebiotic Interstellar Molecular Survey (PRIMOS,Neill et al. 2012) or the survey performed at the Arizona Radio Observatory (ARO;Halfen et al. 2017) may shed more light on the presence and distribution of vinyl alcohol toward Sgr B2(N).
We find that the syn and anti isomers of vinyl mercaptan are at least 9 and 21 times less abundant than methyl mercaptan, respec-tively. The energy difference between the syn and anti isomers expressed in temperature units is about 60 K, which implies that the abundance ratio of the anti to syn isomers is 0.72 for a temper-ature of 180 K. This means that the total column density of vinyl mercaptan at this temperature is 1.72 times that of the syn isomer or equivalently 2.4 times that of the anti isomer. The most strin-gent constraint on the total column density of vinyl mercaptan is provided by the anti isomer: vinyl mercaptan is at least ∼9 times (21/2.4) less abundant than methyl mercaptan.
The lower limit for the abundance ratio of vinyl to methyl mer-captan can be compared to ratios obtained for other families of molecules. It is nearly a factor of two higher than the abundance ratio measured for the cyanides ([CH3CN]/[C2H3CN]= 5). For vinyl alcohol, the large energy difference between the syn and anti isomers (4.6 kJ mol−1, i.e., 385 cm−1, Fig.2) implies that the total column density of vinyl alcohol is equal to 1.025 times that of the syn isomer at 150 K. We thus conclude that vinyl alcohol is at least 1000 times less abundant than methanol. This lower limit is more than two orders of magnitude higher than the ratio mea-sured for the cyanides. Given that the abundance ratio of methanol to ethanol is also higher (by a factor ∼60) than the abundance ratio of the corresponding cyanides, the chemistries of the cyanides and alcohols appear to differ significantly. However, the observational
constraints do not tell us whether the chemistries of the mercap-tans and alcohols are similar or differ: the lower limit to the ratio of methyl to ethyl mercaptan is marginally consistent with the cor-responding ratio measured for the alcohols, and the lower limits to the ratio of the methyl to vinyl species do not exclude a similar ratio in both families.
4. Conclusions
In the present study, a rotational investigation of the two iso-mers of vinyl mercaptan has been extended up to 250 GHz. The new set of transition frequencies and derived spectroscopic con-stants provide a highly reliable basis for subsequent searches for both species in the ISM. Calculations of the rotational spectra are available in the catalog section of the CDMS (Endres et al. 2016) database2while linelists, parameters, fits, and auxiliary files are
available in the data section3.
The work performed in this study highlights the urgent need for high-frequency measurements of numerous species of interstellar interest that so far have only been characterized at centimeter wavelengths. Indeed, most of the current ISM obser-vations are now performed in the millimeter and submillimeter domains, using facilities such as ALMA, NOEMA, APEX, and SOFIA, but frequency extrapolations into the millime-ter domain using spectroscopic constants derived from low J and Ka observations are inherently uncertain, and make detection of new astronomical species unduly challenging. Additionally, this work provides constraints on isomeric popu-lations in the ISM. Both syn and anti vinyl mercaptan have been the subjects of searches in the EMoCA survey recorded toward the hot core Sgr B2(N2). No transitions of either species has been detected and upper limits for their column densities have been derived, revealing that vinyl mercaptan is at least nine times less abundant than methyl mercaptan in this source.
Acknowledgements. Part of this work is carried out within the Collaborative Research Centre 956, sub-project B3, funded by the Deutsche Forschungsge-meinschaft (DFG) – project ID 184018867, and the NSF grant AST-1615847. M.-A. M.-D. is thankful to the Programme National “Physique et Chimie du Milieu Interstellaire” (PCMI) of CNRS/INSU with INC/INP co-funded by CEA and CNES for support. M.C.M. thanks NASA grants NNX13AE59G and 80NSSC18K0396.
References
Almond, V., Charles, S. W., MacDonald, J. N., & Owen, N. L. 1977,J. Chem. Soc. Chem. Commun., 483
Almond, V., Charles, S. W., MacDonald, J. N., & Owen, N. L. 1983,J. Mol. Struct., 100, 223
Almond, V., Permanand, R., & Macdonald, J. 1985,J. Mol. Struct., 128, 337
Anderson, D. E., Bergin, E. A., Maret, S., & Wakelam, V. 2013,ApJ, 779, 141
Bane, M. K., Thompson, C. D., Appadoo, D. R. T., & McNaughton, D. 2012,J. Chem. Phys., 137, 084306
Belloche, A., Müller, H. S. P., Menten, K. M., Schilke, P., & Comito, C. 2013,
A&A, 559, A47
Belloche, A., Müller, H. S. P., Garrod, R. T., & Menten, K. M. 2016,A&A, 587, A91
Bennett, C. J., Osamura, Y., Lebar, M. D., & Kaiser, R. I. 2005, ApJ, 634, 698
Bockelee-Morvan, D., Lis, D. C., Wink, J. E., et al. 2000,A&A, 353, 1101
Bomble, Y. J., Vazquez, J., Kallay, M., et al. 2006,J. Chem. Phys., 125, 064108, wOS:000239765100010
Boogert, A. C. A., Schutte, W. A., Helmich, F. P., Tielens, A. G. G. M., & Wooden, D. H. 1997,A&A, 317, 929
2 https://cdms.astro.uni-koeln.de/classic/entries/ 3 https://cdms.astro.uni-koeln.de/classic/
predictions/daten/VySH/
Bunn, H., Hudson, R. J., Gentleman, A. S., & Raston, P. L. 2017,ACS Earth Space Chem., 1, 70
Cazzoli, G., Lattanzi, V., Kirsch, T., et al. 2016,A&A, 591, A126
Chin, W., Mok, C., & Huang, H. 1994,J. Electron. Spectrosc. Relat. Phenom., 67, 173
Coriani, S., Marcheson, D., Gauss, J., et al. 2005,J. Chem. Phys., 123, 184107
Cunningham, Jr., G. L., Boyd, A. W., Myers, R. J., Gwinn, W. D., & Le Van, W. I. 1951,J. Chem. Phys., 19, 676
Dickens, J. E., Irvine, W. M., Ohishi, M., et al. 1997,ApJ, 489, 753
Dunning, T. H., Peterson, K. A., & Wilson, A. K. 2001,J. Chem. Phys., 114, 9244
Endres, C. P., Schlemmer, S., Schilke, P., Stutzki, J., & Muller, H. S. P. 2016,J. Mol. Spectrosc., 327, 95
Gottlieb, C. A. 1973, inMolecules in the Galactic Environment, eds. M. A. Gordon, & L. E. Snyder, 181
Halfen, D. T., Woolf, N. J., & Ziurys, L. M. 2017,ApJ, 845, 158
Harding, M. E., Metzroth, T., Gauss, J., & Auer, A. A. 2008a,J. Chem. Theory Comput., 4, 64
Harding, M. E., Vazquez, J., & Ruscic, B. 2008b,J. Chem. Phys., 128, 114111
Hirao, T., Okabayashi, T., & Tanimoto, M. 2001,J. Mol. Spectr., 208, 148
Jimenez-Escobar, A., & Munoz Caro, G. M. 2011,A&A, 536, A91
Joseph, C. L., Snow, T. P., Seab, C. G., & Crutcher, R. M. 1986,ApJ, 309, 771
Karton, A., & Talbi, D. 2014,Chem. Phys., 436–437, 22
Kolesniková, L., Tercero, B., Cernicharo, J., et al. 2014,ApJ, 784, L7
Kroto, H. W., Landsberg, B. M., Suffolk, R. J., & Vodden, A. 1974,Chem. Phys. Lett., 29, 265
Lattelais, M., Pauzat, F., Ellinger, Y., & Ceccarelli, C. 2009,Astrophys. Lett., 696, L133
Loomis, R. A., McGuire, B. A., Shingledecker, C., et al. 2015,ApJ, 799, 34
Maret, S., Hily-Blant, P., Pety, J., Bardeau, S., & Reynier, E. 2011,A&A, 526, A47
Martin-Drumel, M., van Wijngaarden, J., Zingsheim, O., et al. 2015,J. Mol. Spectr., 307, 33
Martin-Domenech, R., Jimenez-Serra, I., Munoz Caro, G. M., et al. 2016,A&A, 585, A112
McCarthy, M. C., Chen, W., Travers, M. J., & Thaddeus, P. 2000,ApJS, 129, 611
Menten, K. M., Wyrowski, F., Belloche, A., et al. 2011,A&A, 525, A77
Müller, H. S. P., Belloche, A., Xu, L.-H., et al. 2016,A&A, 587, A92
Neill, J. L., Muckle, M. T., Zaleski, D. P., et al. 2012,ApJ, 755, 153
Neufeld, D. A., Falgarone, E., Gerin, M., et al. 2012,A&A, 542, L6
Neufeld, D. A., Godard, B., Gerin, M., et al. 2015,A&A, 577, A49
Nobes, R. H., Radom, L., & Allinger, N. L. 1981,J. Mol. Struct., 85, 185
Palumbo, M. E., Tielens, A. G. G. M., & Tokunaga, A. T. 1995,ApJ
Peterson, K. A., & Dunning, T. H. 2002,J. Chem. Phys., 117, 10548
Pickett, H. M. 1991,J. Mol. Spectr., 148, 371
Pickett, H. M., Poynter, R. L., Cohen, E. A., et al. 1998,J. Quant. Spectr. Rad. Transfer, 60, 883
Plant, C., Boggs, J., Macdonald, J., & Williams, G. 1992,Struct. Chem., 3, 3
Raghavachari, K., Trucks, G. W., Pople, J. A., & Head-Gordon, M. 1989,Chem. Phys. Lett., 157, 479
Rodler, M. 1985,J. Mol. Spectr., 114, 23
Saito, S. 1976,Chem. Phys. Lett., 42, 399
Savage, B. D., & Sembach, K. R. 1996,ARA&A, 34, 279
Scappini, F., Cecchi-Pestellini, C., Smith, H., Klemperer, W., & Dalgarno, A. 2003,MNRAS, 341, 657
Smith, R. G. 1991,MNRAS, 249, 172
Stanton, J. F., Gauss, J., Harding, M. E., & Szalay, P. G. 2017, cfour, a quantum chemical program package for the current version, seehttp://www.cfour. de
Tanimoto, M., & Macdonald, J. 1979,J. Mol. Spectr., 78, 106
Tanimoto, M., & Saito, S. 1977,Chem. Lett., 6, 637
Tanimoto, M., Almond, V., Charles, S., Macdonald, J., & Owen, N. 1979,J. Mol. Spectr., 78, 95
Thorwirth, S., & Harding, M. E. 2009,J. Chem. Phys., 130, 214303
Thorwirth, S., Kaiser, R. I., Crabtree, K. N., & McCarthy, M. C. 2015,Chem. Commun., 51, 11305
Tieftrunk, A., Forets, G. P. D., Schilke, P., & Walmsley, C. M. 1994,A&A, 289, 579
Turner, B. E., & Apponi, A. J. 2001,ApJ, 561, L207
Wakelam, V., Caselli, R., Ceccarelli, C., Herbst, E., & Castets, A. 2004,A&A, 422, 159
A&A 623, A167 (2019)
Appendix A: Molecular structures of the [C2,H4,S] isomers
Internal coordinates ae-CCSD(T)/cc-pwCVQZ syn vinyl mercaptan
H C 1 r1 C 2 r2 1 a1 S 3 r3 2 a2 1 d0 H 4 r4 3 a3 2 d0 H 2 r5 3 a4 1 d180 H 3 r6 2 a5 6 d0 r1 = 1.08115 r2 = 1.33270 a1 = 122.05669 r3 = 1.75221 a2 = 127.33692 d0 = 0.00000 r4 = 1.33663 a3 = 96.56932 r5 = 1.07962 a4 = 120.07569 d180 = 180.00000 r6 = 1.08206 a5 = 120.75551
anti vinyl mercaptan H C 1 r1 C 2 r2 1 a1 S 3 r3 2 a2 1 d1 H 4 r4 3 a3 2 d2 H 2 r5 3 a4 1 d3 H 3 r6 2 a5 6 d4 r1 = 1.08105 r2 = 1.33250 a1 = 121.79666 r3 = 1.75849 a2 = 122.52864 d1 = 3.65449 r4 = 1.33431 a3 = 96.59150 d2 = -159.42502 r5 = 1.07959 a4 = 120.21684 d3 = -179.52134 r6 = 1.08069 a5 = 121.24236 d4 = 0.62115 thiirane S C 1 r1 C 1 r1 1 a1 H 2 r2 1 a2 3 d1 H 2 r2 1 a2 3 md1 H 3 r2 1 a2 2 d1 H 3 r2 1 a2 2 md1 r1 = 1.81067 a1 = 48.27245 r2 = 1.07991 a2 = 115.09725 d1 = 110.93875 md1 = -110.93875 thioacetaldehyde S C 1 r1 C 2 r2 1 a1 H 3 r3 2 a2 1 d0 H 2 r4 3 a3 1 d180 H 3 r5 2 a4 5 d1 H 3 r5 2 a4 5 md1 r1 = 1.61419 r2 = 1.49172 a1 = 125.71288 r3 = 1.08597 a2 = 111.24050 d0 = 0.00000 r4 = 1.08887 a3 = 115.25385 d180 = 180.00000 r5 = 1.09181 a4 = 109.69777 d1 = 58.47364 md1 = -58.47364
Appendix B: Observed experimental transitions of vinyl mercaptan
Tables B.1 and B.2 are available at the CDS.
![Fig. 2. Energetics of the [C 2 ,H 4 ,X] species (X = O or S), relative to the respective aldehydic forms, i.e., acetaldehyde and thioacetaldehyde, both set to 0 kJ mol − 1 .](https://thumb-eu.123doks.com/thumbv2/123doknet/13179078.391096/4.892.459.834.619.901/energetics-species-relative-respective-aldehydic-forms-acetaldehyde-thioacetaldehyde.webp)