HAL Id: halshs-00743051
https://halshs.archives-ouvertes.fr/halshs-00743051
Submitted on 22 Oct 2012
HAL is a multi-disciplinary open access
archive for the deposit and dissemination of
sci-entific research documents, whether they are
pub-lished or not. The documents may come from
teaching and research institutions in France or
abroad, or from public or private research centers.
L’archive ouverte pluridisciplinaire HAL, est
destinée au dépôt et à la diffusion de documents
scientifiques de niveau recherche, publiés ou non,
émanant des établissements d’enseignement et de
recherche français ou étrangers, des laboratoires
publics ou privés.
Distributed under a Creative Commons Attribution - ShareAlike| 4.0 International
Eric Denis, Partha Mukhopadhyay, Marie-Hélène Zérah
To cite this version:
Eric Denis, Partha Mukhopadhyay, Marie-Hélène Zérah. Subaltern Urbanisation in India. Economic
and political weekly, Economic & Political Weekly, 2012, XLVII (30), pp.52-62. �halshs-00743051�
Subaltern Urbanisation in India
Eric Denis Partha Mukhopadhyay Marie Hélène Zerah
Institut Français de Pondichéry Centre for Policy Research Centre de Sciences Humaines July 7, 2012
Abstract
This paper proposes an approach to urbanisation processes by defining a concept of subaltern urbanisation, which refers to growth of settlement agglomerations (which may or may not be denoted urban by the Census of India) that are autonomous and independent from the metropolis and interact with other settlements, whether local or global. Analysing conventional and new data sources against the grain , it claims that there is support for the existence of economically vital small settlements, contrary to perceptions that India s urbanisation is low, its smaller settlements are stagnant and its cities are not productive. It offers a classification scheme for settlements using the axes of spatial proximity to metropolises and degree of administrative recognition (invisible, denied, contested and recognised), and looks at the potential factors of their transformation along economic, social and political dimensions. It concludes that much of Indian urbanisation is a distinct story; a contribution made by the people on their own . Instead of basing policy on illusions of control, it is better to understand how agents make this world. Understanding this is critical for comprehending the ongoing Indian transformation.
Acknowledgements: The paper has benefitted substantially from constructive comments of an
anonymous referee, for which we are grateful. The authors would also like to thank foremost the SUBURBIN team for many useful and contentious conversations that helped to shape this paper and the other participants of the SUBURBIN workshop held on April 16 and 17, 2012. Sanjoy Chakravorty and Pratap Bhanu Mehta provided incisive and helpful comments. We are also indebted to Kanhu Charan Pradhan for invaluable assistance with the analysis and for sharing his preliminary findings. Shamindra Roy assisted with the geo-spatial analysis and Manka Bajaj provided valuable editorial comments. The errors that remain are, needless to say, our responsibility.
Introduction
It may be useful to begin by dissecting our title, since in our initial presentations of this work; it has been at the forefront of discussion. At one level, the phrase subaltern urbanisation is perhaps best seen as a literary device to focus attention on our area of inquiry, to increase the possibility of discursive engagement, arguably in the tradition of another such phrase, viz. global city . As Robinson (2002) put it: If the global city were labelled as just another example of an industrial district (perhaps it should rather be called: new industrial districts of transnational management and control), it might not have attracted the attention it did (p. 536). At another level, we would be remiss if we did not acknowledge that there is a link, howsoever tenuous, with the wide literature on subaltern studies. In particular, there is an attempt in our work to interpret as Guha (1982) says, the contribution made by the people on their own, that is independently of the elite and a whiff of reading the official urbanisation data against the grain . To engage with this aspect and locate our attempt within this intellectual tradition is outside the scope of this paper and our competence. It is for others, with a deeper understanding of this tradition, to critically appraise the relationship, if any.
For the purposes of this paper, subaltern urbanisation refers to growth of settlement agglomerations (which may or may not be denoted urban by the Census of India) that are generated by market and historical forces which are not (a) dependent on large traditionally (economically) important settlements or (b) planned cities like Chandigarh and Bhubaneswar or industrial townships like Mithapur, in Jamnagar district, Gujarat. The attempt is to investigate growth of settlements beyond that (i) driven by the economics of agglomeration, as advanced by the new economic geography, summarized by Venables (2005) or (ii) directly orchestrated by the state or private corporate enterprise. Of course, the involvement of the state cannot be abjured completely, e.g., the improvement of roads and the provision of electricity are all necessary elements in the growth of settlements. Some of these are not spatially directed towards a specific settlement. Others, such as the establishment of a mandi, are more spatially focused, but a more limited intervention, as compared to planned cities.
It is useful at this stage to distinguish this notion from a few other concepts currently in use, such as subaltern urbanism, peri-urban, suburbanisation, rurbanisation and exclusionary urbanisation. Roy (2011) offers two prominent themes, viz. economic entrepreneurialism and political agency (p. 227), while advancing the notion of subaltern urbanism. In spirit, there is substantive similarity in our approach, the main difference being that of the area and scale of inquiry. While subaltern urbanism is a very innovative conceptual theorization of the large cities of the South, it is located largely within the city. In comparison, our inquiry relates more to
cities as a system and their interrelationships. Of course, as seen below, there is a similarity of approach in looking for the agency of the people in these cities, which may be ignored by policy makers and elites, but as noted above, we do not interrogate their subalternity.
Since the recent past has seen considerable spatial expansion of large metropolitan cities, a growing body of research has focused on understanding their peripheries which are often seen as dependent on the core city for their economic base and as such peripheral growth would not satisfy the definition of subaltern urbanisation. However, in discussing the peri-urban, Dupont (2007) points to the diversity of these spaces, which she argues are not neutral in their location. Metropolitan peripheries are, in fact, complex structures resulting from a mix of planned operations and unplanned, uncontrolled processes and the flouting of regulations. Urbanisation of the rural fringes, in consequence, covers a wide range of modalities (p.93). It is possible therefore that there may be peri-urban growth is not dependent on metropolitan city, and thus subaltern urbanisation may exist even in the periphery of large metropolitan areas.
Suburban development in North America is often seen as the mirror image of hollowing out of the core city. Suburbs were conventionally seen as residential spaces, with the city continuing to provide the economic basis. Over time, many of these spaces have acquired substantial economic activity, especially as the economy has moved from manufacturing to services. The inapplicability of the American model to other regions has also become more apparent. Recently Ekers, et al (2012) have defined suburbanisation as the combination of non-central population and economic growth with urban spatial expansion (p. 407) and include in their ambit the process of constructing residential enclaves, squatter settlements, commercial developments, business and industrial parks, and fragmented infrastructure on the peripheries (p. 407). This approach has many philosophical commonalities with ours, viz. (i) in according governance a central place and trying to understand it through connections between a variety of actors and processes, (ii) the focus on the question of land and change of land use, and (iii) the recognition of the embedded nature of local histories of places and the importance of idiosyncrasy, though subaltern urbanisation looks at locations well beyond the suburb.
Kundu (2011a) provides a comprehensive delineation of his thesis on exclusionary urbanisation where the poor are relegated to the degenerated peripheries. The spatial dimension of poverty is also highlighted in the work of Murgai and Lanjouw (2010), where, using the technique of small area estimation1, they show increase in poverty, with increasing distance from the town. As will hopefully become clear below, though we share with Kundu his question of inclusiveness/
and the apparent presence of a policy void, subaltern urbanisation perhaps differs from this approach in investigating the nature of agency available outside of the large cities, leading to the growth of small and medium-sized urban settlements where Kundu seeks his solution to the problem of exclusionary urbanisation.
The possible interconnectedness of urban and rural in subaltern urbanisation is also central in the work of Revi et al. (2006) with their proposed concept of RUrbanism, which is integrating the urban with the rural - so that there is a co-evolution of the countryside and of the city that is embedded within it (p. 58). However, while the focus of RUrbanism is to think through urban design by understanding the interstitial spaces that remain between the city and the countryside with a view to overall sustainability and better understanding of urban-rural linkages, it is less concerned with the question of economic and social transformation per se, as well as with the question of governance of these urban centres.
There are a number of possible intersections between these various concepts and subaltern urbanisation. To the extent that subaltern urbanisation may be occurring even in settlements located at the peripheries of large agglomerations, we are concerned with peri-urban and suburban governance. The foregrounding of autonomy in the concept of subaltern urbanisation means that it has to engage with what is happening within the city, in particular, the place of the informal city and the possibility of subaltern or occupancy urbanism in the sense of Benjamin (2008). The question of urban-rural linkages might become important to our inquiry, as one of the processes supporting subaltern urbanisation.
Subaltern urbanisation differs from these in focusing on the extent of autonomy of the settlement from the metropolis, the extent to which it is on its own, not in the sense of autarky, but in the sense of being able to affect its growth process and interact autonomously with other settlements, whether local or global. It also focuses on the spaces away from the metropolis. The existence of subaltern urbanisation should result in the emergence of vital smaller settlements outside the shadow of the large metropolis. Such settlements indicate a pattern of urbanisation that is extensive, widespread, economically vital and independent of the metropolis. The rest of the paper is structured as follows. The next section reviews the pattern of urbanisation in India, arguing that it supports the existence of vital small settlements. The succeeding section initiates a conceptual framework for subaltern urbanisation by laying out the characteristics and a typology for subaltern urbanisation. The final section concludes.
Pattern of Urbanisation in India
The extent and pattern of urbanisation in India raises concerns among many. The Planning Commission (2011) believes that urbanization in India has occurred more slowly than in other developing countries and the proportion of the population in urban areas is only 28 per cent (p. 378). More recently, the results from the Census of 2011, and his inability to discern much industrialisation, prompt Nijman (2012), to infer that rural-urban migration has been particularly significant to smaller cities, and that it is driven by the poor performance of the agricultural sector in the surrounding countryside rather than by a pull from increased industrialization in cities (p. 14). He opines that the productive capacity of India s cities is a major obstacle to sustainable development.2 The same data from Census 2011 prompts Kundu (2011b) to worry about the decline in demographic growth in districts within the metro cities, suggesting that these have become less welcoming to prospective migrants, [raising] concerns about exclusionary urbanisation (p.10). On the other hand, the small and medium towns, located away from the emerging global centres of growth , particularly those in backward regions, have failed to attract substantial private investment (Kundu 2011a: 21). He feels that the urbanisation process has, thus, become concentrated in developed regions and larger cities in recent years, with backward areas and smaller towns tending to stagnate (p.24). The discussion below examines these three common assumptions, viz. India s urbanisation is low, its smaller settlements are stagnant and while its villages repel, its cities do not attract. If true, the possibility for subaltern urbanisation would be low. However, we shall show that these assumptions may be misplaced.
How urban is India?
Is India really as under-urbanised as usually stated? The definition of urban as recognised by the Census of India has been evolving over time.3 In 1872, the sole criterion for classification as a town was a population of 5,000. In 1881, it became much more subjective, defining a town as a collection of numerous dwellings near each other within a limited area, having shops which provide a continual open market for the supply of goods, especially of manufactured goods . It thus brought in, however imperfectly, the two other categories that comprise the definition today, viz. density ( dwellings near each other within a limited area ) and the nature of economic activity. In 1891, the population size of 5,000 was reinstated as a criterion for settlements that were not under Municipal or Chaukidari Act , emphasising that the place should not be merely a large village, but should have some distinctly urban character, as that of a market town , in part, to exclude a considerable number of the large aggregates of
The consequence of this definition was the identification of 2,035 settlements, containing 9.48% of the population, of which only 78 were more than 50,000 in size and 1,401 were less than 10,000 in population. Subsequent census instructions repeated the injunction that it was
undesirable to classify as towns overgrown villages which have no urban characteristics , thus foreshadowing the attempt by Wirth (1938) to define urban areas by means of certain behavioural characteristics; requiring places called towns to possess urban characteristics . Despite this injunction, the 1921 census managed to identify 1,040 settlements (comprising 22% of the urban population) that were towns arbitrarily classified as such for census purposes , a close correlate to Census Towns today. The subsequent 1931 census saw a decrease in the number of such arbitrarily classified towns to 600, with 11% of the share of urban population, and an increase in the number of administratively designated towns by 699. The first post-independence census of 1951 did briefly allow that places with a smaller population [than 5,000] with definite urban character may be treated as separate towns , but the challenge to the size criterion was short-lived. In 1961, the currently used three-fold definition came into being. It depends either on an administrative declaration of a settlement as an urban local body or on satisfying three conditions, viz. (i) size (greater than 5,000 persons in a settlement), (ii) density (more than 400 per square kilometre) and (iii) structure of the labour force (more than 75% of the male workforce in non-agricultural occupations).
As a definition, this Indian definition is unique in the world. This is to emphasize that the notion of urbanisation differs considerably across the world. Even where countries use a single parameter, such as population, the level could vary from as low as 200 in Greenland, Iceland and Norway to 20,000 in Turkey.4 Urbanisation using national metrics is therefore broadly non-comparable across countries. There are efforts such as the e-Geopolis project5 that are attempting to apply a consistent measure across all countries and one of the authors is involved in that project. However, completion of that effort is still some time away, though we shall later be presenting some of the information from the application of the measure to India.
But, would the extent of Indian urbanisation really change under different lenses? Uchida and Nelson (2010) try to measure the extent of Indian population that lives within an hour s commute of a large town. They find, using data from the 2001 census (when the official urbanisation rate was 27.8%), that when the large town is defined as one with at least 100,000 people, around 42.9% live within that zone, and more than half the population live within an hour of a town of at least 50,000 people. In comparison, the urbanisation rate of China does not change much with this adjustment from its official rate of 36%. According to this study, therefore, India was more urbanised than China in 2001.
The Indiapolis project attempts a different approach to this issue. It is a part of the global comparative e-geopolis project, which is trying to measure urbanisation with a common international definition using satellite imagery. An unit, called a settlement agglomeration (SA) for convenience (and to distinguish it from Urban Agglomerations, which is a known concept in the Indian census) is constructed on the basis of contiguous built up area, as discerned from satellite imagery, where contiguity is defined as built up areas that are less than 200 metres apart from each other. These SAs are then matched geo-spatially with the geo-codes of settlements from the Census of India6 to obtain their population and a cut-off level of 10,000 for each SA is used as a measure of urbanisation. A SA may therefore consist of multiple settlements. Reporting on the application of this approach Denis and Marius-Gnanou (2011) find that compared to towns with at least 10,000 inhabitants, which contained 26.6% of the population in 2011, the SAs of more than 10,000 contained 37.5% of the population. Some states showed more dramatic differences. While Kerala with its desakota settlement structure becomes almost entirely urban;7 among the larger states, Bihar (31.2% instead of 10.4%) and West Bengal (46.6% instead of 27.2%) show the largest difference between the agglomeration rate and the official urban rate. In large part, this is because these large settlements, especially in Bihar, fail to satisfy the official requirement that 75% of the male workforce must be engaged in non-farm work for a settlement to qualify as urban, reflecting the conflation of non-farm work with urban character in the Indian definition. In part, India s comparatively low level of urbanisation depends on the inclusion of economic character as one of the characteristics. Internationally, this is an uncommon characteristic8. Using the same census data, but applying different filters, as shown above, reading the data against the grain , as it were, the extent of urbanisation in India could look much higher.
How concentrated is Indian urbanisation?
We now examine the place of India s smaller cities. What is the spatial picture with respect to urbanisation in India? How diffused is it and are the urban areas outside the metropolis really stagnating? We examine this question using different metrics. First, we look at the district level variations in overall population growth, second, we scrutinize the extent and location of the unprecedented growth of census towns over 2001-11, and third, we analyse the emergence of large towns over 1961-2011.
District level variations in population growth
population has grown at 1.2%, the urban population has risen by 3.4% per annum over this period. Population growth at the district level within state also shows similar variations. In a given state, some districts grow much faster than other districts. Mukhopadhyay and Pradhan (2012) have recently grouped states into six categories based on the location of their high-growth districts.9 They are divided into districts that include the state capital, districts that border the district that includes the state or national capital, i.e., in the periphery of the state or national capital and those other districts. Furthermore, states are divided into those with a single high-growth district, and those with more than one high-high-growth district. Five states, viz., Assam, Bihar, Himachal Pradesh, Nagaland, and Uttarakhand do not have any high-growth districts. Table 1 presents the results of this exercise for the states with at least ten districts.
Table 1: Location of High-Growth Districts
Single Growth Centre Multiple Growth Centres District(s) including
State Capital Karnataka
Chhattisgarh, Madhya Pradesh, Orissa
District(s) Peripheral to State or National Capital
Andhra Pradesh, Arunachal Pradesh, Haryana, Punjab
Maharashtra, Tamil Nadu, Jammu and Kashmir, Uttar Pradesh
Other District(s) Jharkhand, Kerala Gujarat, Rajasthan, West Bengal
There are two factors that are immediately apparent. First, there is significant diversity in the pattern across states. Second, the state capital figures prominently in twelve of the seventeen states (twenty two, if one includes the even growth states) in the table. Apart from the five states of Jharkhand, Kerala, Gujarat, Rajasthan and West Bengal, the district that included the state (or national) capital or a bordering district was either the sole high-growth district or one of the high growth districts. While Bengaluru is the only district with the state capital to be the sole high-growth district10, Rangareddy near Hyderabad, Mohali near Chandigarh, Thane near Mumbai and Kancheepuram near Chennai were peripheral districts to the state capital that were among the high-growth districts in their states. In addition, Gurgaon in Haryana and Ghaziabad and NOIDA in Uttar Pradesh were the districts near the national capital that were among the high-growth districts in their states. Thus, while Kundu (2011b) is correct in noting the decline in growth of the metropolitan centres (all of which are state or national capitals), in many states their peripheries are growing significantly faster than the rest of the state. It is arguable whether it indicates that spatial proximity to the political centre is a factor in growth.11
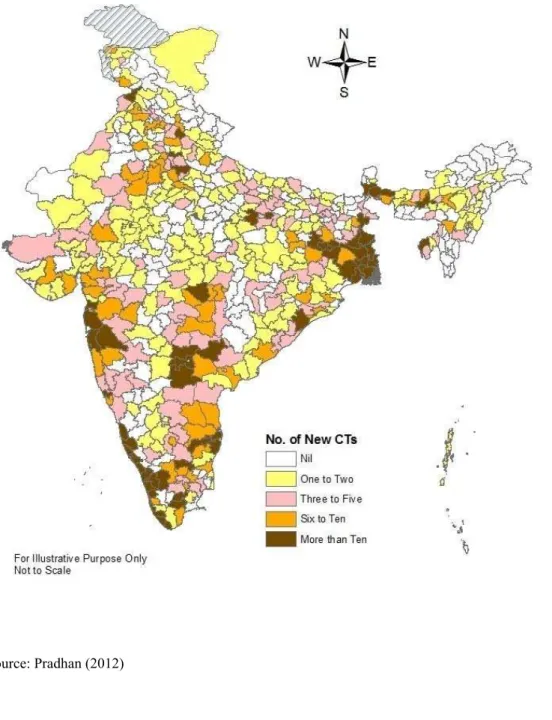
Figure 1: Spatial Distribution of New Census Towns
Census Towns
The Census of 2011 shows a large growth in census towns, i.e., urbanisation outside recognised urban local bodies. The sharp rise in these census towns has given rise to speculation (Kundu 2011c) about whether this was part of an effort to increase the extent of urbanisation in India. The census towns themselves are identified ex-ante since the census schedules differ by urban and rural areas (in terms of amenities, etc.) and therefore can possibly be influenced by subjective bias on part of the census officials.12 While population data for 2011 from the census on these towns is awaited, Pradhan (2012) has studied the spatial pattern of these settlements using an unexploited source prepared by the Census of India, which lists all geographical units in 2011 and its mapping with 2001 census.13 Using the population of these settlements from the 2001 Census, it is possible to obtain an estimate of the contribution of these census towns to the increase in urbanisation. Further, using the geo-codes of these settlements, it is also possible to study whether they are located in proximity to existing towns.
Pradhan finds that 26% to 29.5%14 of the urban growth from 2001 to 2011 can be attributed to the recognition of new census towns, varying from a high of nearly 90% in Kerala and 60% in West Bengal to less than 10% in states like Karnataka and Gujarat. By contrast, only 8.4% of the growth in urban population over 1991 to 2001 was due to new census towns. Not all of this growth of census towns is occurring around existing large towns. Using a differentiated spatial buffer around towns above 100,00015, he finds that only 37.2%, or 926 (of 2489) settlements of these settlements and 33.6% of the population fall within these buffers, indicating that much of this growth is outside the peripheries of existing large towns. The spatial distribution of new census towns in Figure 1 shows that while there is a high concentration in certain districts close to metropolitan cities, the formation of census towns is also widely spread across the country. This indicates that the process of spontaneous transformation of settlements, reflected in the growth of census towns beyond metros, is a relatively widespread geographical phenomenon.
Emergence of Large Cities
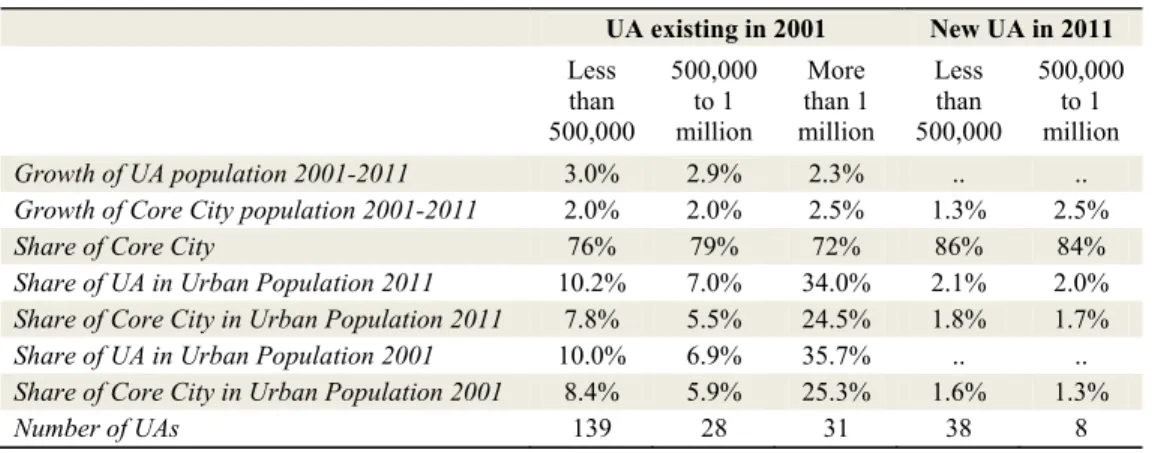
The census has recently released data on the growth of urban agglomerations (UAs), which contain at least one town with a population of more than 100,000. There are 244 such UAs, of which 198 existed in 2001 and 46 are new additions. Comparing this data with the 198 urban agglomerations from the 2001 census, we find (see Table 2) that the share of total urban population in the old UAs has dipped slightly, from 53% to 51%, with most of the decline attributable to the larger UAs, above 1 million in size. However, the share of population in such UAs in 2011 has increased with the addition of new UAs, which comprise 4% of the current population (the core city constituting these UAs accounted for 2.9% of the population in 2001).
Furthermore, for the smaller UAs (less than 1 million) as a class, the growth of the UA is more than the core town, indicating possible peripheral growth even in smaller settlements.16
Table 2 Growth of Urban Agglomerations and their Core City
UA existing in 2001 New UA in 2011 Less than 500,000 500,000 to 1 million More than 1 million Less than 500,000 500,000 to 1 million Growth of UA population 2001-2011 3.0% 2.9% 2.3% .. ..
Growth of Core City population 2001-2011 2.0% 2.0% 2.5% 1.3% 2.5%
Share of Core City 76% 79% 72% 86% 84%
Share of UA in Urban Population 2011 10.2% 7.0% 34.0% 2.1% 2.0%
Share of Core City in Urban Population 2011 7.8% 5.5% 24.5% 1.8% 1.7%
Share of UA in Urban Population 2001 10.0% 6.9% 35.7% .. ..
Share of Core City in Urban Population 2001 8.4% 5.9% 25.3% 1.6% 1.3%
Number of UAs 139 28 31 38 8
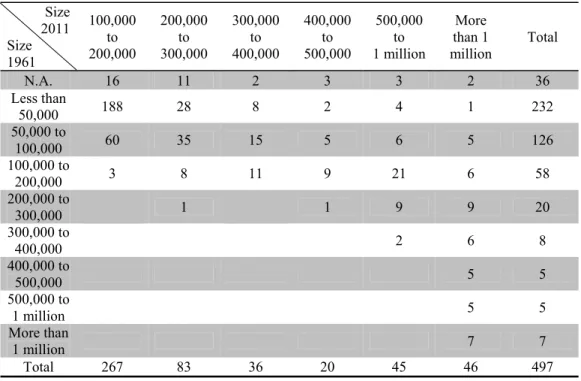
What is the origin of these towns? In 2011, there are 497 class I towns, i.e., those that are more than 100,000 in population (including stand-alone class I towns that are not part of an UA). What were these towns like in 1961, the first year when the current definition of urbanisation was used? Table 3a gives the transition matrix in terms of number of towns while Table 3b provides it in terms of share of population. Of the 497 towns of more than 100,000 today, 37 did not have any reported population in 1961. Of the 232 that had a population of less than 50,000, two are today towns of more than one million.
Table 3b shows that while 57% of the population of current million plus towns lived in towns of 500,000 or more in 1961, 9% of the population were in towns of less than 100,000 or no reported population. Similarly, 29% of the population of current towns with population between 500,000 to 1 million were in towns of less than 100,000 or no reported population. These transition matrices testify to the inherent dynamics of some of these small towns. The fact that many large towns today were relatively small in the past indicates that the vitality of small towns is not a new feature of Indian urbanisation.
Table 3a Transition Matrix: Origins of Large Towns in 2011 Size 2011 Size 1961 100,000 to 200,000 200,000 to 300,000 300,000 to 400,000 400,000 to 500,000 500,000 to 1 million More than 1 million Total N.A. 16 11 2 3 3 2 36 Less than 50,000 188 28 8 2 4 1 232 50,000 to 100,000 60 35 15 5 6 5 126 100,000 to 200,000 3 8 11 9 21 6 58 200,000 to 300,000 1 1 9 9 20 300,000 to 400,000 2 6 8 400,000 to 500,000 5 5 500,000 to 1 million 5 5 More than 1 million 7 7 Total 267 83 36 20 45 46 497
Source: Authors calculation based on Town Directory 2001 and Census 2011
Table 3b: Population share by size of town in 1961 Size 2011 Size 1961 100,000 to 200,000 200,000 to 300,000 300,000 to 400,000 400,000 to 500,000 500,000 to 1 million More than 1 million N.A. 6% 13% 5% 14% 7% 2% Less than 50,000 67% 34% 22% 10% 10% 1% 50,000 to 100,000 25% 41% 42% 25% 12% 6% 100,000 to 200,000 1% 10% 31% 45% 43% 7% 200,000 to 300,000 1% 5% 23% 10% 300,000 to 400,000 5% 10% 400,000 to 500,000 7% 500,000 to 1 million 11% More than 1 million 46%
Of these 460 towns that existed in 196117, there are 43 that have had an annual growth rate over fifty years of 4.7% or more, i.e., an increase in population by ten times over this period. While many of them are in the peripheries of large cities, ten do not belong to this category, viz. Nashik, Bhiwandi and Aurangabad in Maharashtra, Surat and Vapi in Gujarat, Rudrapur in Uttarakhand, Akbarpur in Uttar Pradesh, Saharsa in Bihar Dhanbad in West Bengal and Miryalaguda in Andhra Pradesh. These are some of the possible candidates for a historical study of subaltern urbanisation, as to the factors that drove their growth. For example, while Miryalaguda is a rice town, the growth in Bhiwandi s powerloom sector follows the demise of the large mills in Mumbai. Once the threshold growth rate is reduced to a less ambitious 4% (seven fold growth), and additional 27 towns are added (of these 70, only 10 were class I towns in 1961) and more such towns appear on the list. Thus, while the large metropolises remain of critical importance, there is also considerable growth that is happening outside of such areas. Economic Health of India s Urban Areas
Is this relative dispersal of population growth the result of desperation, a la Nijman (2012) or is there an underlying broadening of the economic base? The employment and unemployment surveys of the National Sample Survey Office (NSSO) from 1993-94 to 2009-10 allows us to begin looking at this picture.
The picture in Table 4 does show a move towards the metros, defined as cities of over a million, during the period 1993-94 to 2009-10, except for construction, where there is also a move towards rural areas. Between 2004-05 and 2009-10, there appears to be a pullback, but it is not clear whether the decline is part of an emerging trend of de-concentration accompanying the increase in growth rates, or whether it is attributable to a differential impact of the post financial crisis growth slowdown on metros, as compared to other urban centres. The shares from the NSS survey on migration in 2007-08 (in italics) are provided as a possible tentative indicator, recognising that the sampling scheme for the survey was different from the employment unemployment surveys and therefore they are not strictly comparable. Regardless of the shift towards metros, in all the sectors, including modern services, metros comprise less than half, and often less than a third of urban employment.
While urban employment is predominant in most non-farm sectors, apart from mining, food manufacturing and other manufacturing, which comprise about 13% of urban employment and construction (which constitutes another 11%), considerable non-farm employment is also in areas classified as rural, reflecting the discussion on measurement of urbanisation. Using a
different data set, Ghani, et. al. (2012) find that organised manufacturing appears to be growing relatively more in rural areas while unorganised manufacturing is growing in urban areas.
Table 4: Employment Shares by sector
Sector Share of Metros in Urban Share of Urban in Total
1993-94 2004-05 2007-08 2009-10 1993-94 2004-05 2007-08 2009-10 Mining 3.0% 8.3% 4.4% 8.4% 35.0% 33.1% 27.5% 26.6% Food Mfg. 10.6% 16.3% 13.7% 12.9% 35.2% 33.8% 38.7% 37.1% Clothing Mfg. 22.9% 33.2% 36.6% 33.8% 52.9% 58.3% 58.4% 61.7% Machinery Mfg. 39.0% 44.5% 48.5% 41.2% 70.2% 74.6% 74.6% 72.5% Other Mfg. 27.6% 35.3% 35.6% 32.8% 48.7% 48.6% 51.5% 52.1% Utilities 18.6% 28.6% 21.2% 17.7% 61.2% 57.7% 63.2% 65.8% Construction 24.4% 25.5% 22.5% 16.9% 43.3% 35.7% 34.6% 29.7% Govt. Services 28.5% 27.2% 29.1% 28.3% 65.5% 68.0% 69.4% 67.6% Traditional services 23.6% 27.9% 30.4% 27.5% 55.6% 54.7% 57.0% 54.6% Modern services 37.4% 45.0% 45.0% 42.5% 68.5% 72.6% 75.2% 76.6% Social services 19.9% 25.4% 23.1% 22.2% 51.5% 53.2% 51.9% 56.1% Household service 34.3% 42.6% 43.1% 46.6% 72.0% 71.1% 69.2% 66.3% Total 22.7% 28.7% 29.7% 27.0% 54% 53% 54% 52%
Source: Authors calculation based on respective NSS rounds
Table 5 Employment Structure of Metros and Other urban areas
1993-94 2004-05 2007-08 2009-10 Metro Other Urban Metro Other Urban Metro Other Urban Metro Other Urban Mining 0.2% 1.7% 0.2% 1.1% 0.1% 0.9% 0.2% 0.9% Manufacturing 27.4% 27.9% 28.2% 24.9% 28.5% 24.3% 27.0% 23.1% Food Mfg. 1.8% 5.1% 1.6% 3.7% 1.3% 3.7% 1.3% 3.5% Clothing Mfg. 9.1% 10.1% 10.5% 9.3% 10.6% 8.5% 10.5% 8.2% Machinery Mfg 5.0% 2.6% 3.9% 2.1% 4.8% 2.4% 4.5% 2.6% Other Mfg. 11.6% 10.1% 12.1% 9.7% 11.8% 9.8% 10.7% 8.8% Utilities 1.2% 1.8% 0.9% 1.0% 0.7% 1.2% 0.7% 1.3% Construction 7.2% 7.5% 7.6% 9.7% 6.7% 10.7% 6.6% 13.0% Govt. Services 13.1% 10.9% 6.3% 7.4% 6.4% 7.2% 6.8% 7.0% Traditional svc 34.3% 36.9% 33.9% 38.6% 36.5% 38.6% 34.9% 36.9% Modern svcs 8.7% 4.8% 12.0% 6.5% 13.1% 7.4% 14.1% 7.7% Social services 5.0% 6.7% 6.3% 8.1% 5.2% 8.0% 6.1% 8.6% Household svc. 3.0% 1.9% 4.6% 2.7% 2.8% 1.7% 3.5% 1.6% Total 100.0% 100.0% 100.0% 100.0% 100.0% 100.0% 100.0% 100.0%
Source: Authors calculation based on respective NSS rounds
This employment structure of urban areas does not appear to justify the kind of pessimism evident in Nijman (2012). While the structure of employment is shifting towards modern services, this is gradual, from 8.7% in 1993-94 to 14.1% in 2009-10 in the metros. Concomitantly, both manufacturing at over a quarter of the workforce (a little less in
non-metros)18 and traditional services at more than a third of the workforce (a bit more in non-metros) have held their ground for the most part. Note that the ubiquitously mentioned household servant comprises less than 5% of the workforce. Combined with an overall annual growth in urban workforce of about 3%, this provides a strong basis for the economic robustness of urban India. The employment structure of non-metros reflects a diversified economic structure with a stable mix of traditional services, manufacturing and construction. Compared to metros, they have more of construction (as can be expected if they are in the process of increasing their built up area) and a little less of some types of manufacturing and modern services, which may benefit from co-location and agglomeration economies, but the share of these activities is by no means insignificant in their economic structure.
Conceptual Framework
All these aspects taken together point to a picture of urbanisation in India that is dispersed and diverse to an important degree. The large cities are important and growing steadily, but in many cases (though not all) their peripheries are growing faster, a phenomenon even in smaller UAs. But 41% of the urban population lives outside the class I towns; and there is growth there too. Indeed the population share of non-Class I towns has risen in the last ten years. Contrary to popular impression, India may be more urbanised than appears from the official figures. A substantial share of national population, upwards of a 10%, lives in dense built up settlements that do not satisfy the Indian definition of urban areas. Clearly there is a need to go beyond metrocentricity, as argued by Bunnell and Maringanti (2010). The Indian smaller town, far from being stagnant, appears to reflect growth and vibrancy. A number of them have grown steadily and they appear to have a diversified economic base. Even the urbanisation outside the administrative framework reflected in the explosive growth of census towns shows a diffused pattern, spread out beyond the metropolitan peripheries. It does indeed appear that an important, extensive and widespread segment of Indian urbanisation can satisfy our definition of subaltern urbanisation, i.e., it is economically vital and independent of the metropolis. In this section we attempt to characterise this subaltern urbanisation.
Non-subaltern Urbanisation
Since we had defined subaltern urbanisation in the negative, it is useful to begin by characterising non-subaltern urbanisation, which is of three kinds, as mentioned earlier, viz. (a) Metropolitan Urbanisation, (b) Administrative Urbanisation and (c) Corporate Urbanisation.
metropolises. In form, this may be similar to suburbanisation and peripheralisation but it may be different in process. In pure suburbanization, population voluntarily leaves the city core and moves to the periphery and peripheralisation has a certain exclusionary aspect to it, where in people are either pushed out involuntarily (different from suburbanisation) or prevented from entering the city (through market or non-market factors). This growth of the periphery may be a choice, driven by the diseconomies of the core city and its regulatory structure (some commonality with peripheralisation) and the possibility to access the required city services from the periphery. These services are not just urban services like water and sanitation, but the broader set of socio-economic services that a city provides, in terms of access to product markets and infrastructure, deep labour markets, social heterogeneity, etc. A special case of metropolitan urbanisation is capital urbanisation, where the city is also the state capital. As seen earlier, the location of the state capital is a factor in population growth in many states.
The reason for excluding them from the subaltern category lies in the presumed dependence of this growth on the metropolis. There may however be instances of Type II error, i.e., false negatives, which we discuss below, where the location may be peripheral to a metropolis, but the process of urbanisation may be independent of it, i.e., it may be subaltern in character.
Administrative Urbanisation: This refers to the creation of cities like Chandigarh, Bhubaneswar,
Faridabad, Gandhinagar, etc. Such planning of new towns is no longer common, though there are some initiatives like the building of New Raipur that can be compared to the development of cities like Gandhinagar. However, the recent initiatives to develop cities along the proposed Delhi Mumbai industrial corridor can be the beginning of a new wave of new town development but it is debatable whether it should be seen as administrative or corporate urbanisation.
Corporate Urbanisation: The most frequently mentioned example of corporate urbanisation is
perhaps Jamshedpur, with a notified area of 59 sq. km. These refer to settlements where the corporate (private or public sector) sector is involved in development, often as part of a concomitant industrial activity. Large SEZs like the Mundra in Gujarat, which plan to develop over 100 sq. km. or Sri City in Andhra Pradesh are more recent correlates, a key differentiator being that these sites are not linked to a single large industry owned by the firm (though in the case of Mundra, the port can be said to perform a similar function). Of late, especially in Maharashtra, there have been developments like Lavasa, focused on urbanisation, where the city itself is positioned as the attractor of economic activity. Where the corporate is state-owned, like the Bhilai and Bokaro steel plants or Kolar Gold Fields (Robertsonpet in Karnataka) or power plants like Singrauli and Ramagundam, the administrative and corporate features may
meld into one another. The governance of these settlements as an industrial township is usually outside the electoral framework, as permitted in the proviso to article 243Q of the constitution. Subaltern Urbanisation
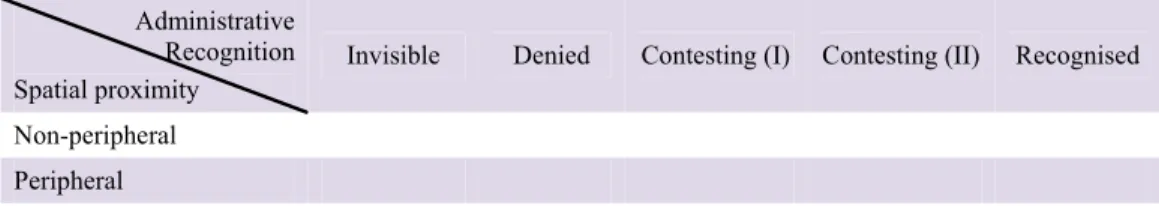
We denote urbanisation beyond the above three types as subaltern urbanisation in that they are not (a) dependent on large traditionally (economically) important settlements or (b) planned cities. Based on the observed pattern of urbanisation discussed earlier, we try to characterise it on two axes, viz. spatial proximity and administrative recognition. On the spatial proximity axis, we consider two types, viz. (i) peripheral where the settlement is located in the periphery to the metropolis and (ii) non-peripheral, which are all other settlements. On the administrative recognition axis, we posit the following four types, viz. (a) invisible, where the settlement is not recognised as urban, as in many cases of settlement agglomeration discussed in Denis and Marius-Gnanou (2011); (b) denied, where the settlements meets the urban test of the census and is classified as a census town, but is not recognised administratively as an urban area; (c) recognised, where the settlement is recognised as an urban area, i.e., it is a statutory town and finally (d) contested, where the settlement is contesting its administrative status. The last can be of two sub-types; first, where the administrative classification is rural but the settlement wants to be recognised as urban and second, where the settlement wants to be rural but the administrative classification is urban. Conceptually, on the administrative recognition axis, it can be thought of as between denied and recognised. These characteristics are discussed in more detail below. Since the spatial proximity and administrative recognition axes are independent, this gives rise to multiple types of settlements. For subalternity, a common character for all these types is independence from the metropolis and a degree of autonomy. It is also possible that subaltern settlements may have a mix of autonomous and dependent (on a metropolis) urbanisation processes, varying over time. Furthermore, autonomy does not imply the absence of a linkage between two settlements.
Table 6: A Classification Scheme for Subaltern Urbanisation Administrative
Recognition Spatial proximity
Invisible Denied Contesting (I) Contesting (II) Recognised
Non-peripheral
Peripheral
Note: Contesting (I) refers to a situation where the settlement wants to be urban but the administrative classification is rural, while the reverse situation is Contesting (II)
1. Peripheral settlements: Even when urbanisation occurs at the periphery of large cities, it is not necessarily dependent on the city. While observationally, the spatial pattern is similar to that expected under the agglomeration hypothesis advanced under new economic geography, the underlying processes may be different and more autonomous in character, thereby justifying classification as subaltern in our schema. It is not our contention that all peripheral urbanisation is subaltern in character; just that subaltern urbanisation processes may exist even in close spatial proximity to metropolises.
Consider the settlement of Gurgaon, at the periphery of Delhi. The population of Gurgaon district has grown by 5.7% per year over 2001-11, compared to the growth rate of Delhi of 1.9%. The municipality of Gurgaon itself has grown by 15.9% per year, though some of this growth is due to the substantial expansion of its boundaries. Although it is located at the border of Delhi, is Gurgaon s growth necessarily dependent on Delhi?
It is hard to reject the hypothesis that the initial growth of Gurgaon may have been dependent on Delhi and on the investment in the Maruti automobile manufacturing facility by the state. Furthermore, even the initial private investment by developers such as DLF can be seen as positioning Gurgaon as a suburb of Delhi, a settlement similar to DLF s earlier developments in Greater Kailash and Hauz Khas, currently neighbourhoods within Delhi. DLF foray into Gurgaon was arguably due to regulatory restrictions on private developers, imposed consequent to the formation of Delhi Development Authority (DDA).
Today, however, Gurgaon s growth is driven by a mix of diverse activities. The modern services sector, located mostly to the north of the National Highway no. 8 and the associated urbanisation is a creature of (benign?) neglect by the state and local entrepreneurship. Much of the educated labour that powers this sector is drawn from the deep labour pool of Delhi. Growth has also been facilitated by the state-led development of a highway connecting Mumbai to Delhi, which runs through Gurgaon and the expansion of Delhi Airport for the Commonwealth Games. To the south of the highway is the manufacturing section of Gurgaon, anchored by the Maruti factory (now majority owned by Suzuki), but in many ways much more diverse in scope than just automobile and auto ancillaries, and powered by numerous small and medium enterprises in various sectors. For this sector, the relationship with Delhi s labour pool is much weaker. Gurgaon is now expanding, incorporating the industrial township of Manesar, 20km along the Mumbai highway. So, it is eminently possible that certain segments of Gurgaon s urbanisation processes may be autonomous and independent of Delhi. In part, this will depend on whether the investments in transportation
infrastructure are viewed as spatially directed and how the labour linkages are seen. We provide this example to show that (a) the extent to which a settlement undergoes a subaltern urbanisation process may change over time and (b) all growth in the metropolitan periphery need not be dependent on the metropolis.
2. Non-peripheral settlements: These are towns located outside the periphery of large towns. We recognise that growth in a non-peripheral location is not a sufficient condition for subaltern urbanisation. For example, growth may be driven by consumption of remittances from a distant metropolis. An autonomous growth engine is needed. The power of this engine may vary, e.g., it is likely to be strong in the towns that have shown ten-fold growth over fifty years, e.g. Mirayalguda, Bhiwandi and Aurangabad. There will also be others which serve their region effectively, but without demonstrating the rapid growth seen in these towns. Harda and Gobindgarh are two possible examples of such towns.
Harda, located in the eponymous district of Harda (carved out of Hoshangabad in 1998) in Madhya Pradesh, for example, was established as a Nagarpalika by the British in May 1867. It is today a district headquarter town with rail links to Delhi and Mumbai, located on a national highway (NH 59-A connecting Indore and Betul), but the town has remained relatively small, with a population of 14,015 households in 2011, an increase of 1.8% since 2011. Nevertheless, it appears to be an important mandi town, a dynamic marketplace, constantly interacting with the changing contexts of agricultural production, regional political dynamics, technological developments, processes of reform, and the penetration and contraction of different forms of agro-commercial capital .19 It has emerged as a centre of commercial activities for wholesale and retail in garment, grocery, hardware, auto-parts, medicine, jewelry (sic), etc. [for] people from surrounding areas (around 18 villages) and even from cities like Timarni, Seoni-Malwa .20
Gobindgarh is a town in Fatehgarh Sahib district of Punjab. Kundu and Bhatia (2002) examined how it became a hub of steel rolling and linked industries, despite not having any perceptible locational advantage being the node of raw material supply etc. (p. 50). Their explanation draws upon the history of entrepreneurship, fostered by proximity to Patiala, a well-developed network of middlemen and cost effective informal financing arrangements and risk sharing practices even in the labour market. Despite this nodal position, however, the population of Gobindgarh (17628 households in 2011, an increase of 3.9% over 2001) remains relatively small, though it has grown much faster (5.5% annually over 1961-2001)
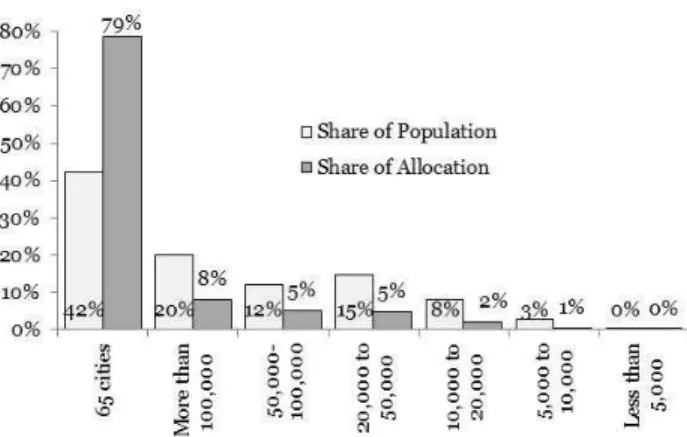
The processes that sustain growth in such cities have been insufficiently explored. Small towns, which were earlier a locus of inquiry, e.g., Mathur (1982), now receive relatively little attention from academia.21 Indeed, small towns are arguably neglected even by the government. The clearest enunciation of this at the aggregate level is perhaps to be seen in the allocations of the Jawaharlal Nehru National Urban Renewal Mission (JNNURM), the flagship national urban program. The program has four components, the UIG (Urban Infrastructure and Governance) and BSUP (Basic Services for the Urban Poor) for sixty three (now sixty five) specified cities, and then the UIDSSMT (Urban Infrastructure Development Scheme for Small and Medium Towns) and IHSDP (Integrated Housing and Slum Development Programme) programs for the other urban areas. Figure 2 shows the share of allocation compared to the share of population in these different categories. Thus, while the sixty five cities have 42% of the population, they have received 79% of the allocations, while Class III cities (population between 20,000 to 50,000) have received only 5% of the allocations, even though they have 15% of the population. Furthermore, of the 1387 class III cities, only 277 have received funds under UIDSSMT and 194 under IHSDP, leaving out a large majority. The manner in which the people on their own cope with this neglect by the elite is yet to be studied.
Figure 2: Share of JNNURM Allocations by size class of cities
Note: These include allocations for UIG, BSUP, UIDSSMT and IHSDP. Based on data from
Ministry of Urban Development and Ministry of Housing and Poverty Alleviation.
3. Invisible settlements: Moving to the axis of administrative recognition, invisible settlements are those that are not seen as urban either by the administrative authorities or by the Census. They are neither statutory nor census towns and are classified as villages. Denis and Marius-Gnanou (2011) indicate the possibility of urban-like growth in such settlements beyond
recognized areas of urbanisation. As noted earlier, over 10% of national population may reside in such large dense built-up settlements. An examination of the work profile of such villages in Bihar also shows that the proportion of male non-farm workers exceeds 50% in only a few (little over 10%) of them and is more than 75% (the census standard) in a negligible number. The question here is whether the census standard is a reasonable measure of urban characteristics . As noted earlier, only five other countries use such criteria in defining urban settlements. Gupta (2010) in her work on villages around Bhopal finds that much smaller settlements like Harra Kheda fulfil the role of an urban area, in terms of being a focal point for service provision and could possibly have been recognized as a town in 1951 as a place with a smaller population [than 5,000] with definite urban character .22 While satellite imagery has indicated the possible existence of dense settlements outside recognised urban areas, their growth processes remain to be studied. 4. Denied settlements: The next step along the administrative recognition axis is one where the
settlement satisfies the three-fold criteria used by the census but does not receive statutory recognition. The number of such Census Towns increased by 2532 over 2001-11. The number of census towns in Kerala rose by 362 and that in West Bengal by 528, while Tamil Nadu (265) and Uttar Pradesh (201) were the other main contributory states. These four states accounted for more than half the increase in the number of census towns. On occasion, these settlements can be quite large. Of the 38 large CTs (more than 50,000 in population) in 2001, 17 were in Delhi, and 15 in Jharkhand, West Bengal and Andhra Pradesh and the remaining in other states.
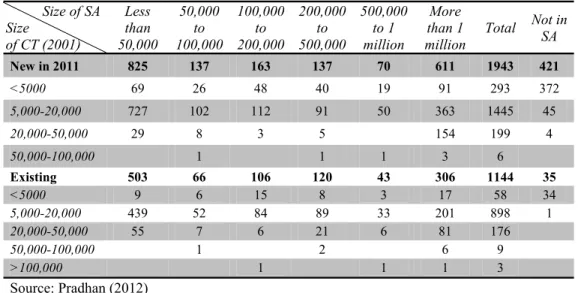
It is also interesting to explore the interaction of invisibility and denial. Table 7 shows this intersection by size of SA and CT. A large number (1943) of the new census towns recognized in 2011 belong to one of the settlement agglomerations constructed on the basis of 2001 populations, with 825 of them being part of settlement agglomerations that are less than 50,000 in population.23 This leads to the interesting conjecture as to whether density in itself may bring about urban character in terms of non-farm work and whether this methodology can be adopted as a predictive tool to investigate the spatial direction of urbanisation. Whether or not there are distinct spatial characters in these new CTs vis-à-vis the other settlements in the SA, e.g., proximity to transport networks remains to be studied. All census towns, however, may not be denied settlements. Some of them may have successfully contested classification as a statutory town, opting to remain a village. It is
number of census towns, should also be those with arguably the most empowered panchayats. It is possible that given the limited devolution of powers to the urban local bodies and the relatively large number of schemes focused on rural areas, it is more advantageous for a settlement to remain rural at least in those states where there is a certain finality of transition. In this context, it is important to note that case law on the subject in Kerala indicates that there cannot be a transition of an urban area as a rural area .24
Table 7: The Interaction of Invisibility and Denial in Select States Size of SA Size of CT (2001) Less than 50,000 50,000 to 100,000 100,000 to 200,000 200,000 to 500,000 500,000 to 1 million More than 1 million Total Not in SA New in 2011 825 137 163 137 70 611 1943 421 <5000 69 26 48 40 19 91 293 372 5,000-20,000 727 102 112 91 50 363 1445 45 20,000-50,000 29 8 3 5 154 199 4 50,000-100,000 1 1 1 3 6 Existing 503 66 106 120 43 306 1144 35 <5000 9 6 15 8 3 17 58 34 5,000-20,000 439 52 84 89 33 201 898 1 20,000-50,000 55 7 6 21 6 81 176 50,000-100,000 1 2 6 9 >100,000 1 1 1 3 Source: Pradhan (2012)
5. Contesting settlements (I): Settlements unhappy with their current classification, as noted earlier, are of two types. The first are settlements currently administratively classified as villages (which may include census towns) that want to become urban. Such instances can be observed in Tamil Nadu, where settlements, unlike in neighbouring Kerala, change from urban to rural and back to urban at the pleasure of the state government. On 11 June 2004, the Government of Tamil Nadu directed the reclassification of 566 town panchayats as village panchayats .25 Prior to this, according to section 3-B of the Tamil Nadu District Municipalities Act,1920, any local area having a population of not less than 5,000 and an annual income of not less than 1 lakh of rupees shall be constituted as a town panchayat. The government however determined that since most of the town panchayats are financially weak, and rural in character, town panchayats having a population of less than 30,000 may be reclassified as village panchayats so as to enable them to receive more funds from the Government of India and State Government under various grants and assistance. (emphasis added). It found that 93% of town panchayats (568 of 611) had a population of less than
30,000. Of these 568, 183 agreed to revert back to being village panchayats but 385 refused, stating that (i) the present set up of administration is essential to attend to the public needs and (ii) revenues from tax and other sources may decline. However, since the Director of Town Panchayats reported that the characteristics of the town panchayats which have opposed the reclassification are identical to the characteristics of the town panchayats which have agreed to the reclassification (emphasis added), it was decided that all these town panchayats would be reclassified as village panchayats barring two settlements that had initiated legal proceedings, viz., Narasingapuram in Salem district and Punjai Puliyampatti in Erode district. Thus, 385 settlements became instances of contesting settlements of the first type, villages contesting their classification and wanting to be towns.
6. Contesting settlements (II): The ruling party changed in Tamil Nadu following assembly elections in May 2006. Soon after, on 14 July 2006, orders were issued to reconstitute 561 village panchayats in question as town panchayats.26 In this case, 28 settlements passed resolutions stating that they wanted to remain classified as villages, but were nevertheless reconstituted as town panchayats, providing instances of second type of contestation, where settlements are classified as urban areas, though they want to be classified as villages. Another, better publicised, instance of the second type is the expansion of the Vasai Virar municipal corporation, near Mumbai, on 3 July 2009. A number of villages incorporated into the municipal corporation resisted joining it.27 Following this contestation, the state government of Maharashtra issued another notification on 31 May 2011 deleting 29 villages from the municipal corporation and adding two villages to its area. In its turn, the newly formed Vasai Virar municipal corporation challenged this notification in the Bombay High Court. Hearings are continuing, with the deletion of villages held in abeyance, i.e., the 29 settlements remain classified as urban areas, though they want to be classified as villages. These examples demonstrate that autonomy is not only related to the growth process; it is equally important in the field of classification. These 561 settlements in Tamil Nadu and 29 settlements in Maharashtra are currently classified as urban, though they may have just as easily been rural and in that case, unless they satisfied the test of being a census town, their populations would have been counted as rural. The politics of urban classification remains an open area for research.
7. Recognised Settlements: Recognised settlements are the final step on the administrative recognition axis. These settlements may however, not satisfy the three-fold criteria of the
classify a settlement as a statutory town. The non-peripheral towns of Harda and Gobindgarh described briefly earlier would be instances of such settlements.
Process of Transformation
In the 1980s, the role of small towns in the development process, the diffusion of urbanisation and their relationship with rural areas was the topic of important debates. Rondinelli (1983) emphasised the importance of the functional role played by small urban centres in creating rural-urban linkages and contributing to an integrated and balanced network of places, a theme that Tacoli (2006) explores recently. The search was for balanced regional development in which small towns play the role of a transmission mechanism to the rural areas. Rondinelli found that: Towns in India frequently contain a wide array of small retail stores, personal and commercial services, and small cottage-processing, fabricating or simple manufacturing operations... The economic activities found most frequently in Indian towns are weight-and bulk-reducing processing operations such as sugar mills, sawmills, abattoirs, canneries, and oil-crushing mills. These localized activities in turn create demand for transportation and supply services as well as for storage, financial and insurance services (p. 386). While many such towns remain, others have become much more complex.
For two decades, the considerable body of research on global cities, global-city regions and large metropolis, hid a large share of the urban population from view but it is now necessary as Bell and Jayne (2009) state, to understand more fully the ways in which small cities attempt to develop competitive advantage in the global urban hierarchy, the ways in which small cities link with other cities (and non-urban places) and the forms that these linkages take. (p. 689). Urban centres are part of city-systems, which implies a need to look beyond rural-urban linkages and understand their dynamics as urban centres per se, their linkages with other cities, including international global cities. Our central hypothesis is that important forces of transformation are to be found in the agency of the actors located in these settlements, which goes beyond their role as a transmission mechanism for trickle-down growth. The rapid changes of the last two decades in India call for such an endeavour if one considers that there is more to urban transformation than agglomeration economies and trickle-down effects.
The core question of interest is the process of subaltern urbanisation and the manner in which it differs, if at all, from the processes seen in metropolises, e.g., agglomeration driven economies posited by theories of new economic geography. It is important to emphasise that it is not a question of absence or presence of globalisation. Subaltern urbanisation includes settlements that may be connected not just locally and nationally, but also globally. The leather clusters of
Ranipettai in Tamil Nadu or the knitwear driven growth in Tiruppur are possible instances of global connections in non peripheral locations. The process of transformation in these settlements and the manner in which it relates to the characteristics, i.e., whether the processes are affected by spatial location and administrative recognition, is a matter of ongoing research. Broadly, the drivers of this transformation, possibly intermingled and with feedback loops, can be grouped into three factors, viz. economic, social and political.
Economic
Various explanations could be related to the location and/or the relocation of economic activity in smaller urban centres or large villages. As noted earlier, Ghani, et. al. (2012) find that organised manufacturing appears to be growing relatively more in rural areas while unorganised manufacturing is growing in urban areas. An explanation could be related to the improvement in connectivity offsetting the higher land cost in larger cities as well as exemption of taxes in rural areas. These factors can trigger economic activities both in peripheries of large cities (such as part of the automobile sector in the periphery of Delhi) or in non peripheral areas. The examples of Harda and Gobindgarh and the clusters of Salem and Vellore point more towards agglomeration at a lower scale, with substantial exploitation of socio-cultural networks. For example, the cluster of Vellore includes the towns of Ranipettai, Melvisharam and Vaniyambadi. Ranipettai is a relatively small town of 11,659 households in 2011, but it is host not just to a large export-oriented leather cluster of small firms but also a fabrication industry (including a facility of Arcelor Mittal Dhamm) and among the earliest sanitary ware plants (part of the Parryware brand) in India. This raises a range of possible questions regarding the relationship between the small externally focused leather entrepreneurs and the large brand name firms and their respective spheres of autonomy and agency and, the manner in which it affects the process of urban development. This example brings about a critical question about the nature of capital and its relationship to the extent of autonomy, whether it is external to the settlement or local, including the result of surplus arising from agriculture28, and the channels through which it flows, e.g. the role of social, possibly caste-based, networks.
Social
A range of social changes may be occurring across small urban centres with possible variations across States. For instance, Krishnamurthy (2011) documents a process of moving to the town to avail education and health facilities, even as the economic drivers stay broadly rural. In Dharuhera, one of the sites studied by one of the authors, preliminary field work points towards
better infrastructure facilities, single male migrants remain in peripheral villages. Indeed, the increasing demand for quality education is perhaps underestimated as a reason for relocation, but this is just speculative conjecture at this time. There may also be other, possibly less mundane and more momentous social changes along the axes of caste and class that may be occurring as a result of market forces.29 Jeffery et al., (2011) describe some of these changes in small towns in UP, where they observe changing aspirations and lifestyles that impact education, housing and reproductive strategies. Of special interest is the manner in which social factors affect the preference structures and constraint sets, i.e., the degree of autonomy and capabilities, e.g., the interaction of social networks with capital accumulation and knowledge and access to markets beyond the settlement.
Political
The political changes that occur in a settlement with the change in its economic and social character are relatively poorly understood. It is also possible that political factors play a role in the process of transformation by conferring a heightened sense of agency on certain segments of the settlement s population. As seen above, political factors also play a role in classifying a settlement as rural or urban and the processes of contestation that emerge from such a classification. Typically, the nature of urban governance and the manner of implementation of the 73rd and 74th constitutional amendments have led to a situation in most states where urban local bodies are relatively more restricted than rural local bodies in terms of their autonomy, due to the influence of state development agencies and regulatory bodies. In addition to the higher number of the Union government schemes for panchayats, Bhagat (2005) mentions lower taxation, cheaper power and the absence of urban by-laws and regulations as incentives to remain rural. In contrast, once a settlement crosses a certain size, the provision of networked services, for which financial assistance can typically be accessed only by urban local bodies can access, may be seen as necessary. This can set up interesting optimisation exercises, e.g., between the freedom to develop land, which is more in rural areas and the level of public services and consequent value of developed land, which is more in urban areas. This balance will vary from one settlement to another with variations across states and will mobilize different actors and interests. Many villages oppose the move to become urban to preserve their lifestyles and arguably to avoid the type of land speculation prevalent especially in the periphery of metropolises. Other reasons for this resistance can be found in divergent political affiliations, a factor unexplored but potentially explaining resistance of some villages to being incorporated in larger towns. There may also be interactions with social factors, e.g., Sengupta (2012) finds that resistance by some villages to be included in the Malegaon Municipal Corporation is due to
religious reasons. While the city of Malegaon is largely populated by the Muslims, these villages are predominantly Hindu.30
The politics of classification we have just discussed implicitly takes for granted that boundaries are fixed. However, this is not always the case. Examples of settlement agglomerations where one part of the settlement is classified as rural and another part as urban complicates the issue further. Two examples from preliminary field work in Uttar Pradesh illustrate the potential stakes involved. In the small town of Daurala31, an urban local body, a large tract of land is occupied by an industrial unit, which is declared as rural, thereby avoiding civic taxes. Consequently, there is a push by the urban local body to incorporate this area into the settlement in order to be able to levy taxes on the unit. In the case of the larger town of Sikandarabad,32 the separation between the town and the village is only visible because of a water leakage on the road, which reflects the difference in the infrastructure standards. However, the most recent and rapid rural outgrowth of Sikandarabad is reportedly orchestrated by the village pradhan, who owns houses given on rent, a cinema and a marriage hall. To avoid taxes and maintain political power in this area, he has built a coalition of interests that resist its inclusion into the town. Field Studies
Field observation is therefore essential to understand the role of these various factors and their interrelationships in the study of subaltern urbanisation. The use of large data sets, while important, is limited in understanding the processes that are leading to the transformation of these settlements. It is necessary to be in the field and to conduct in-depth empirical research to distinguish between various forms of urbanisation and the extent and nature of autonomy in settlements, all too difficult to infer from available census and survey data. Krishnamurthy s (2012) observation that agricultural markets are not easily analyzed from afar or powerfully illuminated from available statistical data [and] understanding how these disparate and dynamic markets operate therefore requires close engagement within particular regions, regulatory regimes, and market sites 33 is of relevance to the study of subaltern urbanisation, which requires a fine reading of local actors agency in driving changes. To assess the level of autonomy of settlement agglomerations (whether peripheral or non peripheral), one needs to, inter alia, look carefully at the type and structure of capital and investments in these settlements, including for instance the manner in which land is mobilized and agricultural surplus is used, study the structure of labour markets and the role of local actors in influencing or resisting policies. In each of the categories we have defined, however, the specific processes that make the settlement as well the stakes around the governance question need to be uncovered. For