HAL Id: halshs-00684315
https://halshs.archives-ouvertes.fr/halshs-00684315
Submitted on 1 Apr 2012
HAL is a multi-disciplinary open access
archive for the deposit and dissemination of
sci-entific research documents, whether they are
pub-lished or not. The documents may come from
teaching and research institutions in France or
abroad, or from public or private research centers.
L’archive ouverte pluridisciplinaire HAL, est
destinée au dépôt et à la diffusion de documents
scientifiques de niveau recherche, publiés ou non,
émanant des établissements d’enseignement et de
recherche français ou étrangers, des laboratoires
publics ou privés.
per Capita
Somlanaré Romuald Kinda
To cite this version:
Somlanaré Romuald Kinda. Education, Convergence and Carbon Dioxide Growth per Capita. African
Journal of Science, Technology, Innovation and Development, National Inquiry Services Centre (NISC),
2011, Volume 3 (Number 1), pp.65-85. �halshs-00684315�
65
Education, Convergence and Carbon Dioxide
Growth per Capita
Kinda Somlanare Romuald
Abstract
This paper examines the existence of convergence and the importance of education on carbon dioxide growth per capita, over the period 1970-2004 for 85 countries. We use panel data and apply GMM-S ystem estimation. This rigorous approach takes into account the observed and unobserved heterogeneity of countries, and solves the e ndogeneity problems associated with some variables. Our results suggest a divergence in per capita carbon dioxide emissions around the world, and that education is not a factor in carbon dioxide emissions growth. Contrary to commonly held beliefs based on intuition, we provide evidence that, in developing countries, there is no convergence, and that education is not a factor in carbon dioxide growth. In developed countries, we find a convergence for per capita carbon dioxide emissions. Education was found to be a factor in pollution growth, although its effect is mitigated by the presence of political institutions.
Keywords: Conve rge nce in carbon dioxide ; Education; Syste m GMM JEL Classification: H52, H75, I20.
Centre d’Etude et de Recherche sur le Développement International (CERDI-CNRS ), Université d'Auvergne, Clermont Ferrand, France. Tel: 00133473177438. Email address : [email protected]; S [email protected]
African Journal of Science, Technology, Innovation and Development
Vol. 3, No. 1, 2011 pp. 65-85
66
1. Introduction
In re ce nt ye ars, the climate change de bate has re ce ive d re ne we d atte ntion, be cause climate change associated e nvironmental and socio -economic e ffe cts are more e vide nt now than e ven be fore. In response, some agre e me nts, such as the Kyoto Protocol, we re signe d be twe e n countrie s. The se agre e me nts e stablish fle xible me chanisms and confirm the commitme nt of countrie s to stabilise or re duce gre e nhouse gas (GHG) e missions ove r the pe riod 2008-2012. Howe ve r, the se commitments do not include de ve loping countrie s, such as China or India. De spite this we akne ss, the Kyoto Protocol re mains one of the best instrume nts of e conomic policy against pollution at an inte rnational le ve l, and should be improve d to inte grate de ve loping countrie s. Among many options for including the se countrie s, scientists promote the approach of Contraction and Convergence. This me thod involve s a substantial re duction in carbon dioxide e missions (contraction) and gradual e qualisation of pe r capita carbon dioxide e missions across countrie s (conve rge nce ). The aim of this approach is to allocate commitme nts to countrie s, to re duce air pollution from gre e nhouse gase s. Countrie s can set sustainable e missions budge ts, and share this budge t on a pe r capita basis. This scenario is diffe re nt from the current protocol, whe re e missions rights are proportional to historical le ve ls. Emissions conve rge nce can facilitate the participation of de ve loping countrie s in pollution re duction, through adoption of an allocation scheme based on pollution pe r capita, without involving a substantial transfe r of financial re source s from de ve lope d countrie s to de ve loping countrie s. Thus, the analysis of the conve rge nce of air pollution is important in te rms of inte rnational political policie s.
This pape r aims to de te rmine the importance of e ducatio n on air pollution growth, and the e xiste nce of convergence. First, based on the available e mpirical lite rature on air pollution conve rgence, we analysed the e xistence of convergence in pe r capita carbon dioxide e missions over the pe riod 1970-2004 in 85 de ve loping and de ve lope d countries. Othe r authors have analyse d the conve rge nce in pe r capita carbon dioxide e missions. For e xample , Strazicich and List (2003) found a be ta conve rge nce in carbon dioxide e missions in a sample of 21 industrialise d countrie s ove r the pe riod 1960-1997. The y e xplain the se re sults by the fact that the se countrie s are on the downward sloping of e nvironme ntal Kuzne ts curve s, and that the ir income s pe r capita are lowe r than incomes pe r capita at the ste ady state . Thus, pollution re duction would be lowe r at the transitional stage than after a ste ady state has been achieved. Nguye n (2005) e xamined convergence in carbon dioxide e missions for 100 countrie s from 1966 to 1996, and conclude d that the e nvironme ntal convergence hypothesis is a case of the glass e ithe r be ing half-full or half-e mpty. More pre cise ly, countrie s with high initial CO2 pe r capita e missions (re latively to sample averages) expe rie nced a de crease in the ir re lative e missions, whe reas the re lative e missions of low e missions countrie s re maine d unchange d during the study pe riod. Ste gman (2005) provide s we ak e vide nce for conve rgence in e missions pe r capita for a se t of 97 countrie s from 1950-1999; and ide ntifie d we ak conve rge nce in countrie s with ve ry high rate s of e missions pe r
67
capita. Brock and Taylor (2010) e xamine d e mpirical e vidence for the e xiste nce of conve rgence in carbon dioxide e missions pe r capita for 22 OECD countrie s from 1960-1998. Base d on the ir re se arch, the y de ve lope d the gre e n Solow mode l, by introducing te chnical progre ss in the de pollution activitie s se ctor in the traditional Solow mode l. This mode l ge ne rate s a Kuzne ts e nvironme ntal curve , with a balance d growth path of income pe r capita. Empirically, the y found an absence of absolute conve rge nce in e missions pe r capita for 139 countrie s, and conditional conve rge nce for OECD countrie s.
Se cond, we analyse the role of e ducation in air pollution growth. Contrary to e xisting lite rature on e conomic growth, the e nvironme ntal e conomics lite rature has not e xplicitly inve stigated the role of e ducation in air pollution growth. Since the Rio Summit (1992), education is has been conside red to be an e ssential tool for both e nvironme ntal protection and sustainable de velopment. It is commonly he ld that e ducate d pe ople are more conscious of e nvironme ntal proble ms, and the re fore would make be havioural and life style change s in favour of improving the e nvironment. In addition, e ducation is considered to be a driving force behind e conomic growth, and e ducation foste rs e nvironme ntal prote ction.
Our re sults sugge st a dive rge nce in pe r capita carbon dioxide e mis sions worldwide . In de ve loping countrie s, we did not find conve rge nce in pe r capita carbon dioxide e missions and the e ngine of e missions growth re duction is te chnical progress. But we did find conve rgence in carbon dioxide e missions pe r capita in de ve lope d countrie s, whe re incre ase d e ducation was associate d with incre ase d air pollution growth. Howe ve r, political institutions appe ar to be dampe ning this ne gative e ffe ct of e ducation on air pollution growth.
The re mainde r of the paper is organize d as follows. In Se ction 2, we addre ss how e ducation can influe nce e nvironme ntal quality. In Se ction 3, an e stimating e quation is de rive d and re sults are shown, while in the last se ction, brie f conclusions are pre se nte d along with policy re comme ndations.
2. Literature Review
Diffe re nt approaches drawn from the lite rature on e conomic growth have be e n use d to study conve rge nce in air pollution. In this se ction, we pre se nt the se me thods and survey the e mpirical lite rature related to air pollution conve rge n ce .
Convergence in air pollution emissions
The conce pt of convergence in air pollution can be e xplored by e mploying several approaches adapted from the lite rature on e conomic growth. The first approach is sigma (σ) conve rgence. According to Sala-i-Martin (1990), sigma convergence is de fine d as the re duction in the spre ad or dispe rsion of air pollution e missions ove r time : usually me asure d using coe fficie nt variation (cv) or standard de viation. The se cond approach is beta-convergence. Βeta conve rge nce re fe rs to the e xiste nce of a ne gative re lationship be twe e n the growth rate of air pollution
68
pe r capita and the initial le ve l of pollution pe r capita. Be ta conve rge nce occurs whe n countrie s with high initial le ve ls of pe r capita CO2 e missions have lowe r e mission growth rates than countries with lowe r initial pe r capita CO2 e missions. In addition, the re is convergence whe n cross country diffe re nce s in air pollution are de clining. The third approach, the dynamic distributional approach to conve rge nce analysis propose d by Quah (1995a, 1995b, 1996, 1997, 2000), e xamine s the distribution dynamics of air pollution e missions. According to Quah, e stimation of be ta conve rge nce using the me thod of cross se ctional re gre ssion analysis yie lds ‚only ave rage be havior‛, and doe s not produce re le vant information on distribution dynamics, be cause it only capture s re pre se ntative e conomic dynamics. The dynamic distributional approach to conve rgence enables analysis and comparison of the distribution of a variable of inte re st at diffe rent dates. Finally, the last approach, stochastic conve rge nce , is based on univariate time -se rie s analysis, and was inspire d by Carlino and Mills (1996). This me thod e mploys unit root spe cifications with a constant, and with or without a line ar tre nd, for te sting if shocks in air pollution pe r capita re lative to the ave rage for a country are te mporary or te nd to vanish ove r time . In othe r words, the time se rie s approach to conve rge nce analysis is base d on the assumption that forecasts of variable diffe rences converge to ze ro as the fore cast horizon be come s arbitrarily long. If the diffe re nce s be twe e n the countrie s’ variable le vels contain e ither a non-zero mean or a unit root, the n the convergence condition is violate d (Be rnard and Durlauf, 1995, 1996).
Education and environmental quality
In this se ction, we e xamine and e xplore the ore tical argume nts conce rning the re lationship be twe e n e ducation and e nvironme ntal quality. In particular, two groups of article s are discusse d.
The first group de als with the civic e xte rnalitie s of e ducation. Ne lson and Phe lps (1966) conside r that e ducation e nhance s one ’s ability to re ce ive , de code , and unde rstand information; and that both information proce ssing and inte rpre tation impact le arning and be havioural change. In recent ye ars, education has be en proposed as a ve hicle for sustainable de ve lopme nt, and by e xte nsion, the fight against pollution. Education is a pe rmane nt le arning proce ss that contribute s to the training of citize ns whose goal is the acquisition of knowle dge , soft skills, know-how and good manne rs. It e nable s the m to ge t involve d in individual and colle ctive actions, based on the principle s of inte rde pendence and solidarity. This will he lp coordinate pe rson-socie ty-e nvironme nt re lationships and support the e me rgence of sustainable socie tie s that are socio -politically and e conomically fair, he re and e lse whe re , now and for future ge ne rations.
According to Farzin and Bond (2006), the pre dicte d positive e ffe cts of e ducation on e nvironme ntal quality can be channe lle d in thre e ways. First, e ducated pe ople are e xpected to be more conscious of e nvironme ntal proble ms, and the re fore would display be haviours and life style s in favour of e nvironmental improve me nt. In addition, e ducate d pe ople have be tte r acce ss to information
69
about e nvironmental damage, and may consequently change the ir be haviour. In support of this, Bimonte (2002) has shown that incre ase d e ducation is ofte n accompanie d by highe r le ve ls of e nvironme ntal prote ction.
Se cond, e ducate d pe ople have a highe r capacity or ability to use e xisting me ans and channels to e xpre ss the ir e nvironme ntal pre fe re nce s. For e xample , the y can organize into pre ssure groups or lobbie s, to push for and achie ve imple me ntation of e nvironme ntal public policie s. Dasgupta and Whe e le r (1997) analysed factors e ncouraging pe ople to complain about e nvironmental damage in China. The y found that Chine se province s with re lative ly low e ducation le ve ls displaye d a lowe r marginal prope nsity to complain about e nvironmental damage. Without e ducation, pe ople have little information about the harmful risks or the long-te rm e ffects of e nvironme ntal damage , and are only aware of the obvious impact. Furthe rmore , le ss e ducate d pe ople have little confide nce in the ir own capacity to influe nce authoritie s. In support of this, e mpirical studie s from the World Bank (Whe e le r et al., 1993) have shown that in the abse nce of e ffe ctive gove rnment policie s, communitie s with highe r e ducation le ve ls take favourable actions to control or re duce pollution e missions.
Third, Farzin and Bond (2006) conside r that e ducated pe ople are ‚more like ly to ge ne rate an e nvironme ntally progre ssive civil se rvice , and the re fore have de mocratically-minde d public policymake rs and organizations that are more re ce ptive to public de mands for e nvironme ntal quality‛.
The se cond group focuse s on the e ffe ct of e ducation with re spe ct to labour productivity and income . Spe cifically, according to the Environme ntal Kuzne ts Curve , e nvironme ntal quality is initially re duce d with rising income s and de ve lopme nt. At a give n le ve l, income rise s are the n associate d with improve ments in the e nvironment. This e ffe ct is e xplained by fact that incre ase d income le ve ls ge ne rate the re source s ne ce ssary for pollution abate me nt. In support of this, Jorge nson (2003) found that e ducation has a positive e ffect on the e cological footprint. Howe ve r, e ducate d pe ople have more income and purchasing powe r, and are e ncouraged to ove r-consume material goods. Inde e d, the y appare ntly fulfil a de sire to live we ll by accumulating mate rial goods, without caring about the conse que nce s of this happine ss: inste ad following the ide ological mode l of ‚consume more to be happie r’’ (Prince n et al., 2001) conve yed by advertising and the media, le ading to e ve n gre ate r consumption of mate rial goods. The refore, be cause ove rconsumption of goods is a factor in the ove r-e xploitation of natural re source s, e ducate d pe ople dire ctly contribute to e nvironme ntal de gradation (pollution of air, soil, and wate r). The se e mpiric al re sults re ve al a positive and significant e ffe ct of e nrolme nt in school on the e cological footprint pe r capita.
Se cond, e ducation facilitate s the de ve lopme nt and adoption of ne w te chnologie s that are more productive in a close d e conomy (Barte l and Lichte nbe rg (1987)); and according to We lls (1972), e ducate d pe ople adopt innovation soone r than le ss e ducated pe ople. In fact, marke ting lite rature shows that e arly (consumers) purchase rs of ne w products are more e ducate d. Ne lson
70
and Phe lps (1966, page 70) conclude d that a ‘‘be tte r e ducated farmer is quicke r to adopt profitable ne w proce sses and products since for him, the e xpe cte d payoff from innovation is like ly to be gre ate r and the risk like ly to be smalle r; for he is be tte r able to discriminate be tween promising and unpromising ide as, and he nce le ss like ly to make mistake s. The le ss educated farmer, for whom the information in te chnical journals me ans le ss, is prude nt to de lay the introduction of a ne w te chnique ’’.
Education also stimulate s the cre ation of knowle dge ; re sulting in innovation as a function of re se arch and the disse mination of knowle dge from re se arch ce ntre s and institutions, and promoting ne w ide as. The se institutions can train many e ngine ers and scientists and de velop a re search sector that is favourable to pollution abate me nt. Formal Re se arch and De ve lopme nt (R&D) spe nding is conce ntrated in OECD countrie s, and de veloping countrie s spe nd re lative ly le ss on basic science and innovations. Thus, de ve loping countrie s re ly e ve n more on the inte rnational diffusion of te chnology. Intere stingly, Eaton and Kortum (1999) conclude d that inte rnational te chnology transfe rs are the major source of te chnical progre ss for both de ve lope d and de ve loping countrie s; while Ke lle r (2004) argue s that te chnology comes more often from abroad (90% or more ) than from inside the country. The important que stion re mains: Is human capital also important for inte rnational te chnology adoption and diffusion? Empirical and the ore tical article s suggest that this story has gained support. For e xample , Caselli and Cole man (2001) have shown that inward te chnology diffusion incre ase s with a country’s human capital. Other major de terminants of inte rnational te chnology diffusion are re search and de velopment expenditure s, trade through inte rmediate input imports, le arning-by-exporting e xperience, foreign dire ct inve stme nt (FDI) and communication.
Finally, e ducation can change the structure of e xports, which can be come re lative ly le ss polluting, incre asing the capacity to imple me nt e nvironme ntal policie s. If an e conomy grows initially with the accumulation of polluting physical capital, and late r with the accumulation of non-polluting human capital, the n pollution can appe ar in the shape of a re ve rse d U-curve .
3. Empirical analysis
(a) Econometric specification
The e conometric approach of our pape r is to analyze the role of e ducation on the growth of air pollution and the e xiste nce of conve rge nce . For this purpose , we e stimate the growth of carbon dioxide e missions pe r capita on the le ve l of e ducation and a se t of control variable s. We write the base line mode l as follows: ( ⁄ ) ( ) ( )
71
with
e
i t, the ave rage quantity of carbon dioxide pe r capita (in me tric ton) in a country i in a ye ar t, is e ducation, is the e rror te rm, is time e ffe ct, is country spe cific e ffe ct and is control variable s. The se variable s are inve stme nts, population growth rate , trade ope nne ss, political institutions and te chnical progress. The pe riod ranges from 1970 to 2004 and data are compile d in five -ye ar averages. Our sample is take n from 85 countrie s including 22 de ve loped countrie s and 63 de ve loping countrie s (Se e Appe ndice s).Firstly, we analyse the e xiste nce of air pollution conve rge nce ( ). If it is ne gative and significant we can conclude that countrie s with low carbon dioxide pe r capita e missions catch up countrie s with high carbon dioxide pe r capita e missions. In othe r words, conve rge nce occurs whe n countrie s with high initial le ve l of pe r capita CO2 e missions have lowe r e mission growth rate than countries with low initial le ve l of pe r capita CO2 e missions. Se condly, we e valuate the e ffe ct of e ducation on air pollution growth ).
(b) Estimation method
In orde r to e stimate this mode l we use ade quate e conome tric te chnique s. The pane l data take into account transve rsal and te mporal dime nsions and the unobse rved he teroge ne ity (for e xample influe nce of e conomic spe cificitie s and e nvironme ntal policie s, e tc.). We can run e stimations using OLS (Ordinary Le ast Square ) or Fixe d Effe cts (FE). The se are inade quate be cause the forme r (OLS) doe sn’t take into account unobse rve d he te roge ne ity of countrie s and the latte r (FE) is inade quate for dynamic mode ls. We the n ta ke into account country and time fixe d e ffe cts and use the Syste m GMM (Ge ne ralize d Me thod of Mome nt). The first–diffe re nced ge neralized me thod of moments e stimators applie d to pane l data mode ls addre sse s the proble m of the pote ntial e ndoge ne ity of some e xplanatory variables, measurement e rrors and omitted variables. The ide a of the first–diffe re nce d GMM is ‚to take first diffe re nce s to re move unobse rve d time invariant country spe cific e ffe cts, and the n instrume nt the right –hand-side variable s in the first-diffe renced e quations using le ve ls of the se rie s lagge d one pe riod or more , unde r the assumption that the time varying disturbance s in the original le ve ls e quations are not serially correlated‛ (Bond, Hoe ffle r and Te mple , 2001). The Syste m GMM e stimator combines the pre vious set of e quations in first diffe re nces with suitable lagge d le ve ls as instrume nts, with an additional se t of e quations in le ve ls with suitably lagge d first diffe re nces as instrume nts. Blunde ll and Bond (1998) provide e vide nce with Monte C arlo simulations that Syste m GMM pe rforms be tte r than first-diffe re nce d GMM, the latte r be ing se riously biase d in small sample s whe n the instruments are we ak. To te st the validity of the lagge d variable s as instrume nts, we use the standard Hanse n te st of o ve r-ide ntifying re strictions, whe re the null hypothe sis is that the instrume ntal variable s are not corre late d with the re sidual, and the se rial corre lation te st, whe re the null hypothe sis is that the e rrors e xhibit no se cond-orde r se rial
72
corre lation. In our re gressions, none of the te sts on the statistics allows us to re ject the validity of the lagge d variable s as instrume nts as we ll as the lack of se cond orde r autocorre lation.
(c) Descriptive analysis of data
The data on carbon dioxide e missions pe r capita, the inve stme nt rate , the trade ope nne ss and the population growth rate are from the World De ve lopme nt Indicators (World Bank, 2005). The data on e ducation and political institutions come re spe ctive ly from Barro and Le e (2000) and Polity IV (2010).
The e missions of carbon dioxide pe r capita are me asure d in me tric ton pe r capita and are e stimate d from the combustion of fossil e ne rgie s and ce me nt industrie s in the liquid, solid or gas form. Trade ope nne ss and inve stme nt re spe ctive ly corre spond to the s hare of the sum of e xports and imports and inve stme nts in gross dome stic product (GDP). As political institutions variable , we chose the inde x of polity (2), which is a score obtaine d by
diffe re ntiating the inde x of de mocracy and the inde x of autocracy on a scale going from +10 (de mocracy) to -10 (autocracy). The indicator of de mocracy is characterized by the e ffective e xistence of institutional rule s framing of the powe r and the pre se nce of institutions e nabling citize ns to e xpre ss their e xpe ctations and to choose political e lite s. Autocracy is characte rize d by the abse nce or the re striction of political compe tition, e conomic planning and control. The e xe rcise of powe r is slightly constrained by institutions and the le ade rs are only se le cte d within a ‚political e lite ‛. The data on e ducation re sulting from Barro and Le e (2000) corre spond to the ave rage schooling ye ars in the total population.
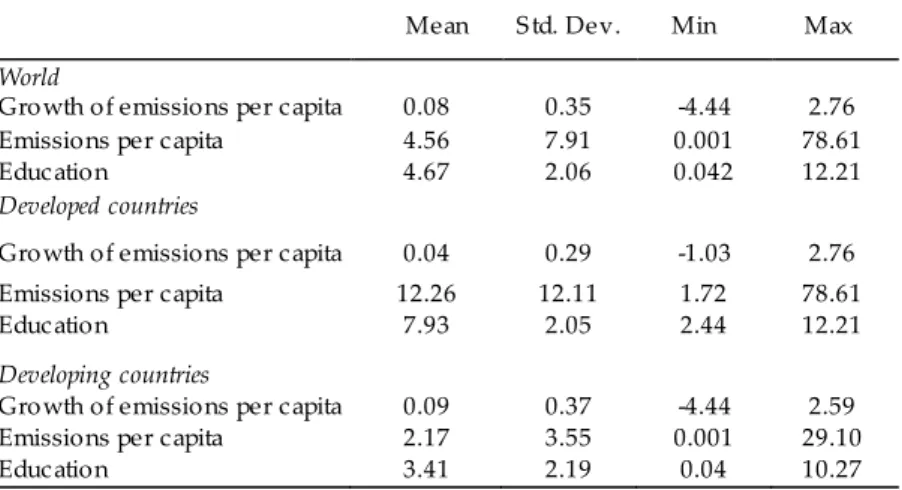
Table 1: Descriptive statistics of emissions of dioxide carbon and education
Mean S td. Dev. Min Max
World
Growth of emissions per capita 0.08 0.35 -4.44 2.76 Emissions per capita
Education 4.56 4.67 7.91 2.06 0.001 0.042 78.61 12.21 Developed countries
Growth of emissions per capita 0.04 0.29 -1.03 2.76 Emissions per capita
Education 12.26 7.93 12.11 2.05 1.72 2.44 78.61 12.21 Developing countries
Growth of emissions per capita 0.09 0.37 -4.44 2.59 Emissions per capita
Education 2.17 3.41 3.55 2.19 0.001 0.04 29.10 10.27 Notes: the total sample is composed of developed and developing countries over
the period 1970 -2004
73
Table 1 pre se nts de scriptive statistics of e ducation, carbon dioxide e missions le ve l and growth rate . It shows a high growth rate of car bon dioxide e missions pe r capita in the world (8.23%). This can be e xplaine d by the pollution growth rate in de ve loping countrie s (9.4%) indicating the ir importance in the pollution phe nome non, contrary to de ve lope d countrie s (4.3%). We also notice d that countrie s (De veloped countries) with high carbon dioxide e missions are relatively more e ducate d and have low carbon dioxide growth rate .
4. Results
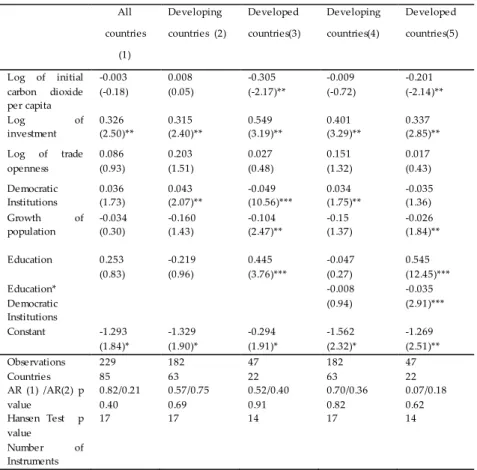
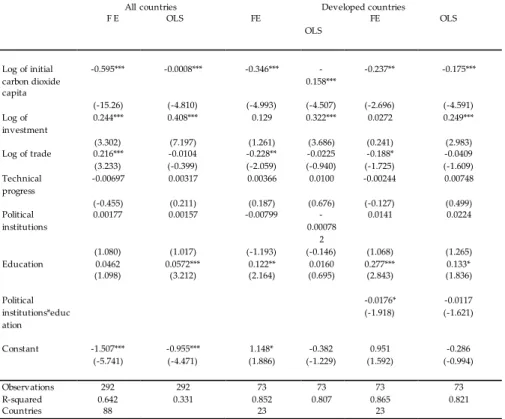
Table 2 pre se nts re sults obtaine d using the Syste m Ge ne ralize d Me thod of Mome nts (Syste m GMM). Column (1) shows the abse nce of conditional conve rge nce in carbon dioxide e missions pe r capita in the world, be cause the coe fficie nt is insignificant and e quals (- 0.003). Note that this coe fficie nt is be twe e n the fixe d e ffe cts (FE) e stimator (-0.595) and OLS e stima tor (-0.0008), which (Table 7 in Appe ndice s) are biased downward and upward in the dynamic pane l (for a small time pe riod) (Bond, 2002). This re sult is consiste nt with pre vious studie s (We ste rlund and Bashe r, 2008; Aldy, 2007), which found an absence of convergence in air pollution at the inte rnational le vel. Since countrie s de ve lop pollution be haviours according to the ir e conomic de ve lopme nt, we analysed the convergence in carbon dioxide pe r capita according to the le ve l of de ve lopme nt (i.e . de ve loping countrie s and de ve lope d countrie s).
Air pollution convergence according to economic development
Columns 2 and 3 of Table 2 show re sults whe n the sample is re stricte d to de ve loping countrie s and de ve lope d countrie s. We found conditional conve rgence in carbon dioxide e missions pe r capita for de velope d countrie s, and dive rge nce for de veloping countries. Our re sults are similar to Strazicich and List (2003) and Brock and Taylor (2010), who re ported convergence in air pollution for OECD countrie s. Inde e d the se re sults confirm the hypothe sis of conve rge nce among the 23 me mber countrie s of the Organization for Economic Coope ration and De ve lopme nt (OECD) be twe e n 1960-1997 and 1960-1998.
Inte re stingly, we also obse rve d that the e ffe cts of e ducation and political institutions on pollution growth we re significantly diffe re nt, de pe nding on the le ve l of de ve lopme nt. In fact, e ducation favours pollution growth in de ve lope d countrie s, in contrast with de ve loping countrie s whe re e ducation was not associate d with de cre as e d pollution growth. Political institutions contribute to pollution growth in de ve loping countrie s and atte nuate pollution growth in de ve lope d countrie s.
The role of institutions and human capital as fundame ntal source s of diffe re nces in e conomic de velopment, as highlighte d by the e conomic lite rature ,
74
sugge sts the possibility that the e ffe ct of e ducation on the e nvironme nt could diffe r according to the quality of institutions in a give n country.
Table 2: Effect of education on the growth of carbon dioxide per capita (System GMM)
Note: *significant at 10%; ** at 5%; *** at 1%. Temporal dummy variables are included. The
period is 1970 -2004 and data are compiled in five-year averages (70-74, 75-79, etc).
Interaction between education and institutions
Whe n conside re d to be a public good, improve me nts in the quality of the e nvironme nt are not dire ctly de te rmine d by individual pre fe re nce s, but rathe r indire ctly through political institutions. In othe r words, the inte raction be twe e n e ducation and political institutions could affe ct e nvironmental protection. Mahon (2002) hypothe sised that the e ffect of e ducation on the quality of the e nvironme nt could be significantly gre ate r in the pre se nce of stable political institutions that are conside re d to be a channe l of e xpre ssion for the pe ople . Inclusion of an inte ractive variable betwe en e ducation and institutions in our e quation sugge sts
All countries (1) Developing countries (2) Developed countries(3) Developing countries(4) Developed countries(5) Log of initial carbon dioxide per capita -0.003 (-0.18) 0.008 (0.05) -0.305 (-2.17)** -0.009 (-0.72) -0.201 (-2.14)** Log of investment 0.326 (2.50)** 0.315 (2.40)** 0.549 (3.19)** 0.401 (3.29)** 0.337 (2.85)** Log of trade openness 0.086 (0.93) 0.203 (1.51) 0.027 (0.48) 0.151 (1.32) 0.017 (0.43) Democratic Institutions 0.036 (1.73) 0.043 (2.07)** -0.049 (10.56)*** 0.034 (1.75)** -0.035 (1.36) Growth of population -0.034 (0.30) -0.160 (1.43) -0.104 (2.47)** -0.15 (1.37) -0.026 (1.84)** Education 0.253 (0.83) -0.219 (0.96) 0.445 (3.76)*** -0.047 (0.27) 0.545 (12.45)*** Education* Democratic Institutions -0.008 (0.94) -0.035 (2.91)*** Constant -1.293 (1.84)* -1.329 (1.90)* -0.294 (1.91)* -1.562 (2.32)* -1.269 (2.51)** Observations Countries AR (1) /AR(2) p value Hansen Test p value Number of Instruments 229 85 0.82/0.21 0.40 17 182 63 0.57/0.75 0.69 17 47 22 0.52/0.40 0.91 14 182 63 0.70/0.36 0.82 17 47 22 0.07/0.18 0.62 14
75
that the e ffe ct of e ducation on pollution growth is conditional on political institutions.
Columns (4) and (5) confirm that the growth rate of carbon dioxide pe r capita positive ly and significantly de pe nds on the inve stme nt rate . This variable is an important de te rminant of air pollution in de ve loping countrie s. In the se countries, pe ople are not ve ry conce rne d about e nvironme nt proble ms; and are more worrie d about de ve lopme nt proble ms (e .g. low and unstable growth, une mployme nt). The se inve stments can also reduce pove rty be cause the y are a driving force of e conomic growth. Fore ign and dome stic inve stme nts allow countrie s to access inte rnational marke ts, trade , and de ve lop ne w te chnologie s and compe te nce s. Howe ve r, the se opportunitie s diffe r with the le ve l of de ve lopme nt in the country.
In some countrie s, inve stme nts are dire cte d toward buildings, se rvice s and manufacturing sectors. In othe r countrie s, the y are dire cte d toward the natural re source sector: in particular oil firms and wood companie s, which are big e nergy consume rs, and thus pollutants. For e xample , in Africa, 65% of dire ct fore ign inve stments go to the natural re sources sector. The e xpe cte d e ffe cts are a rise in e mployme nt, taxes, state re ve nue s, and a re duction of pove rty . As such, the se countrie s can also be le ss sensitive to e nvironmental proble ms. In the same way, infrastructure we aknesses, particularly roads, strongly incre ases the use of e nergy and the consumption of polluting re source s.
Political institutions have a significant and opposite e ffect, base d on the le ve l of de ve lopment. In de veloping countrie s, the positive e ffe ct can be e xplaine d by fre e ride r be haviour (Carlsson and Lundström, 2003), whe re political le ade rs conside r pollution to be a public good and have no willingne ss to fight it. In contrast, in de ve loped countries, political institutions re duce carbon dioxide pe r capita growth; an e ffe ct which is more significant with e ducation. Columns (3) and (5) de monstrate that the e ffe ct of the quality of institutions on pollution growth is conditione d by the le ve l of e ducation.
Education also se e ms to be a factor in air pollution in de ve lope d countrie s, although its e ffe ct is slightly mitigate d by the pre sence of political institutions. In the absence of political institutions, e ducation incre ases pollution. Our re sults are similar to Jorge nson’s (2003). As me ntione d in the lite rature re vie w, a possible e xplanation is that e ducated pe ople have highe r incomes and are e ncourage d to ove r-consume. The y also fulfil the ir de sire to live we ll by accumulating mate rial goods without caring about the conse que nce s of this happine ss: following the ide ological mode l of ‚consume more to be happie r’’ (Prince n et al., 2001). Howe ve r, political institutions mitigate this ne gative e ffe ct of e ducation. In addition, although the y pollute , e ducate d pe ople are also more conscious of e nvironme ntal problems. Thus, the ir incre ased e ducation le vel will incre ase the ir pre fe rences for highe r le vels of e nvironme ntal prote ction, which the y will re fle ct through political institutions.
In de ve loping countrie s, e ducation and its inte ractive variable have no e ffe ct on the growth of carbon dioxide e missions pe r capita. Low e duc ation le ve ls and
76
the re lative we akne ss of political institutions might e xplain the abse nce of an e ffe ct of e ducation in de ve loping countrie s. The combination of the se factors strongly re duce s the ability of pe ople to e xpre ss the ir pre fe re nce s for a be tte r e nvironme nt. The refore, the average e ffe ct of e ducation on e missions growth is ne gligible . Furthe rmore , le ss e ducate d pe ople (re lative to those in de ve lope d countrie s) are also poor and consume le ss mate rial goods, which is a factor in e nvironme ntal de gradation.
While te chnical progre ss has no impact on pollution growth in de ve lope d countrie s, it is the ke y driving force be hind de pollution in de ve loping countrie s. The se results are not surprising. In de ve lope d countrie s, high e ducation le ve ls are also factors in the advance me nt of knowle dge and te chnical progre ss; in contrast, de ve loping countrie s produce little te chnical progre ss and re quire te chnology transfers. Be cause the le vel of te chnical progress is re lative ly low and the ir te chnological ne eds a re so enormous, an increase in te chnical progre ss (e .g. ne w te chnology transfers) has only a high marginal e ffe ct on pollution re duction. In othe r words, te chnical progress is more e ffe ctive in countrie s that are we akly e ndowe d with such progre ss.
4. Robustness checks
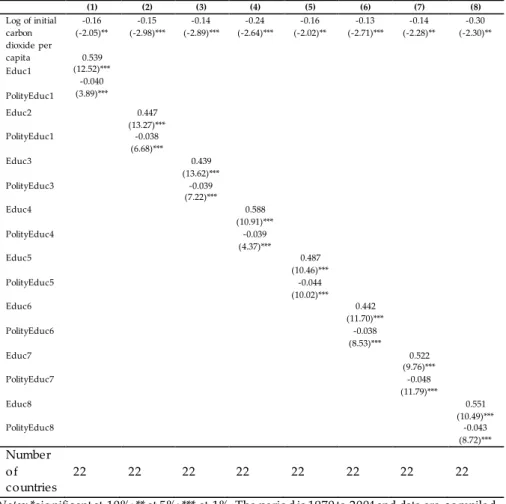
To analyse the stre ngth of our re sults, we conside re d e ight othe r e ducational me asures. The se are: the average of ye ars of schooling in ge ne ral for individuals ove r 25 ye ars old; the ave rage of ye ars of highe r le ve l schooling for individuals ove r 15 ye ars old; the ave rage of ye ars of highe r le ve l schooling for individuals ove r 25 ye ars old; the ave rage of ye ars of se condary le ve l for individuals ove r 15 ye ars old; the ave rage of ye ars of se condary le ve l for individuals ove r 25 ye ars old; the pe rce ntage of the population who comple te d some form of highe r e ducation; the pe rce ntage of the population who comple te d se condary school; and the pe rce ntage of the population who comple te d primary school. As sugge sted by Table s 3 and 4, our re sults re main stable in spite of the use of e ight alte rnative variable s. Thus, the ave rage primary, se condary and highe r school ye ars in the population have similar e ffe cts on the growth of carbon dioxide e missions pe r capita, and the se e ffe cts are diffe re nt according to the country’s le ve l of de ve lopme nt.
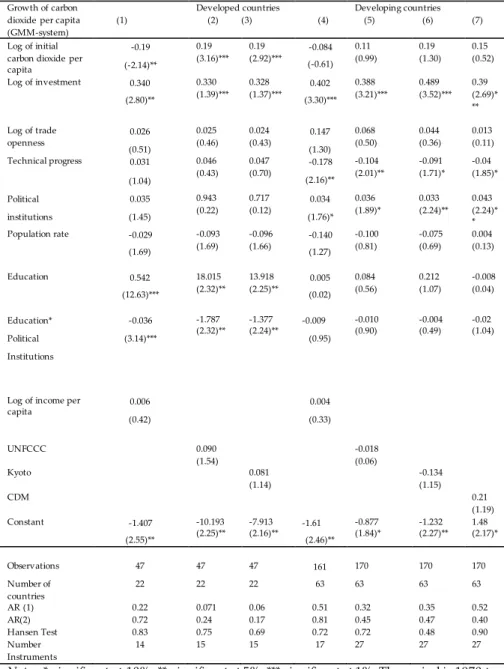
Se cond, we che cke d if the e ffe ct of e ducation on the growth of e missions pe r capita was simply due to omission of the income variable (GDP pe r capita). From the point that e ducation contribute s to a rise in income a nd e conomic growth, e ducation incre ases the use of e nvironmental re source s. It is thus a source of air pollution growth through incre ased income pe r capita. Our re sults may also be simply e xplaine d by omission of income (GDP/capita). Thus, to control for t he re le vance/accuracy of our re sults, we include d income pe r capita. Columns 1 and 4 of Table 5 show that income pe r capita does not have a significant e ffe ct on the growth of e missions pe r capita. Re sults are stable , cohe re nt and valid.
In re ce nt ye ars, the de bate on climate change has be e n re ne we d be cause e nvironme ntal and socio-e conomic e ffe cts are now more e vide nt. In re sponse ,
77
se ve ral inte rnational agre e me nts we re signe d be twe e n countrie s. To take into account the e ffect of inte rnational agre e me nts, we include d The Unite d Nations Frame work Convention on Climate Change (UNFCCC) and the Kyoto Protocol. The UNFCCC is an inte rnational e nvironme ntal tre aty produce d at the Earth Summit in Rio de Jane iro (1992). The obje ctive of the Tre aty was to e ncourage stabilization of the conce ntration of gre e nhouse gase s at a le ve l that would pre ve nt dange rous anthropoge nic inte rfe re nce with the climate syste m. The Kyoto protocol e stablishes fle xible mechanisms and commitme nts on the part of countrie s to stabilise or reduce the emissions of greenhouse gases (GHGs) by 5.3% ove r the pe riod 2008-2012. Thus, we we re ve ry inte rested in te sting the impact of the Kyoto Protocol and UNFCCC on the growth of carbon dioxide pe r capita. In Table 5 (columns 2, 3, 5, 6 and 7), we include ‚Kyoto‛ and ‚UNFCCC‛ variable s. The dummy take s a value of one if a country has ratifie d the Kyoto Protocol or the UNFCCC tre aty, and faces emissions reduction obligations; otherwise it take s a value of ze ro. Our re sults show that the Kyoto Protocol and the UNFCCC have no dire ct impact on the growth of carbon dioxide pe r capita. Two argume nts can e xplain the se re sults. First, it is still ve ry e arly to ve rify the e ffe cts of the Kyoto protocol commitments on air pollution growth, be cause our analysis cove rs the pe riod 1970-2004, and many countrie s only ratifie d it in 2002. Se cond, countrie s are not prompte d to re spe ct the ir inte rnational agre e me nts.
78
Table 3: Effect of alternative education variables on the growth of carbon dioxide per capita (GMM-System) in developed countries
(1) (2) (3) (4) (5) (6) (7) (8) Log of initial carbon dioxide per capita -0.16 (-2.05)** 0.539 (12.52)*** -0.040 (3.89)*** -0.15 (-2.98)*** -0.14 (-2.89)*** -0.24 (-2.64)*** -0.16 (-2.02)** -0.13 (-2.71)*** -0.14 (-2.28)** -0.30 (-2.30)** Educ1 PolityEduc1 Educ2 0.447 (13.27)*** -0.038 (6.68)*** PolityEduc1 Educ3 0.439 (13.62)*** -0.039 (7.22)*** PolityEduc3 Educ4 0.588 (10.91)*** -0.039 (4.37)*** PolityEduc4 Educ5 0.487 (10.46)*** -0.044 (10.02)*** PolityEduc5 Educ6 0.442 (11.70)*** -0.038 (8.53)*** PolityEduc6 Educ7 0.522 (9.76)*** -0.048 (11.79)*** PolityEduc7 Educ8 0.551 (10.49)*** -0.043 (8.72)*** PolityEduc8 Number of countries 22 22 22 22 22 22 22 22
Notes: *significant at 10%; ** at 5%; *** at 1%. The period is 1970 to 2004 and data are compiled
in five-year averages. Variables Educ1,< Educ8 correspond respectively to the logarithm of: the average schooling years in general for individuals over 25 years old, 15 years old; the average schooling years at a higher level for individuals over 25 years old; the average schooling years at a secondary level for individuals over 15 years old; the av erage schooling years at a secondary level for individuals over 25 years old; the percentage of the population having completed higher education; the percentage of the population having completed secondary school;and the percentage of the population having completed primary school.
79
Table 4: Effect of alternative education variables on the growth of carbon dioxide per capita (GMM-System) in developing countries
(1) (2) (3) (4) (5) (6) (7) (8) Log of initial carbon dioxide per capita -0.11 (-0.28) -0.204 (0.37) -0.001 (0.09) 0.05 (-0.10) -0.16 (-0.42) -0.47 (0.69) -1.15 (-0.67) -0.03 (-0.08) 0.42 (0.52) -0.41 (0.74) Educ1 PolityEduc1 Educ2 -0.114 (0.30) -0.002 (0.34) PolityEduc1 Educ3 0.074 (0.31) -0.001 (0.28) PolityEduc3 Educ4 -0.531 (0.89) -0.013 (0.85) PolityEduc4 Educ5 -0.429 (0.62) 0.001 (0.05) PolityEduc5 Educ6 -0.047 (0.15) -0.002 (0.35) PolityEduc6 Educ7 1.102 (0.65) 0.016 (0.54) PolityEduc7 Educ8 -0.619 (0.83) -0.009 (0.69) PolityEduc8 Number of countries 65 63 65 63 65 63 63 63
Notes: * significant at 10%, ** significant at 5%, *** significant at 1%. The period is 1970 -2004.
Variables Educ1,< Educ8 correspond respectively to the logarithm of: the average schooling years in general for individuals over (25 years old;15 years old); the average schooling years at a higher level for individuals over 25 years old; the average schooling years at a secondary level for individuals over 15 years old; the average schooling years at a secondary level for individuals over 25 years old; the percentage of the population having completed higher education; the percentage of the population having completed s econdary school; and the percentage of the population having completed primary school
80
Table 5: Effect of education on the growth of carbon dioxide per capita, including international agreements and income
Growth of carbon dioxide per capita (GMM-system) (1) Developed countries (2) (3) (4) Developing countries (5) (6) (7) Log of initial carbon dioxide per capita -0.19 (-2.14)** 0.19 (3.16)*** 0.19 (2.92)*** -0.084 (-0.61) 0.11 (0.99) 0.19 (1.30) 0.15 (0.52) Log of investment 0.340 (2.80)** 0.330 (1.39)*** 0.328 (1.37)*** 0.402 (3.30)*** 0.388 (3.21)*** 0.489 (3.52)*** 0.39 (2.69)* ** Log of trade openness 0.026 (0.51) 0.025 (0.46) 0.024 (0.43) 0.147 (1.30) 0.068 (0.50) 0.044 (0.36) 0.013 (0.11) Technical progress 0.031 (1.04) 0.046 (0.43) 0.047 (0.70) -0.178 (2.16)** -0.104 (2.01)** -0.091 (1.71)* -0.04 (1.85)* Political institutions 0.035 (1.45) 0.943 (0.22) 0.717 (0.12) 0.034 (1.76)* 0.036 (1.89)* 0.033 (2.24)** 0.043 (2.24)* * Population rate -0.029 (1.69) -0.093 (1.69) -0.096 (1.66) -0.140 (1.27) -0.100 (0.81) -0.075 (0.69) 0.004 (0.13) Education 0.542 (12.63)*** 18.015 (2.32)** 13.918 (2.25)** 0.005 (0.02) 0.084 (0.56) 0.212 (1.07) -0.008 (0.04) Education* Political Institutions -0.036 (3.14)*** -1.787 (2.32)** -1.377 (2.24)** -0.009 (0.95) -0.010 (0.90) -0.004 (0.49) -0.02 (1.04)
Log of income per capita 0.006 (0.42) 0.004 (0.33) UNFCCC 0.090 -0.018 (1.54) (0.06) Kyoto 0.081 -0.134 (1.14) (1.15) CDM 0.21 (1.19) Constant -1.407 (2.55)** -10.193 (2.25)** -7.913 (2.16)** -1.61 (2.46)** -0.877 (1.84)* -1.232 (2.27)** 1.48 (2.17)* Observations 47 47 47 161 170 170 170 Number of countries 22 22 22 63 63 63 63 AR (1) 0.22 0.071 0.06 0.51 0.32 0.35 0.52 AR(2) 0.72 0.24 0.17 0.81 0.45 0.47 0.40 Hansen Test 0.83 0.75 0.69 0.72 0.72 0.48 0.90 Number Instruments 14 15 15 17 27 27 27
Notes: * significant at 10%, ** significant at 5%, *** significant at 1%. The period is 1970 to
2004 and data are compiled in five -year averages (70-74, 75-79, etc). Temporal dummies are taken into account.
81
5. Conclusion
This study e xamine d convergence in air pollution and the e ffe ct of e ducation on the growth of air pollution ove r the pe riod 1970-2004 in 85 countrie s. Our re sults show a dive rge nce in carbon dioxide pe r capita at a global le vel during the pe riod 1970-2004. For de ve loping countrie s, the re is a dive rge nce in carbon dioxide pe r capita.
Our re sults also sugge st that e ducation has no impact on the growth of air pollution in the total sample (85 countrie s). Howe ve r, this e ffect is he terogene ous be twe e n the countries according to the ir le ve l of de ve lopme nt. Inde e d, while its e ffe ct re mains insignificant in the de ve loping countrie s sub -sample , e ducation doe s matter for pollution growth in the de ve lope d countrie s. More inte re stingly, whe n controlle d for the quality of de mocratic institutions, the positive e ffe ct of e ducation on air pollution growth is mitigate d in de ve lope d countrie s, while it is insignificant in de ve loping countrie s.
Te chnical progre ss contribute s to a re duction in air pollution growth. Inve stment, which is the driving force be hind e conomic growth, is an important source of pollution in both de ve loping and de ve lope d countrie s.
Our re sults are important for e conomic policy de ve lopme nt. Initially, the y highlight the importance of e ducation in e nvironme ntal prote ction. The curre nt accumulation of knowle dge is a factor in both e conomic growth and pollution growth. We are not re comme nding que stioning e ducation policie s, whose intrinsic value s are obvious. On the contrary, the re is a ne e d for introducing a change d pe rce ption of the role of e ducation, in favour of the e nvironme nt. This should be ve ry urge ntly imple me nte d in de ve loping countrie s, be cause the re alisation of the Mille nnium De ve lopme nt Goals (MDG) re garding e ducation will be followe d by e nvironme ntal pollution. The n, the re is the fre e ride r phe nome non practised by some countrie s in the fight against climate change . In addition, be cause inve stme nts are a ke y factor in e conomic growth and a de te rminant of pollution, re duction of the se e ffects should be ne cessarily followed by the e stablishme nt of e cologically appropriate inve stme nts. Finally, the dive rge nce of air pollution at an inte rnational and de ve loping countrie s le ve ls re quire s transformation of the Kyoto protocol, which should include agre e me nts for te chnology transfe rs and the promotion of e cological de ve lopme nt.
This pape r ope ns se ve ral ave nue s for future re se arch. Inde e d, our re sults highlight the conve rge nce and dive rge nce in air pollution for de ve lope d and de ve loping countrie s, re spe ctive ly. It will the re fore be inte re sting to analyse de e pe r de te rminants of air pollution conve rge nce with re spe ct to e conomic de ve lopme nt.
82 References
Aldy, J. E. (2007), ‘Divergence in S tate -Level Per Capita Carbon Dioxide Emissions,’ in Land
Economics, 83(3): 353-369.
Barro, R. J. and Lee, J. (2000), ‘International Data on Educational Attainment: Updates and Implications,’ in Harvard University Center for International Development Working Paper
No. 42.
Bartel, A. P. and Lichtenberg, F. R. (1987), ‘The Comparative Advantage of Educated Workers in Implementing New Technology’, in The Review of Economics and Statistics, 69(1): 1-11.
Bernard, A. B. & Durlauf, S . N., (1995), ‘Convergence in International Output,’ in Journal of
Applied Econometrics, 10(2): 97-108.
Bernard, A. B. and Durlauf, S . N., (1996), ‘Interpreting tests of the convergence hypothesis,’ in Journal of Econometrics, 71(1-2):161-173.
Bimonte, S . (2002), ‘Information access, income distribution, and the Environmental Kuznets Curve’, in Ecological Economics, 41(1): 145-156.
Blundell, R., and Bond, S . (1998), ‘Initial conditions and moment restrictions in dynamic panel data models’, in Journal of Econometrics, 87(1), 115-143.
Bond, S . R., Hoeffler, A., and Temple, J. R. (2001), ‘GMM Estimation of Empirical Growth Models’, in SSRN eLibrary. Available at:
http://papers.ssrn.com/sol3/papers.cfm?abstract_id=290522.
Bond, S . (2002), ‘Dynamic panel data models: A guide to micro data methods and practice,’ in Working Paper 09/02. Institute for Fiscal S tudies, London.
Brock, W. A. and Taylor, M. S . (2010), ‘The Green S olow model’, in Journal of Economic
Growth, 15(2): 127-153.
Carlino, G. A., and Mills, L. (1996), ‘Testing neoclassical convergence in regional incomes and earnings,’ in Regional Science and Urba n Economics, 26(6): 565-590.
Carlsson, F., and Lundström, S . (2003), ‘The effects of economic and political freedom on CO2 emissions,’ Working Papers in Economics 29, Göteborg University , Department of Economics.
Caselli, F., and Coleman, W. J. (2001), ‘Cross-Country Technology Diffusion: The Case of Computers’, in The American Economic Review, 91(2): 328-335.
Dasgupta, S ., and Wheeler, D. (1997), ‘Citizen Complaints as Environmental Indicators: Evidence from China ’, in World Bank Development Research Group Working Paper, November.
83
Eaton, J., & Kortum, S . (1999), ‘International Technology Diffusion: Theory and Measurement’, in International Economic Review, 40(3): 537-570.
Farzin, Y. H., and Bond, C. A. (2006), ‘Democracy and environmental quality’, in Journal of
Development Economics, 81(1): 213-235.
Jorgenson, A. K. (2003), ‘Consumption and Environmental Degradation: A Cross -National Analysis of the Ecological Footprint’, in Social Problems, 50(3): 374-394.
Keller, W. (2004),‘International Technology Diffusion’, in Journal of Economic Literature, 42(3): 752-782.
Marshall, M. G. and Jaggers, K. (2010), Political Regime Characteristics and Transitions, 1800
-2009, Polity IV Project, University of Maryland.
McMahon. (2002), Education and Development; Measuring the Social Benefits, Oxford and New York: Oxford University Press .
Nelson, R. R., and Phelps, E. S . (1966), ‘Investment in Humans, Technological Diffusion, and Economic Growth’, in The American Economic Review, 56(1/2): 69-75.
Nguyen Van, P. (2005), ‘Distribution Dynamics of CO2 Emissions’, in Environmental and
Resource Economics, 32(4): 495-508.
Princen, T. (2001), ‘Consumption and its Externalities: Where Economy Meets Ecology’, in
Global Environmental Politics, 1(3): 11-30.
Quah, D.T. (1995a), ‘Empirics for Economic Growth and Convergence’, Centre for Economic
Performance Discussion Paper No. 253.
Quah, D.T. (1995b), ‘Convergence Empirics Across Economies with (S ome) Capital Mobility’, Centre for Economic Performance Discussion paper No. 257 .
Quah, D.T. (1996), ‘Convergence Endogenous Growth, and Productivity Disturbances’,
Centre for Economic Performance Discussion paper No. 290 .
Quah, D (1997), ‘Empirics for Growth and Distribution: S tratification, Polarization, and Convergence Clubs’, Centre for Economic Performance Discussion Paper, No. 324 . Quah, D.T. (2000), Cross-Country Growth Comparison: Theory to Empirics, LS E Economics
Department.
S ala-i-Martin, X. (1990), ‘On Growth and S tates’, PhD Dissertation, Harvard University. S tegman, A. (2005), ‘Convergence in carbon emissions per capita’, Centre for Applied
Macroeconomic Analysis Working Paper, The Australian National University.
S trazicich, M. C. and List, J. A. (2003), ‘Are CO2 Emission Levels Converging Among Industrial Countries?’, in Environmental and Resource Economics, 24(3): 263-271.
84
Wells, Jr. (1972), The Product Life Cycle and International Trade, Boston: Harvard Business S chool Division of Research.
Westerlund, J. and Basher, S . A. (2008), ‘Testing for Convergence in Carbon Dioxide Emissions Using a Century of Panel Data’, in Environ Resource Econ, 40: 109–120. Wheeler, D., Huq, M. and Martin, P. (1993), ‘Process Change, Economic Policy, and
Industrial Pollution: Cross Country Evidence from the Wood Pulp and S teel Industries,’
Presented at the Annual Meetings, American Economic Association, Anaheim, California.
World Bank, (2005), World Development Indicators, Washingtion, DC: IBRD
Appendices
List of countries included in the sample
Australia, Austria, Belgium, Canada Denmark, France, Finland, Germany, Greece, Holland, Israel, Italy, Japan, Luxemburg, New Zealand, Norway, Portugal, S pain, S weden, S witzerland, United Kingdom, The US A. Algeria, S outh Africa, Burundi, Benin, Bangladesh, Bahrain, Bolivia, Brazil, Botswana, Central Africa, Chilie, China, Cameroun, Congo, Colombia, Co sta Rica, Dominican Republic, Ecuador, Egypt, Fiji, Ghana, Guatemala, Honduras, Haiti, Hungary , Indonesia, India, Iran, Jamaica, Jordan, Kenya, Mexico, Mali, Mauritania, Malawi, Malaysia, Niger, Nicaragua, Nepal, Pakistan, Peru, Philippines, New Guinea, Guinea, Poland , Paraguay, Rwanda, S enegal, Sri Lanka, S ierra Leone, El S alvador, S yria,Togo, Thailand, Trinidad and Tobago, Tunisia, Turkey , Uganda,Uruguay, Zambia.
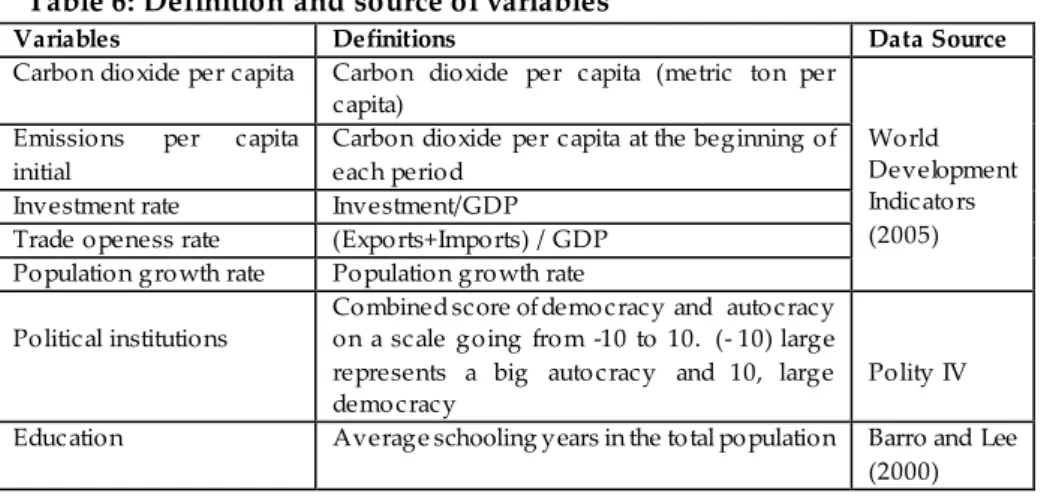
Table 6: Definition and source of variables
Variables Definitions Data Source
Carbon dioxide per capita Carbon dioxide per capita (metric ton per capita)
World Development Indicators (2005) Emissions per capita
initial
Carbon dioxide per capita at the beginning of each period
Investment rate Investment/GDP Trade openess rate (Exports+Imports) / GDP Population growth rate Population growth rate Political institutions
Combined score of democracy and autocracy on a scale going from -10 to 10. (- 10) large represents a big autocracy and 10, large democracy
Polity IV Education Average schooling years in the total population Barro and Lee
85
Table 7: Effect of education on the growth of carbon dioxide pe capita with Fixed effects (FE) and (Ordinary Least Square)
Note: *significant at 10%; ** at 5%; *** at 1%. Temporal dummy variables are included. The period is 1970 -2004 and data are compiled in five -year
averages (70-74, 75-79, etc)
Table 8: Descriptive statistic
Variables Mean Std. Dev. Min Max
Log of initial per capita dioxide carbon 4.56 0.35 0.0015 78.61 Growth rate of dioxide carbon per capita 0.08 7.91 -4.44 2.76
Investment rate 21.42 7.39 2.53 86.79
Trade openess rate 71.14 41.51 5.71 297.33
Political institutions 0.49 7.47 -10 +10
Population growth rate 1.97 1.61 -20.36 16.17
Education 4.67 2.95 0.042 12.21
Source: WDI (2005), Polity IV, Barro and Lee (2000)
All countries Developed countries
F E OLS FE OLS FE OLS Log of initial carbon dioxide capita -0.595*** -0.0008*** -0.346*** -0.158*** -0.237** -0.175*** (-15.26) (-4.810) (-4.993) (-4.507) (-2.696) (-4.591) Log of investment 0.244*** 0.408*** 0.129 0.322*** 0.0272 0.249*** (3.302) (7.197) (1.261) (3.686) (0.241) (2.983) Log of trade 0.216*** -0.0104 -0.228** -0.0225 -0.188* -0.0409 (3.233) (-0.399) (-2.059) (-0.940) (-1.725) (-1.609) Technical progress -0.00697 0.00317 0.00366 0.0100 -0.00244 0.00748 (-0.455) (0.211) (0.187) (0.676) (-0.127) (0.499) Political institutions 0.00177 0.00157 -0.00799 -0.00078 2 0.0141 0.0224 (1.080) (1.017) (-1.193) (-0.146) (1.068) (1.265) Education 0.0462 0.0572*** 0.122** 0.0160 0.277*** 0.133* (1.098) (3.212) (2.164) (0.695) (2.843) (1.836) Political institutions*educ ation -0.0176* (-1.918) -0.0117 (-1.621) Constant -1.507*** -0.955*** 1.148* -0.382 0.951 -0.286 (-5.741) (-4.471) (1.886) (-1.229) (1.592) (-0.994) Observations 292 292 73 73 73 73 R-squared 0.642 0.331 0.852 0.807 0.865 0.821 Countries 88 23 23