Client-side Optimizations for Mobile Publish
Subscribe Systems
by
Kimberly L Toy
Submitted to the Department of Electrical Engineering and Computer
Science
in partial fulfillment of the requirements for the degree of
Masters of Engineering in Electrical Engineering and Computer Science
at the
MASSACHUSETTS INSTITUTE OF TECHNOLOGY
February 2016
c
○ Massachusetts Institute of Technology 2016. All rights reserved.
Author . . . .
Department of Electrical Engineering and Computer Science
January 28, 2016
Certified by . . . .
Samuel R. Madden
EECS Professor
Thesis Supervisor
Accepted by . . . .
Christopher J. Terman
Chairman, Masters of Engineering Thesis Committee
Client-side Optimizations for Mobile Publish Subscribe
Systems
by
Kimberly L Toy
Submitted to the Department of Electrical Engineering and Computer Science on January 28, 2016, in partial fulfillment of the
requirements for the degree of
Masters of Engineering in Electrical Engineering and Computer Science
Abstract
Smartphones can provide a great deal of information about their users using numerous built-in sensors, such as location, local weather conditions, or current method of travel. This information has the potential to be relevant to other users, allowing them to be alerted about pertinent events in real-time, such as knowing where their family members are. This thesis proposes a design for a publish-subscribe system aimed to support sharing sensor data between mobile clients, where users can specify complex subscriptions over sensor data generated by other phones and receive alerts when a relevant event occurs. We present a number of client-side optimizations for collecting sensor data on the mobile device and communicating that data with the publish subscribe server efficiently, in order to reduce battery usage and data transmission. We then perform an evaluation of these optimizations, discuss design tradeoffs, and show which scenarios the optimizations perform best in.
Thesis Supervisor: Samuel R. Madden Title: EECS Professor
Acknowledgments
I would like to thank Sam Madden for taking the time to advise me through the course of the M.Eng program. Throughout the process of developing the basis for my project, solidifying a direction, and working through the technical details, he has provided helpful advice and valuable feedback.
Thank you to my family, for supporting me in my decision to further my education and for the encouragement that they have given me throughout the year.
Lastly, I would like to thank my friends for sharing their own experiences in the M.Eng program, giving helpful suggestions when I had trouble moving forward, and providing the company that I needed when the going got tough.
Contents
1 Introduction 13
1.1 Motivations for Real-time Notifications of Sensor Data . . . 14
1.2 Applications for Sharing Sensor Data . . . 14
1.2.1 Location based Subscription Scenarios . . . 15
1.2.2 Non-location based Subscriptions . . . 16
1.2.3 1.2.3 Non-mobile phone publishers . . . 17
1.3 Contributions and Paper Outline . . . 18
1.3.1 Framework Design and Communication Protocol . . . 18
1.3.2 Client-side Optimization techniques . . . 18
1.3.3 Validating performance . . . 19
2 Background 21 2.1 Overview of the Publish-Subscribe Pattern . . . 21
2.2 Existing Mobile Backend Systems . . . 22
2.2.1 Mobile Push Notification Systems . . . 22
2.2.2 Mobile Backend Frameworks . . . 23
2.3 Smartphone Specifications . . . 24
2.3.1 Mobile Device Sensors . . . 24
2.3.2 Mobile Device Limitations . . . 27
3 System Architecture 29 3.1 Matching server . . . 30
3.1.2 Publication/Query Language . . . 31
3.2 Client-side Optimization Techniques . . . 36
3.2.1 Forwarding Query Unions to Publishers . . . 36
3.2.2 Publication Filtering . . . 37
3.2.3 Smart Sensor Sampling . . . 37
3.3 Maintaining a Query Index . . . 40
4 Evaluation 47 4.1 Publication Filtering . . . 48
4.2 Smart Sensor Sampling . . . 52
4.3 Query Indexes . . . 56
4.3.1 Size of Query Index During Transmission . . . 56
4.3.2 Efficiency Analysis of Query Union Search . . . 59
4.4 Analysis based on Application Scenarios . . . 63
List of Figures
2-1 Coordinate system used by the Android SensorEvent API [12]. . . 25
3-1 Overview of System Architecture. . . 29
3-2 Demonstration of smart sensor sampling along a path where each point represents a sample, and the shaded rectangle represents a region con-tained by a query. . . 40
3-3 Structure of the hash table based query index. . . 41
3-4 Pseudocode demonstrating how a query union is generated for a hash table based query index, where S is the subscriber ID. . . 42
3-5 Example of a query index backed by an R-tree. . . 43
3-6 Example of a bloom filter based query index. . . 45
4-1 Map of Boston taxi hotspots. . . 48
4-2 Percentage of data points filtered for top forty taxis with most data. . 50
4-3 Query filtering results over taxi 52 from 1/2008 to 8/2008. . . 51
4-4 Taxi transmission data for 1/7/2008 from 2AM to 8:30AM. . . 52
4-5 Breakdown of smart sensor sampled data points for Taxi 52. . . 53
4-6 Taxi 52 transmission data for smart sampling on 1/7/2008 from 2AM to 8:30AM. . . 54
4-7 Smart sampling percentage of data filtered for Taxi 52. . . 55
4-8 Calculation for estimating the necessary size of a bloom filter. . . 57
4-9 Calculation to estimate how many hash functions are needed. . . 57
4-10 Different types of data distribution. . . 59
List of Tables
2.1 Power profile value and minimum delay between samples for Nexus 4 sensors. . . 27 3.1 Standard fields for publication documents where starred items denote
required attributes. . . 33 3.2 Standard fields for subscriptions where starred items denote required
attributes. . . 34 3.3 Examples of the publication and subscription data format. . . 35 3.4 Backoff and advance functions for exponential duty cycling, where x’
is the length of the new interval between samples and x is the length of the previous interval. . . 38 3.5 Example values for minimum and maximum intervals between samples
for each sensor type. . . 39 4.1 Number and percentage of data points remaining when filtered per taxi
hotspot region. . . 49 4.2 Power profile value and minimum delay between samples for Nexus 4
sensors. . . 58 4.3 CPU performance of searching query unions. . . 61 4.4 Battery performance of searching query unions. . . 61
Chapter 1
Introduction
The evolution of mobile phones has come a long way from simply being portable devices to make phone calls. Today’s smartphones are multifunctional and provide a multitude of different applications, from allowing users to check their email, use their phone as a camera, or find driving directions. Smartphones are packed with numerous sensors to provide this intricate functionality. Your mobile device likely includes multiple wireless radios to connect to bluetooth devices or the Internet via Wi-Fi or a paid data plan, built-in GPS that allows you to use location-based apps, and a camera to take photos. Besides allowing for a rich set of applications for just the user of the phone, this multitude of sensors can capture a great deal of information that would allow others to learn about the user of the phone, from simple, direct sensor readings, such as what location the user is at, to more complex inferences, such as whether or not the user of the phone is travelling and what traffic conditions look like near the user.
Sharing information captured through the sensors of a mobile phone is not a novel idea. For example, the application Foursquare allows users to select their location from a list of nearby venues and send that information to their friends. However, each of these applications must build a custom backend to support the data sharing, because there currently is no generic framework that supports this.
Given the growing market for mobile applications, it would be convenient for developers to be able to utilize a framework that provides a service to share
sensor-related data produced by smartphones. In this thesis, I describe the motivations for creating such a system and a proposal for its design, which is geared towards mobile phone clients and is specifically optimized for the efficient transfer of sensor data.
1.1
Motivations for Real-time Notifications of Sensor
Data
Notifications have the potential to send the right information to a user, at right place and the right time. The system proposed in this paper aims to make it easier for developers to create applications where users only receive notifications that are relevant to them and to connect users by sharing sensor data. This shared information would allow mobile phone users to learn more about the world around them. This framework would make it easier to share crowdsourced data produced by phones, or receive important alerts from remote sensors.
Supporting relevant notifications is accomplished by incorporating the publish-subscribe pattern into the framework, which would allow users who are listening to sensor data to specify exactly what information they want to hear and be alerted of that information in real-time. In the following text, we will refer to the different users in the system by their role in the publish-subscribe pattern. Thus, users who produce data will be referred to as publishers and those who consume data will be referred to as subscribers.
1.2
Applications for Sharing Sensor Data
We detail several use cases, showing applications that could build off of our proposed framework. Each of these examples demonstrate scenarios where users can derive useful information from sensor data and would benefit from receiving alerts in real-time. These scenarios are divided into three categories: location based subscriptions, non-location based subscriptions, and scenarios with non-mobile phone publishers.
1.2.1
Location based Subscription Scenarios
In these examples, subscribers are interested in listening to relevant information about their surroundings. Subscriptions in this scenario are localized; the sensor data that users would like to receive comes from publishers who are also in the same region. Publishers themselves can also be mobile and thus move out of the subscriber’s region of interest, or they can be stationary and will stay in static locations.
Crowdsourced Traffic Alerts and Navigation
Applications like Google Maps provide users with traffic data and optimized driv-ing directions by analyzdriv-ing data from real mobile phone users’ location data to create an optimal route and calculate an approximate time estimation. Using the framework described in this paper, it would be more trivial to develop a similar application.
Each user of the application who is currently driving would publish their sensor readings, such as current speed, location, and acceleration, in order to contribute to the traffic monitoring. We can derive whether a user is driving using the Android De-tectedActivity class, described in further in section 2.3.1. Users who are performing route finding or are just checking traffic conditions can subscribe to the region be-tween their current location and destination, or the area that they plan to be driving in. The data that subscribers receive would allow the application to display average speeds along roads and determine from the acceleration data if there are conditions such as stop and go traffic.
Noise Monitoring
If you’re looking for a quiet place, you might want to know the noise levels in nearby locations. Using the phone’s microphone, it is possible to measure the ap-proximate ambient noise level around a phone’s user. Users of the application would publish the ambient noise levels, and others who are looking for a quiet place would put in a subscription for their surrounding region and receive readings on the noise levels nearby.
1.2.2
Non-location based Subscriptions
In these scenarios, the data that subscribers are interested in is not just limited to regional data. Users would want to subscribe to certain publishers’ information re-gardless of location. For example, if you were subscribed to security sensors in your home, you would want to receive alerts about suspicious activities regardless of where you are.
Family or Friend Locator
In this type of application, a user may want to know the location of certain people, such as their family members or friends. The user would specify the people that he or she would want to subscribe to, and those users would periodically publish their location.
This situation also has the potential for users to ask more complex queries, such as, are their family members in a certain location (e.g. at home or in school), are they currently travelling and what is their current method of travel, or have they been involved in an accident. Some of these queries can be answered by a straight reading of sensor data, but others, such as inferring an associated location or whether an accident has occurred, would require inferences from the sensor data and are not supported by the current design of this system.
Electronic tagging
Using bluetooth tracking devices, users can tag their valuables and use crowd-sourcing to find lost items. An example of such a product is the Tile tracker [1]. These tracking devices emit unique Bluetooth low energy signals that mobile phones can detect. Using the framework designed in this paper, we can support a similar app that uses crowdsourcing to find lost items tagged with these trackers.
When a user loses an item, the user can put in a subscription specifying he or she they are searching for the lost tagged item. All users of the lost and found service are potential publishers. Their devices would send publications when they sense tagged
items, showing the location that they sensed the item and which item it was. Through our publish-subscribe service, subscribers would receive alerts when another user has sensed their lost item.
This scenario is not location based, because users’ subscriptions are querying for specific objects, not for publications in the local area.
1.2.3
1.2.3 Non-mobile phone publishers
These are scenarios in which the publishing devices are not necessarily other mobile phones. The system designed in this paper can be extended to support generic sensors that have Wi-Fi access and other computational abilities, in addition to supporting smartphones. If the framework were extended to allow for a broader selection of sensor devices, it would allow for a much richer application set. In the vision for an Internet of Things, where sensors, software, and network connectivity are embedded in common, physical objects, having a generic framework to communicate sensor data would make it much easier for developers to move quickly when designing new appli-cations.
Open Power Outlet Finder In this hypothetical scenario, we envision public power outlets which have sensors registering whether the outlet is in use or not. If some elec-tronics are plugged into the outlet and are drawing power, the sensor would register that the outlet is in use. Users looking for power outlets would subscribe to outlets in the nearby vicinity, and the outlets would send publications when they are not in use. A user at the airport who is looking to charge their device could then place a subscription and wait to be alerted when a charging station is free.
Public Transportation
When looking to ride a bus or some other form of public transportation that doesn’t operate on a reliable schedule, users may want notifications of when busses on their routes of interest arrive at nearby pickup locations. Such applications already
exist, but these scenarios could also make use of our generic sensor framework. The busses would periodically publish their locations, and users would subscribe for the bus routes that they are waiting for in order to receive alerts when those busses arrive at the closest stop.
1.3
Contributions and Paper Outline
The contributions of this thesis involve proposing a system design for a publish-subscribe framework with optimizations for mobile devices, motivating the system’s benefits and viability, and performing an initial benchmarking to validate perfor-mance.
1.3.1
Framework Design and Communication Protocol
We describe how the publish-subscribe pattern will be used in order to allow mobile devices to share sensor data with other users. This includes developing a language for the mobile devices to publish data to the server and for the server to send that data back to subscribing phones.
1.3.2
Client-side Optimization techniques
Much work has already been done on optimizing the publication and subscription matching process of publish-subscribe systems, but given the specific use case of our proposed system, we present client-side optimizations that occur before the pub-sub matching process begins. The main concerns involve preventing data which does not match any subscriptions from reaching the central publisher-subscribe server, in order to reduce data usage and reduce the workload on the server, and optimizing sensor sampling on the phone, in order to prevent battery drain for the client. We suggest three different optimization techniques: publication filtering, smart sensor sampling, and query indexes.
1.3.3
Validating performance
We provide an analysis of our optimization techniques using an example use case with pre-sampled location data and to show the viability of these strategies. We also present hypothetical scenarios to analyze when the techniques are expected to behave optimally or non-optimally.
Chapter 2 will provide more background on the publish-subscribe pattern, dis-cuss existing mobile backend systems, and give an overview of mobile technology, including a summary of commonly available sensors and the limitations of mobile phones. Chapter 3 outlines the architecture of the proposed publish-subscribe sys-tem, including a description of the publication and subscription language and details on the client-side optimization techniques. Chapter 4 provides an evaluation of the performance of these techniques using pre-sampled datasets. Chapter 5 concludes this paper and presents further work.
Chapter 2
Background
2.1
Overview of the Publish-Subscribe Pattern
The publish-subscribe pattern is a messaging pattern in which users do not need to explicitly specify the receivers of their messages. There are two user roles; publishers send the messages, and subscribers specify what types of messages they are interested in receiving. It is a push-based system, so subscribers do not have to actively poll to check for new messages. Instead, the server pushes data to the client.
Publish-subscribe systems can be either based or content based. In a topic-based system, publishers label their messages with relevant topics, and all subscribers who have subscribed to those topics receive the messages. In a content-based system, subscribers specify the attributes of the messages that they wish to receive, for exam-ple, messages containing certain text. A content-based system offers more flexibility, as subscribers can specify more complex constraints for the messages that they want to receive. The system described in this paper is a content-based system.
Because the publish-subscribe pattern decouples publishers and subscribers, the server must perform the matching messages and subscriptions. Optimized methods for performing efficient matching of messages and content-based subscriptions have been thoroughly researched. These approaches generally involve grouping subscriptions by similarities. Existing algorithms include pre-processing subscriptions into matching trees, which are then used to efficiently match messages [2], clustering subscriptions
by similar predicates and matching messages to predicates represented by each cluster in order to determine which subscriptions capture the event [3], or by using forwarding tables [4].
2.2
Existing Mobile Backend Systems
Although publish-subscribe is an established pattern, its usage in the mobile space is not largely available through a standard framework. The available mobile frameworks provide portions of the functionality that one would expect from a pub-sub system. Android developers have access to systems that can deliver push notifications or some backend frameworks that allow for custom messages for targeted user groups. We briefly discuss a number of these systems and their available features.
2.2.1
Mobile Push Notification Systems
Android developers can leverage a free service, Google Cloud Messaging (GCM), that enables them to send messages from servers to client applications [5]. Developers must implement both the server application and mobile app, but they can use the GCM to send data downstream from their server to the client app or vice versa. The GCM also supports the delivery of push notifications to mobile phones and in order to notify users of events even when they are not actively using the client app. Lastly, the GCM also supports topic based messaging. Mobile clients can register for a topic, and the server can send messages to that topic in order to target the clients who have opted in.
This functionality of the GCM gives developers a basic framework for communi-cating between mobiles and a server and allows for push notifications, which would let us alert subscribers of new messages. However, the available functionality does not provide the server-side publish-subscribe support, and the developer still has the overhead of setting up the server application.
2.2.2
Mobile Backend Frameworks
Several widely used frameworks provide mobile developers with easy to integrate back-end systems that include cloud storage solutions, user management, and other fea-tures. These services are sometimes known as "mobile backend as a service" (MBaaS). Although these services provide helpful features to ease mobile application de-velopment, they generally do not offer much support for sending subscription based notifications. Of the many popular MBaaS services that are available, few even offer support for sending personalized notifications. Some examples of tools in this space include:
Firebase
Firebase provides a cloud storage solution that syncs any data changes across all devices, with offline support [6]. When a device is offline, data is written to a local store and is synced with Firebase servers when the device connects to a net-work. Using this real-time syncing, Firebase could be used as a simple channel-based publish-subscribe system, where publishers send messages by adding data to the Fire-base dataFire-base, and subscribers have access to that data, which would be automat-ically synced. However, this setup does not offer the flexibility as a content-based publish-subscribe system, which would limit the complexity of subscriber queries and therefore limit the kinds of questions that subscribers can ask.
Parse
The Parse platform is another widely used product for data storage that also allows apps to send push notifications to certain target audiences based on conditions such as age, location, or language, which are determined by a user’s Facebook data [7]. Again, this does not provide ideal support for building applications that share sensor data and allows users to derive interesting information from that data. Users of Parse applications do not actively subscribe to notifications. Instead, the developers choose their targeted groups.
Kinvey
Kinvey is mobile backend that also allows application developers to write custom business logic to set up triggers that send push notifications to targeted user groups. This allows for scenarios such as sending user notifications when events happen near a user by setting up a location based trigger [8]. This would provide the closest behavior to our proposed publish-subscribe framework, but it would not provide the same convenience as our system. Developers would need to write custom triggers for each type of publication that they would want to support.
2.3
Smartphone Specifications
The reference device used in this paper for power usage analysis is the Nexus 4 phone, a popular Android device. We discuss the specifications of the phone’s available sensors and their power consumption when active.
2.3.1
Mobile Device Sensors
We describe the variety of sensors available on the Nexus 4 in more detail, explain their common usage, and discuss how these sensors provide interesting information that could be relevant to other users. Not all of these "sensors" correspond to a discrete physical piece of hardware on the phone. Some of these listed items provide informa-tion derived from a physical hardware sensor, such as linear accelerainforma-tion, which is a derived metric from the actual accelerometer and an orientation sensor. However, all of the listed items are readily accessible through the Android API through a single call.
Accelerometer: Returns the acceleration force on three axes relative to the phone in 𝑚/𝑠2. The axis orientations are shown in Figure 2-1. This measurement the contribution of gravity on the measurements. This sensor is commonly used to detect screen rotation or enhance games. It can be also be used to detect when a user is in motion, or perform more complex inferences, such as detecting the number of steps taken by a user.
Figure 2-1: Coordinate system used by the Android SensorEvent API [12]. Barometer: The barometer measures atmospheric pressure. This can be used to estimate altitude without using the phone’s GPS or to detect weather changes. Bluetooth: The Bluetooth radio communicates with bluetooth devices, such as a wireless headset. This can be used to detect the aforementioned Tile app in sec-tion 1.2.2 or other Bluetooth low energy devices, such as the Estimote iBeacon [9]. These beacon devices can placed in strategic locations to perform more accurate in-door location tracking, or they can just be used to add mobile awareness to physical locations.
Camera: The camera can be used to take pictures, videos, or scan QR codes and other types of barcode images. The photos taken by the camera can provide infor-mation of interest to other users and can be sent to subscribers in their raw form. Another interesting use case would be to detect what locations QR codes have been scanned at and with what frequency. With some data processing, we might be able to use images to determine time of day, whether a user is indoors or outdoors, or detect landmarks.
Detected Activity: The DetectedActivity class infers what type of motion the phone’s user is experiencing, such as: in a vehicle, walking, biking, or not moving [10]. The detected activity also comes with a confidence value.
Light: The light sensor measures illuminance in lux and is generally used to deter-mine the brightness of a user’s surroundings in order to control screen brightness.
With conference rooms, library rooms, or other public places that contain tablets for reserving the space, this could be used to remotely infer whether a room is actually in use or not.
Linear Acceleration: This sensor provides acceleration on three axes without the influence of gravity. The removal of gravity makes it easier to isolate the relevant part of a user’s acceleration, for example, if you would like to determine a user’s driving patterns with regards to starting and stopping.
Location/GPS: The Android LocationManager provides the geographic location of a user with latitude and longitude and can estimate the speed of the user. It utilizes the phone’s built-in GPS and the Android Network Location Provider, which uses cell tower and Wi-Fi signals to determine location. This location tracking does not have enough detail to perform accurate indoor positioning.
Microphone: The microphone is commonly used for phone calls and recording sound in videos. It could also be used for volume detection, or with the addition of speech processing, it could be used to detect languages, recognize certain words, or interpret emotion.
Proximity: The proximity sensor determines how close the screen of the device is to an object and is commonly used to detect if a face is near the screen (e.g. if the user in a phone call). An interesting use case could be to infer whether a user is on their phone while driving.
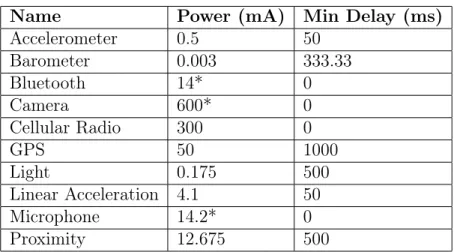
The following table displays the power profile values of each sensor in its active state given in terms of current. We also provide the minimum delay allowed between two sampling events in milliseconds, for sensors that support continuous or on change reporting. Values are reported from the Nexus device as provided by the Sensor API, except where starred values which were provided by the Android open source project [11].
Name Power (mA) Min Delay (ms) Accelerometer 0.5 50 Barometer 0.003 333.33 Bluetooth 14* 0 Camera 600* 0 Cellular Radio 300 0 GPS 50 1000 Light 0.175 500 Linear Acceleration 4.1 50 Microphone 14.2* 0 Proximity 12.675 500
Table 2.1: Power profile value and minimum delay between samples for Nexus 4 sensors.
2.3.2
Mobile Device Limitations
One of the most significant limitations of smartphones is their limited battery power. The Nexus 4 device has a 2100 mAh capacity battery, which provides an average of 15 hours of talk time. By using mobile phones as a the main publisher in our proposed system, our frequent usage of sensors and Wi-Fi to transmit data will put a considerable load on the battery. In our proposed framework, we will need to optimize our sensor and Wi-Fi usage for battery life, which is discussed further in Chapter 3.
From the power values of the sensors listed above, we can calculate battery expen-diture given our usage of each sensor. To estimate battery drain for a given sensor, the provided current should be multiplied by the time that the sensor was active for. This results in a mAh value, which is then comparable to the given mAh battery capacity. This computation is simplified, as there is also the cost of sensor usage waking up the parent application, causing extra battery drain through CPU cycles.
The other significant limitation of most mobile phones is Internet access. Users who do not have an unlimited data plan have limited 3G or 4G access. When the user has expended their access, they can connect to the internet via Wi-Fi; however, this depends on the availability of public Wi-Fi access points. In our evaluation of the framework, we make the assumptions that users have perfect wireless coverage through their data plan and have limited data usage available. Thus we must also
Chapter 3
System Architecture
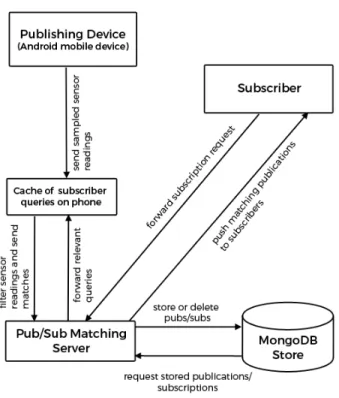
The system proposed in this paper provides a content-based publish-subscribe plat-form geared towards allowing subscribers to receive to relevant data from physical sensor readings. The system architecture is outlined in Figure 3-1.
3.1
Matching server
The publish-subscribe matching server provides endpoints to accept publications from mobile device publishers and subscription requests, or queries, from subscribers. In order to have a push-based system where subscribers passively receive notifications and publishers receive updates, the server will maintain socket connections with both active publishing devices and subscribers.
The matching server uses a content-based approach, thus subscriptions specify what publications they want to receive by defining queries over the publication at-tributes of interest. For example, a user might be interested in receiving updates when a friend is in the nearby area and subscribe to this event with a query that specifies a geographic region and a particular publisher.
Both queries and publications are stored server-side using MongoDB, a JSON document store. The server performs matches with each incoming publication and all stored queries and forwards relevant publications back to subscribers through the socket connections. The efficiency of the server-side matching of queries and subscriptions is not considered in the scope of this paper.
3.1.1
User Roles: Publishers and Subscribers
In this system, Android mobile phones are the main publishing devices, though any smart device with sensors could also interact with this system. Each device is assigned a unique integer ID, which is used to identify its subscriptions or publications.
Publishers periodically sample for sensor readings, such as location data or ac-celerometer data in the case of Android phones, and send these readings to the matching server as publications. The content of the publication is determined by the subscriptions for that device. For example, if subscribers request acceleration data, the publication should contain the accelerometer readings.
Subscribers can be any device with Wi-Fi capabilities but are most commonly expected to be other mobile phones or computers. Subscribers submit or remove queries to specify what publication data they would like to receive.
3.1.2
Publication/Query Language
Queries and publications are specified in Javascript Object Notation (JSON). This notation allows us to structure detailed documents and is easy to work with given the other technologies chosen for implementation, including socket.io, Node.js, and MongoDB.
Queries are structured using the same notation as specified by the MongoDB query language. Simple equality query predicates are represented with key-value pairs and more complex statements can be made using comparison or logical operators, such as $lt or $and respectively.
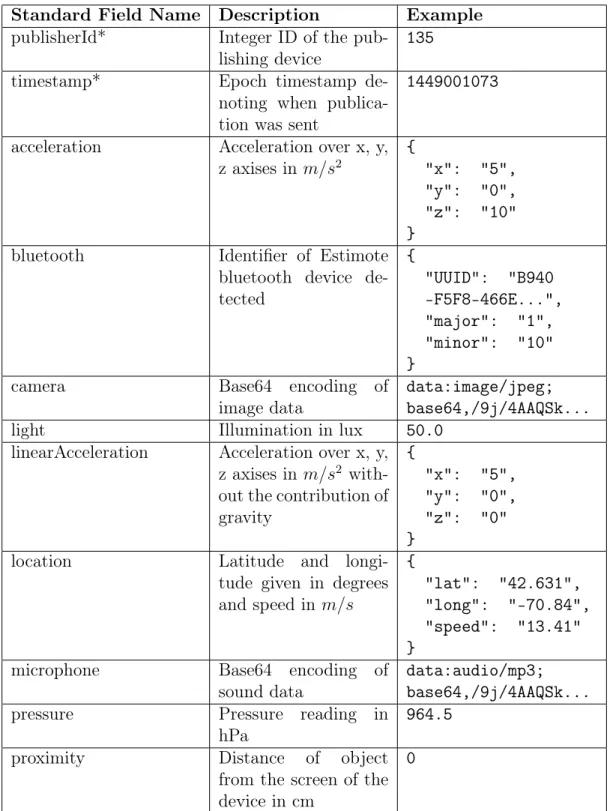
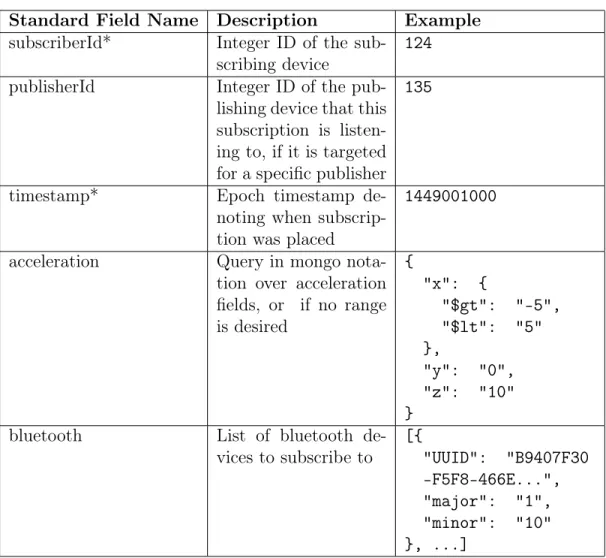
A publication consists of a single JSON document with key-value pairs repre-senting each attribute, including a timestamp and mobile id to uniquely identify the publishing device. Each sensor reading or other data point is represented as a key-value pair. The fields of a subscription also signify what attributes the subscriber wants returned. For example, if the subscriber is listening for acceleration data as part of the publication but does not have a specific range of data that it is looking for, the query should include the key-value pair: "acceleration: {}". In Tables 3.1 and 3.2, we show the format for required fields of publications and subscriptions respectively and include examples of what fields might look like for common sensors.
Neither type of document is limited to the fields in Tables 3.1 and 3.2; developers can define custom fields by adding arbitrary fields to either document. This extensi-bility allows the system to support other sensors not considered below or support the usage of arbitrary non-sensor data streams. For example, an application may want to process sensor data before publishing it, such as averaging readings over a window of time. The application can define an arbitrary field name and publish the processed data under that name. As long as subscriptions also have the same custom field name, the publish-subscribe server will perform matching based on these attributes.
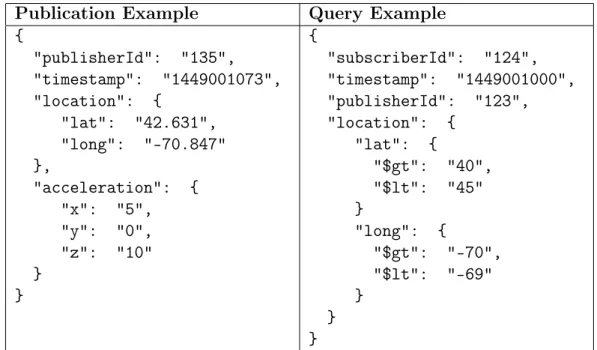
We also provide an example of a publication and query document in Table 3.3. The example publication contains a sample location and accelerometer reading from a publisher with the ID "135". The example query subscribes to documents from the
user with ID "135" when the location is within the lat-long range (40,-70) to (45, -69). Timestamps are given in epoch format, and in the above scenario, the query was received before the example publication. In this case, the example publication would be captured by the given query, and the matching server would forward the document to the subscriber with ID "124".
Standard Field Name Description Example publisherId* Integer ID of the
pub-lishing device
135 timestamp* Epoch timestamp
de-noting when publica-tion was sent
1449001073
acceleration Acceleration over x, y, z axises in 𝑚/𝑠2 { "x": "5", "y": "0", "z": "10" }
bluetooth Identifier of Estimote bluetooth device de-tected { "UUID": "B940 -F5F8-466E...", "major": "1", "minor": "10" }
camera Base64 encoding of image data
data:image/jpeg; base64,/9j/4AAQSk... light Illumination in lux 50.0
linearAcceleration Acceleration over x, y, z axises in 𝑚/𝑠2 with-out the contribution of gravity { "x": "5", "y": "0", "z": "0" }
location Latitude and longi-tude given in degrees and speed in 𝑚/𝑠 { "lat": "42.631", "long": "-70.84", "speed": "13.41" }
microphone Base64 encoding of sound data
data:audio/mp3; base64,/9j/4AAQSk... pressure Pressure reading in
hPa
964.5 proximity Distance of object
from the screen of the device in cm
0
Table 3.1: Standard fields for publication documents where starred items denote required attributes.
Standard Field Name Description Example subscriberId* Integer ID of the
sub-scribing device
124 publisherId Integer ID of the
pub-lishing device that this subscription is listen-ing to, if it is targeted for a specific publisher
135
timestamp* Epoch timestamp de-noting when subscrip-tion was placed
1449001000
acceleration Query in mongo nota-tion over acceleranota-tion fields, or if no range is desired { "x": { "$gt": "-5", "$lt": "5" }, "y": "0", "z": "10" }
bluetooth List of bluetooth de-vices to subscribe to [{ "UUID": "B9407F30 -F5F8-466E...", "major": "1", "minor": "10" }, ...]
Table 3.2: Standard fields for subscriptions where starred items denote required at-tributes.
Publication Example Query Example { "publisherId": "135", "timestamp": "1449001073", "location": { "lat": "42.631", "long": "-70.847" }, "acceleration": { "x": "5", "y": "0", "z": "10" } } { "subscriberId": "124", "timestamp": "1449001000", "publisherId": "123", "location": { "lat": { "$gt": "40", "$lt": "45" } "long": { "$gt": "-70", "$lt": "-69" } } }
3.2
Client-side Optimization Techniques
In this section, we describe several optimizations that can be applied to the system described above. Because optimizations for content-based publish-subscribe systems have been thoroughly researched, we focus on techniques that can be employed on the mobile device, namely reducing unnecessary data collection and transmission.
3.2.1
Forwarding Query Unions to Publishers
Query forwarding involves combining all queries pertaining to a given publisher into a compact and searchable format on the publish-subscribe server and forwarding this data to the publishing device. The forwarded compilation of queries will be referred to as query unions. It is necessary for the mobile publisher to have access to the query union in order to use the two optimization techniques described in the following two sections, publication filtering and smart sensor sampling. In section 3.3, we propose different formats for the query union and an efficient way to maintain unions for each publisher using query indexes.
All queries in a union must apply to a single publisher. Because queries do not have to specify a unique publisher to subscribe to, it is possible for the same query to end up in multiple unions. If the query subscribes to all publishers, it would need to be included in the query union of each publisher in the application.
When subscribers join or leave, the query unions forwarded to publishers may become outdated, raising the question of how often updated query unions should be forwarded to publishing devices. Sending updates too frequently could add an additional overhead especially if the query union has not actually changed, but failing to send updates quickly enough could result in the publishing device failing to send pertinent data.
When a subscriber removes its subscription, it is less important to send updated query unions immediately, as the cost of the update is probably higher than the expected gain of preventing data from being sent, given that it is likely there is another user already listening for similar data points. On the other hand, if a new
subscriber joins with a query that changes the query union, it would be ideal to forward the new unions to publishers immediately in order to keep accuracy high.
3.2.2
Publication Filtering
In order to prevent unnecessary matching of publications and queries on the publish-subscribe server, the publishers should avoid sending documents with data that no subscribers are interested in. This saves the publisher from needing to make a wireless connection to send data and reduces the matching load on the publish-subscribe server.
Given that publishers maintain query unions as described above, they can perform pre-filtering on each sampled data point by checking if it is captured by the query union in order to find out whether the data is relevant to any subscribers. It will only send captured data to the server.
3.2.3
Smart Sensor Sampling
A second client-side optimization technique is for the publishing device to take sensor samples efficiently. The forwarded query allows publishers to see what sampled data is relevant to subscribers so that devices can sample less frequently when the sensor readings are not in the region of interest. The device can also slow down sampling frequency if the sensor measurements are not changing.
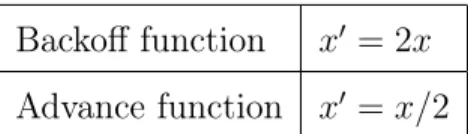
In order to adjust the phone’s sampling rate, we will use a linear backoff strategy. If the results of the samples are not captured by the stored query union, sensors will increase the interval between samples given the backoff strategy shown in Table 3.4. If the reading is captured by the query, the sensor should decrease the interval between samples using the given advance function. For this strategy to work, we must also specify a minimum and maximum interval between samples in order to apply bounds, such that the backoff strategy does not cause extreme delays between samples or increase the rate to an unreasonably high frequency.
Backoff function 𝑥′ = 2𝑥 Advance function 𝑥′ = 𝑥/2
Table 3.4: Backoff and advance functions for exponential duty cycling, where x’ is the length of the new interval between samples and x is the length of the previous interval.
For each type of sensor, there is a minimum interval dependent on hardware limitations. The maximum interval that can apply to all sensors may vary between different applications depending on how critical accuracy is. In a medical situation, where doctors might be subscribed to their patients’ vitals, the minimum sampling rate may be much higher than a scenario where mobile users are subscribed to their friends’ locations.
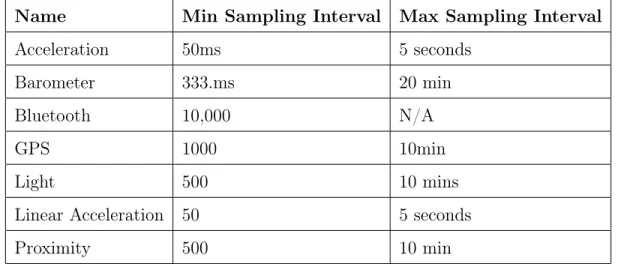
In Table 3.5, we give sample values for minimum and maximum intervals between samples. The maximum value depends on how long the application is willing to wait before receiving an update. We give examples of how these values were derived for some of these cases. For some sensors, a maximum interval can be derived by taking the average rate of change of the physical phenomena, determining the delta of the value that we are willing to accept before being updated, and calculate the interval by taking the delta divided by the rate of change.
For example, if the average rate of movement of a phone is 10mph, and we wish to be alerted by the time a user has moved one mile, the maximum interval between samples should be 10 minutes. Similarly, for acceleration, if the average acceleration is from 0 to 100 km/h in 60 seconds and we wish to be alerted by the time there has been a change of 10 km/h, the maximum interval would be 6 seconds. Lastly, for the barometer, pressure can change at a rate of 10 hPA/3 hours. In order to guarantee notification once there has been a change of 1 hPA, the max interval should be 20 minutes.
For other sensors, considering average rates of change may not be as applicable. For example, illuminance can change at a certain physical rate, but we may not necessarily want to be checking for light changes often, as this depends more on user
behavior, which can be unpredictable. The rate of light changes can be different for a user who spends most of the day indoors versus one who constantly moves from indoors to outdoors. In this case, the maximum interval purely depends on how long the subscriber is willing to wait before receiving an alert. In this case, rate of change doesn’t mean too much.
Name Min Sampling Interval Max Sampling Interval Acceleration 50ms 5 seconds
Barometer 333.ms 20 min
Bluetooth 10,000 N/A
GPS 1000 10min
Light 500 10 mins
Linear Acceleration 50 5 seconds
Proximity 500 10 min
Table 3.5: Example values for minimum and maximum intervals between samples for each sensor type.
In general, the backoff strategy may only work well with sensors whose readings cannot change quickly, such as location or temperature. In the case of acceleration, readings may change too quickly for this strategy to be viable.
In Figure 3-2, we show a graphical example of how smart sensor sampling will behave. In this scenario, the phone’s user is travelling along a path denoted by the arrow. The forwarded query is denoted by the shaded rectangle, and each black circle shows where a sample is taken. Segment A is longer than the previous segment be-cause the previously sampled point was not captured by the query, thus the sampling mechanism waits for a longer period before sampling again. The pause between sam-ples continues to increase until segment B, where the previously sampled point was captured by the query. Segment C demonstrates the minimum interval between sam-ples. Each following interval is the same length until segment D, when the samples are again out of range of the query, and the technique backs off again.
Figure 3-2: Demonstration of smart sensor sampling along a path where each point represents a sample, and the shaded rectangle represents a region contained by a query.
3.3
Maintaining a Query Index
In order to forward query unions to publishing devices, the matching server must aggregate all pertinent subscriptions that apply to each publisher. To efficiently maintain and update this combined query, the server must have a data structure to make it easy to add or remove subscriptions from the query union. Similar to a database index, this index would ideally allow us to find pertinent queries in a more efficient manner than iterating over every stored query.
The index should allow the addition or removal of queries and support the com-pilation for a query union for forwarding. This structure should also maintain which queries apply to each publisher. The general API for the query index would be as follows:
∙ Insert query ∙ Delete query
∙ Compile a query union
∙ Each type of query union should be able to return whether it captures a given data point
Several data structures are proposed as representations for a query index. The data structures that are explored in this thesis are hash tables, R* trees, and bloom filters. Below, we describe how each of these structures will be used as a query index, how queries are inserted and deleted, and what the corresponding query union format is.
Hash Tables
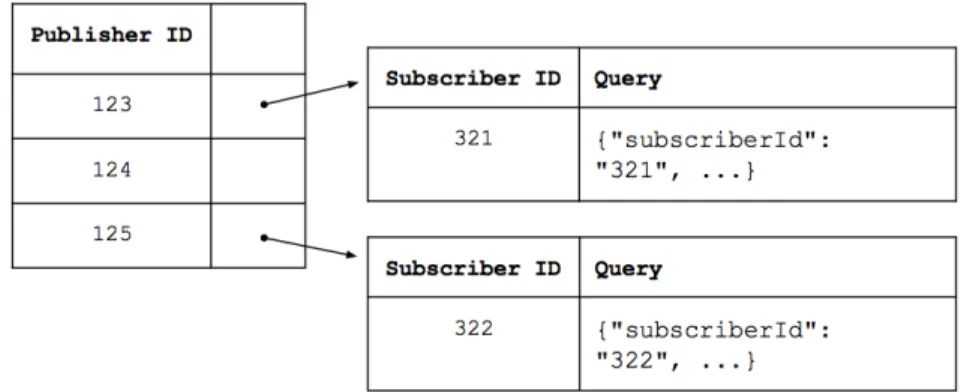
Structure: Each application owns a hash table which organizes all of the queries for applying to each publisher. As shown in Figure 5, each key in the table repre-sents a publisher in the application, and the corresponding value is a reference to another table containing a summary of queries for that publisher. The keys in the query summary table represent each subscriber and the values are the corresponding subscription.
Figure 3-3: Structure of the hash table based query index.
Inserting and Deleting Queries: When a new subscription is added, the server must to find each applicable publisher and add the new query to that publisher’s query summary table. Deletion would require iterating over each publisher and checking if the query exists for that publisher and removing it if it does exist.
Compiling a Query Union: In order to compile a query union for a subscriber, the system would need to iterate over the subscriber’s list of queries to generate a
summary of the unique ranges for each attribute in the queries as shown by the pseu-docode in Figure 3-4. This document can be transmitted to the publishing device as a JSON document.
QUERY-UNION (S) union = {}
for query in query_index [S]: for attribute in query:
if query.attribute.range not in union[attribute]: union[attribute] += query.attribute.range
Figure 3-4: Pseudocode demonstrating how a query union is generated for a hash table based query index, where S is the subscriber ID.
Performance Notes: Using hash tables could work well on a small scale where there are few unique intervals represented amongst the queries. However, if each publisher has a large base of subscribers, it would be inefficient to iterate over each subscription in order to recompile the union. Also, if a query applies to multiple subscribers, this mechanism would need to add the query to the index multiple times.
R-trees
Structure: In a given application, for each query union that is compiled, there should be a corresponding R-tree that stores all of the queries in that union. R-trees are balanced search trees that allow indexing of multidimensional data, allowing us to store queries, which are essentially ranges or points specified on each attribute. An example of the structure of an R-tree based query index is given in Figure 3-5. In the spatial representation, each field in the query is represented by a different dimension. For the example below, the queries cover two attributes, latitude and longitude, so the space represented by the tree is two dimensional.
Figure 3-5: Example of a query index backed by an R-tree.
Inserting and Deleting Queries: The insertion of a query into the index would be equivalent to inserting the necessary points, segments, rectangles, etc. into the R-tree that are needed to represent each predicate of the query. Deletion would involve re-moving each of the objects representing that query; given that the server maintains a table relating subscribers to their respective queries, in order to remove a query from the index, we would look up the original query, perform the same process of breaking it down into its predicates to find its location in the R-tree, and then remove the final node from the tree.
Compiling a Query Union: We can can transmit this index to the mobile device, by serializing the data structure and sending this byte sequence to the publishing de-vices. The publishers will deserialize the R-tree into an object and be able to search the structure in order to find out whether the data points that it senses are captured by the query union or not.
Performance Notes: The overhead of using R-trees might not be cost-effective if the number of subscribers per publisher is small. It also has the same space-efficiency issue as using hash tables of potentially needing to store the same query in multiple
R-trees.
Layered Bloom Filters
The last proposal for an index structure is a layered bloom filter. Bloom filters store information in bit arrays, by applying several different hash functions an element in order to map it to several indices in the array, and can have multiple layers in order to store more than one copy of an element. They can be made to be space-efficient by simply making the bit array shorter, meaning that the hash functions must output to a smaller range. The tradeoff for this space-efficiency is the higher probability of having false positive matches, or for the bloom filter to believe that it contains an object that were never added.
Structure: In order to check whether an element exists in a bloom filter, the exact element is hashed by the set of hash functions, and if the bits at the resulting indices are non-zero, the element exists. The server would maintain one bloom filter for each attribute in the query union pertaining to each publisher in an application. In Figure 3-6, we give an example of subscriptions stored in a bloom filter based query index. This filter only has one hash function, which takes the product of the subscription’s latitude and longitude and mods this by ten.
Inserting and Deleting Queries: Because it is impossible to store a range in a bloom filter and check whether a discrete value falls in that range, we will only store elements representing short ranges of values. Thus, to store the predicate of a query that asks for a range of values, we would insert several elements, each of which is an interval in that query range.
𝐻(𝑥) = (𝑙𝑎𝑡 * 𝑙𝑜𝑛𝑔) 𝑚𝑜𝑑 10
𝐻(𝑥) = (42.4 * −71.1) 𝑚𝑜𝑑 10 = 0 𝐻(𝑥) = (42.6 * −71.1) 𝑚𝑜𝑑 = 4
Figure 3-6: Example of a bloom filter based query index.
Compiling a Query Union: To forward the query union to the publisher, we will transmit the bloom filter to the publishing device. We also must forward metadata that represents the interval syntax used in the filter. For example, in Figure 8, the metadata would state that the interval count begins at 0 degrees and is spaced at 0.1 degrees. For the publisher to check whether its sampled sensor measurement is captured by the query union, it must convert the discrete point into a standard short range, and check the bloom filter for the existence of this range.
Performance Notes: Bloom filters allow for compact storage of information, how-ever, its usage as described causes us to lose some resolution by essentially rounding all discrete values to short intervals.
Chapter 4
Evaluation
In this section, we perform an analysis of the three optimization techniques discussed previously. The goal of our analysis is to show that:
1. Query filtering effectively reduces the number of data transmissions that a mo-bile publisher must perform.
2. Smart sensor sampling reduces the number of irrelevant samples taken, which improves battery life.
3. The overhead of maintaining a query index is worth the combined benefits of query filtering and smart sensor sampling.
We use a pre-sampled data set to evaluate these optimizations in order to have a large enough pool of data to analyze. This data emulates sensor data that was sampled by mobile publishing devices, and using the sensor power ratings from Table 2.1, we can estimate battery usage given a sampling pattern. We implemented the advance and backoff strategy for the smart sensor sampling strategy and the query index structures in order to evaluate these strategies. Both implementations use Java, which is the development language for the Android platform. Specific details for the implementation of the query indexes is described further in section 4.3.2.
The pre-sampled data set is comprised of taxi location data for 1620 Boston taxis, with 254,913,020 data points in total. The samples span the time period from January 1, 2001 to November 16, 2012. Each row of the dataset includes the MAC address of
the taxi who delivered the data, the timestamp of when the data was sent, latitude and longitude of the taxi at that time, and the number of wifi data points sensed by the taxi at that location. Each taxi samples and transmits its location once per second, though some ranges of data are missing.
For this evaluation, we propose an application where users can subscribe to taxi stands at various locations and be alerted when a taxi approaches the stand. We identify several regions which are common pickup and dropoff locations in Boston as described in an article from BostonInno [13] and include a couple of other regions outside Boston which had a high number of taxis, including the Logan airport and the Kendall/Broadway area in Cambridge. These locations are shown in Figure 4-1 and their corresponding names are given in Table 4.1.
Figure 4-1: Map of Boston taxi hotspots.
4.1
Publication Filtering
To analyze the benefits of query filtering, we query the pre-sampled data set to find out how many data points are captured in the taxi hotspot regions denoted in Figure 4-1. Table 4.1 below lists the results in terms of the number of raw data points that were captured for each location and the percentage with regards to the total number of original data points sampled.
Location Total Data Points Percentage 1. Logan Airport 35752655 14.025% 2. Kendall Square 7129377 2.800% 3. Hynes Convention Center 195726 0.077% 4. Theater District 543146 2.131% 5. South Station 785937 0.308% 6. Faneuil Hall 304517 0.119% 7. Post Office Square 126200 0.050% 8. Back Bay T 420261 0.165% Total data points for all locations 45341990 17.787%
Table 4.1: Number and percentage of data points remaining when filtered per taxi hotspot region.
The bar chart below shows the percentages of data remaining after using publi-cation filtering for the top forty taxis with the most aggregate sampled data. It is clear from this, that the average amount of pertinent data per taxi is similar to the average over all taxi data given in the table above.
Figure 4-2: Percentage of data points filtered for top forty taxis with most data.
Query filtering clearly gives a performance boost by preventing unnecessary pub-lications if the data sampled is not pertinent to any queries. Depending on the query itself, the overall amount of data transmitted will be dependent on the specificity of the query. For example, if a subscription covers a larger area, more data is likely to be transmitted because it is more likely that the taxi will be in a region specified in the query. Thus, the benefits of query filtering vary based on the subscriptions in a given scenario.
Below, we perform a similar analysis on a single taxi in order to show the effects of query filtering over time. Rather than using MAC addresses to refer to the vehicles, we have assigned integer IDs to each taxi. This single car analysis is performed on "Taxi 52", which had the some of the most continuous data of the top ten vehicles with the most data sampled, meaning that there were few large gaps between samples. For the data points sampled by "Taxi 52", we run the query that checks when the taxi passed through a taxi hotspot and graph the total number of data points that are
captured by the query or not captured over time. Figure 4-3 below shows these results in the form of a stacked area graph, where the light blue area shows the amount of sampled data that was not captured while the dark blue region shows the amount of data that is relevant to the query. The y axis denotes number of data points, and the x axis denotes time from the period of January 2008 to October 2008. As described earlier, the original data set did not accurately sample once per second, thus the overall graph has peaks rather than a uniform line.
Figure 4-3: Query filtering results over taxi 52 from 1/2008 to 8/2008.
Because this graph covers a large span of time, the data is highly compressed and does not give us the best idea of how query filtering behaves over time. We focus in on a shorter span of time region to see how the optimization behaves from minute to minute. In the following figure, we show a similar stacked graph of whether the data points sampled would have been transmitted or not. This closeup view, shows that of the data sampled, there is a period of time where the taxi senses relevant data rather than a constant amount of data over time that remains relevant. Overall, query filtering successfully reduces unnecessary transmission of data.
Figure 4-4: Taxi transmission data for 1/7/2008 from 2AM to 8:30AM.
4.2
Smart Sensor Sampling
In this section, we perform an analysis on whether our smart sampling optimization successfully reduces the number of samples taken by the publisher and improves battery life by using less active sensor time.
Using the exponential backoff and advance scheme, we emulate duty cycling of the GPS for taxi 52 given the same taxi hotspot query. The minimum and maximum time intervals between sensing are one second and 10 minutes. The stacked area chart shows the results where the red shades show the data points that would have been sampled by smart sensor sampling and the blue shades show data points that would not have been taken. Lighter shades represent points that were not captured by the query and darker shades show points that would have been captured. The number of points taken by smart sensor sampling that were not captured by the query are very low, thus it is difficult to distinguish this color in the graph.
Figure 4-5: Breakdown of smart sensor sampled data points for Taxi 52. In Figure 4-6, we show a minute to minute chart with the results of smart sampling. We observe that smart sampling results in a sample taken approximately every 10 minutes until the window of time where the taxi enters a hotspot region. Within 10 minutes, the smart sampling behavior recognizes that the data captured is now relevant to the query, and it quickly backs off its sampling frequency when the data becomes irrelevant. Lastly, there were two short peaks where the taxi was within the hotspot region but this was missed by smart sampling, because the sampling strategy was not fast enough to react and capture these small, isolated regions.
Figure 4-6: Taxi 52 transmission data for smart sampling on 1/7/2008 from 2AM to 8:30AM.
The chart in Figure 4-7 shows the percentage of data that was smart sensor sampled or not, and whether the data was captured by the query or not.
Figure 4-7: Smart sampling percentage of data filtered for Taxi 52.
In total, 17,250 data points were in the original data set over our given span of time. 2614 of those points were smart sampled, where 26 of those samples were not captured by the query. 557 are captured by the query but missed by smart sampling. This gives an 82.29% accuracy rate for smart sampling captures of relevant data and a 0.99% rate of capturing unnecessary data.
In order to perform a battery analysis, we use the number of samples taken to estimate how long the phone sensor would have been active for. Given that 2614 samples were taken by smart sampling, this would equate to 2614 seconds that the GPS would be active for, or 0.726 hours. The Android Nexus 4 GPS has a 50mA power rating, totalling to 36.31 mAh consumed as opposed to 239.58 mAh with the original sampling scheme. The battery capacity is 2100 mAh, so the smart sampling scheme would consume 1.73% rather than 11.41% of the battery’s life.
4.3
Query Indexes
In order to perform query filtering and smart sensor sampling, the publishing device must store a local query union of what all of its subscribers are listening for, and the query index aids in making it efficient to compile this query union. In this section, our analysis aims to find whether the cost of using query indexes exceeds the benefits of query filtering and smart sensor sampling. We also provide some analysis on how efficient it is for the phone to use the query index to check if a data point is captured by a query or for the server to add or remove queries from the index. Lastly, we propose several generic scenarios that describe range distribution of queries and discuss whether each index type is expected to perform well.
4.3.1
Size of Query Index During Transmission
Continuing with our taxi hotspot scenario, we estimate the size of each type of query index (hash tables, R-trees, and layered bloom filters) that would need to be trans-mitted to the publishing devices. In order to perform this estimation, we gauge how many taxi riders there are in Boston. From this article by the Boston Globe [14], we estimate that there are approximately 13.6 million riders per year. This comes down to 37,260 riders per day, and if we assume that most riders take cabs outside of the early morning hours of 12AM to 6AM, this comes out to 2192 riders per hour.
We consider the amount of time that a single rider would wait for a taxi, which would be the amount of time that they would place their subscription for. The rider would put in a subscription until their request for a taxi is fulfilled, in which case they would remove the subscription. We estimate this amount of time to be 15 minutes. The average size of a query index at any given time would be the number of riders per quarter hour, which is approximately 500 queries large. For each of the proposed query index types, we estimate the size of the transmitted data for each option. We also will assume that indexes are retransmitted every minute, which is a reasonable amount of time for a rider to wait for a response from the app.
Hash Tables: When using hash tables as a query index, we transmit updated query unions to the publishers by compiling the unique intervals of the stored queries. The publishers must iterate over this list of intervals to check if the data point is captured by the query union. Given the hypothetical scenario presented above, where all users are only interested in the eight hotspot locations, the compiled query transmitted would be 791 bytes (0.000791MB) in the format we specify, for the 8 regions we de-fine in our query.
R-trees: We used a serializable Java implementation of 2D R-trees [15], to test how large the serialized R-tree would be in this scenario. We added 500 rectangles, each of which denotes one of the taxi hotspot regions. They were added in the same ratio as the frequency at which taxis drive through those regions as seen in Table 4.1. The resulting serialized tree came out to 28.44 kilobytes of data.
Bloom filters: We used an open source Java implementation of bloom filters [16] in order to test the approximate size of the filter in this scenario. Using the amortized equations for performance below, we derive parameters with which to initialize the bloom filter [17]. The equations allow us to calculate the size m of the bit array needed to store n elements with an error rate of p, and the number k of hash functions needed.
𝑚 =
⌈︂
𝑛*𝑙𝑜𝑔(𝑝)
𝑙𝑜𝑔(
1.0 2𝑙𝑜𝑔(2.0))
⌉︂
Figure 4-8: Calculation for estimating the necessary size of a bloom filter.
𝑘 =
⌈︁
𝑙𝑜𝑔(2.0) *
𝑚𝑛⌉︁
Figure 4-9: Calculation to estimate how many hash functions are needed. To store 500 entries with a 1% error rate, we need k=7 hash functions. To test if these parameters yield a bloom filter with appropriate error rates, we empirically tested this setup using the the bloom filter implementation. We inserted 500 regions
into the bloom filter where the distribution of the regions followed the four different distribution scenarios described in Figure 4-10. We then checked for false positives where the bloom filter would return true for a region not actually contained in the filter. Though the results shown below in Table 4.2 are not perfectly representative of exact error rates, it is clear that the overall false positive rate is low. The size of the bloom filter was 52500 bits, where each entry was represented by 21 bits.
Total Tests # of False Positives Rate of False Positives
Scenario 1 7500 0 0%
Scenario 2 8108 1 0.0123% Scenario 3 8143 2 0.0245% Scenario 4 7532 1 0.0133%
Table 4.2: Power profile value and minimum delay between samples for Nexus 4 sensors.
Comparison to No Optimizations: We compare the benefits given query indexes to not perform any optimization techniques and sent one publication per second. Each publication for this scenario would be about 99 bytes. If every taxi were to transmit a publication once per second from 7AM to 12PM, this would result in 183.6MB of data sent per month.
Clearly, no usage of query indexes will outperform the no optimizations case, unless query unions are re-transmitted to the publishers at a slower pace than once per second. For each type of query index, the maximum rate at which we can resend the union in order to perform at the same level in terms of data sent is:
∙ Every 8 seconds for a hash table based index ∙ Every 5 minutes for an R-tree based index ∙ Every 90 seconds for a bloom filter based index
In the case of the taxi stand application, both the hash table and bloom filter indexes would likely update query unions quickly enough to maintain a usable
ap-plication for users. A five minute delay in feedback would make the application impractical.
Because these results are very specific to the presented scenario, sections 4.3.2 and 4.4 discuss how the optimizations might behave in other cases. For example, if the publication size were much larger because each one contained an image or sound file, any type of query index would be more beneficial than sending publications once per second.
4.3.2
Efficiency Analysis of Query Union Search
In the diagram below, each gray box represents the range of data that a publisher might produce, and the black boxes represent individual ranges covered by subscriber queries. We discuss how the different distributions covered by the queries affects the performance of each of our proposed optimizations.
Figure 4-10: Different types of data distribution.
For the query union of each index type and distribution scenario above, we mea-sured the CPU time to search the index 10 million times in order to find an average CPU usages for searching the query union. For each search, we check whether a given point is captured by the query union.
![Figure 2-1: Coordinate system used by the Android SensorEvent API [12].](https://thumb-eu.123doks.com/thumbv2/123doknet/14326098.497836/25.918.357.568.105.362/figure-coordinate-used-android-sensorevent-api.webp)