A COMPARATIVE STUDY OF OCCUPATIONAL ACCIDENTS IN THE CONSTRUCTION INDUSTRY:
CASE STUDIES OF THE JAPANESE AND THE U.S. CONSTRUCTION INDUSTRIES
by Hirofumi Kasa
B.E., Department of Civil Engineering The University of Tokyo, Tokyo, Japan
(1986)
M.E., Structural Engineering and Construction Division Asian Institute of Technology, Bangkok, Thailand
(1988)
Submitted to the Department of Civil and Environmental Engineering in Partial Fulfillment of the Requirements for the Degree of
MASTER OF SCIENCE in Civil and Environmental Engineering
at the
MASSACHUSETTS INSTITUTE OF TECHNOLOGY May 1996
0 1996 Hirofumi Kasa. All rights reserved.
The author hereby grants to MIT permission to reproduce and to distribute publicly paper and electronic copies of this thesis document in whole or in part. Signature of the author
D•fartment of Civil and Environmental Engineering May 10, 1996
Certified by_
John B. Miller Thesis Supervisor Assistant Professor of Civil a"r Environmental Engineering
Accepted by
. _v Joseph M. Sussman Chairman, Departmental Committee on Graduate Studies M,,ASAC;HUSETTS INSTITUT'U'E
OF TECHNOLOGY
JUN 0 5
1996
A COMPARATIVE STUDY OF OCCUPATIONAL ACCIDENTS IN THE CONSTRUCTION INDUSTRY:
CASE STUDIES OF THE JAPANESE AND THE U.S. CONSTRUCTION INDUSTRIES
by Hirofumi Kasa
Submitted to the Department of Civil and Environmental Engineering on May 10, 1996 in Partial Fulfillment of the Requirement for the Degree of Master of Science in Civil and Environmental Engineering.
Abstract
Occupational safety is of great concern in the construction industries internationally due to financial losses, losses of human resources, legal liabilities, and moral responsibility. This thesis examines occupational accidents in the Japanese and the U.S. construction industries and compares management and measures implemented for occupational safety in each construction industry.
The thesis is composed of four parts. First, the thesis overviews the construction industry in Japan and the U.S., and specifies construction practices in the two countries. Second, the thesis examines the statistics on occupational accidents in the Japanese and the U.S. construction industries and reveal characteristics of occupational accidents in these two construction industries. The examination focuses on the number of occupational injuries and fatalities, the distribution of the injuries and fatalities by size of construction establishments and by age of construction workers, and so on. Third, the thesis discusses and compares the approaches to occupational safety of these two construction industries. The discussion includes incentives for safety, regulations and ordinances, governmental agencies, working conditions, labor management and relations, and safety education and training The comparison clarifies the advantages and disadvantages of their approaches. Based on the comparative analysis, the final section presents conclusions and recommendations for more effective safety control and management in the Japanese and the U.S. construction industries.
The thesis concludes with some findings including: (1) some characteristics of occupational accidents are common to the Japanese and the U.S. construction industries and others are different between them; (2) each industry has different incentives for occupational safety; (3) the scope of governmental administration is less expansive in the U.S. than in Japan; (4) labor relations, contractual relationships among contractors, and working conditions influence the characteristics of occupational accidents; and (5) safety management and safety activities implemented in these two countries differ significantly. Thesis Supervisor : John B. Miller
Acknowledgment
The author wishes to express his profound gratitude and sincere appreciation to his advisor, Asst. Prof. John B. Miller, for his persistent guidance, invaluable suggestions, friendly discussion, and enthusiastic encouragement throughout the study.
The author would like to thank Mr. Hart, Mr. Cleary, Mr. Crockett, Mr. Fisher, and Mr. Yamada. Mr. Hart and Mr. Cleary, who work for a regional office of the Bureau of labor Statistics in Boston, gave the author valuable comments on occupational accidents in the U.S. Mr. Crockett, Mr. Fischer, and Mr. Yamada, who are currently engaged in the Central Artery/Tunnel project under construction in Boston, gave the author precious advice based on their practical experience of U.S. construction.
The author is indebted to Prof. Kunishima and Dr. Watanabe of the University of Tokyo, and Mr. Goshima of the Japan Industrial Safety and Health Association for their overseas assistance.
The author's appreciation is due to the Institute of International Education and the Japan-United States Educational Commission for the honorable Fulbright scholarship which gave great financial support to the author during his stay in the U.S. The author keeps this honor in his mind forever.
The author expresses his gratitude to his employer, Electric Power Development Co., Ltd. (EPDC) in Japan for the generosity EPDC gave the author to pursue and complete his study at Massachusetts Institute of technology.
Finally, the author is most grateful to his dearest wife, Yachiyo, for her invaluable support and affection throughout his study. He is also thankful to his families in Japan for their understanding and encouragement.
Table of Contents
Tittle ... ... 1...
A bstract... ... 2
A cknow ledgm ent... ... ... 3
Table of Contents ... ... .. ... 4
Table of Figures... ... ... ... .7
T able of T ables... ... . 11
C hapter 1 Introduction... ... ... ... .. ... ... 12
1.1 General Background ... ... 12
1.2 Occupational Safety in Construction... ... 12
1.3 Past Studies of Occupational Accidents ... ... 13
1.4 Objectives and Scope of Thesis ... ... 16
1.5 O utline of T hesis... ... 16
Chapter 2 Overview of the Japanese and the U.S. Construction Industries... 18
2 .1 G en eral ... 18
2.2 Japanese Construction Industry ... ... 20
2.2.1 General Description of the Industry... ... 20
2.2.2 Historical Background of the Industry... 25
2.2.3 Characteristics of Construction Practices ... 26
2.3 U.S. Construction Industry... ... 30
2.3.1 General Description of the Industry ... ... 30
2.3.2 Historical Background of the Industry... ... 35
Chapter 3 Analysis of Occupational Accidents in the Japanese and the U.S. Construction
Industries...
. 39
3.1 Definition of Occupational Accident ...
....
39
3.2 Occupational Accidents in Japanese Construction Industry ... 40
3.2.1 Historical Review ...
... 40
3.2.2 Statistics on Occupational Accidents in Japan ... 41
3.2.3 Indices of Occupational Accidents in Japan ... 42
3.2.4 Analysis of Occupational Accidents in Construction Industry...44
3.2.4.1 Current Situation of Occupational Accidents ... 44
3.2.4.2 Characteristics of Occupational Accidents ... 55
3.2.4.3 Summ ary ...
62
3.3 Occupational Accidents in the U. S. Construction Industry ... 64
3.3.1 Historical Review...
64
3.3.2 Statistics on Occupational Accidents in the U.S...66
3.3.3 Indices of Occupational Accidents in the U.S... 68
3.3.4 Analysis of Occupational Accidents in Construction Industry...69
3.3.4.1 Current Situation of Occupational Accidents ... 69
3.3.4.2 Characteristics of Occupational Accidents ... 79
3.3.4.3 Summary ...
87
Chapter 4 Comparison of Management of Occupational Safety: Japanese and the U.S. C onstruction Industry... 91
4 .1 G en eral ... ... 9 1 4.2 Management of Safety in the Japanese Construction Industry ... 91
4.2.1 Incentives for Safety ... . ... 91
4.2.2 Laws and Regulations for Safety...93
4.2.4 Working Conditions for Safety ... ... 97
4.2.5 Labor Relations and Labor Management for Safety... 101
4.2.6 Education and Training for Safety...106
4.2.7 D iscussion ... ... 107
4.3 Management of Safety in the U.S. Construction Industry ... 111
4.3.1 Incentives for Safety ... ... 111
4.3.2 Laws and Regulations for Safety... 13
4.3.3 Governmental Agencies for Safety...1...17
4.3.4 Working Conditions for Safety ... 19
4.3.5 Labor Relations and Labor Management for Safety... 122
4.3.6 Education and Training for Safety...127
4.3.7 D iscussion ... 127
Chapter 5 Conclusions and Recommendations ... 132
5.1 C onclusions ... ... 132
5.2 Recommendations ... 138
Table of Figures
Figure 1.1 A ccident Sequence... ... 14
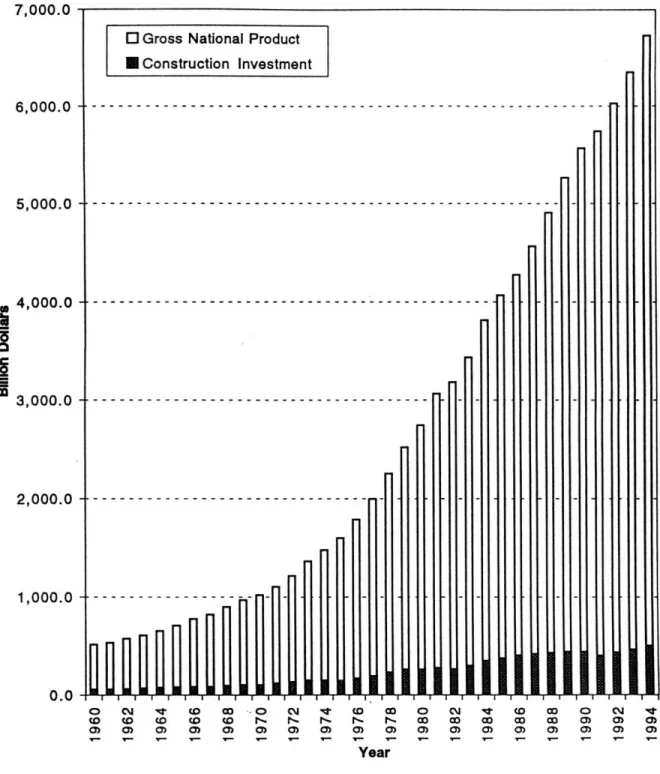
Figure 2.1 Comparison of Construction Investment with Gross National Product (GNP) in Jap an ... 22
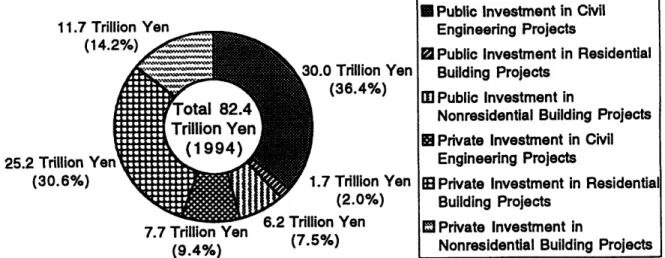
Figure 2.2 Breakdown of Japanese Construction Investment in 1994 (Projected)...23
Figure 2.3 Comparison of Employed Labor Force in Construction Industry with Total Labor Force in Japan ... ... ... 23
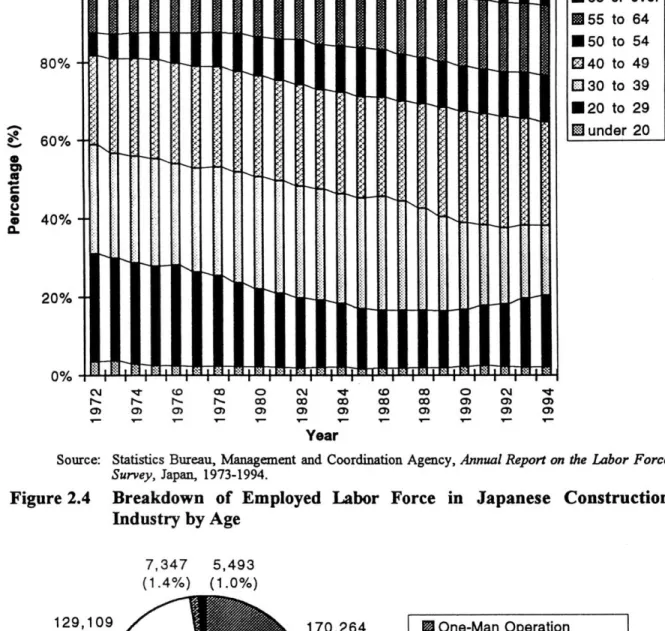
Figure 2.4 Breakdown of Employed Labor Force in Japanese Construction Industry by A g e ... 2 4 Figure 2.5 Breakdown of Licensed Construction Firms in Japan by Capital in 1994 ... 24
Figure 2.6 Contractual Relationships between Owner, Contractor, and A/E Consultant in the Japanese Construction Industry ... 30
Figure 2.7 Comparison of Construction Investment with Gross National Product (GNP) in the U .S ... 32
Figure 2.8 Comparison of Employed Labor Force in Construction Industry with Employed Total Labor Force in the U.S ... 33
Figure 2.9 Breakdown of the U.S. Construction Investment in 1994...33
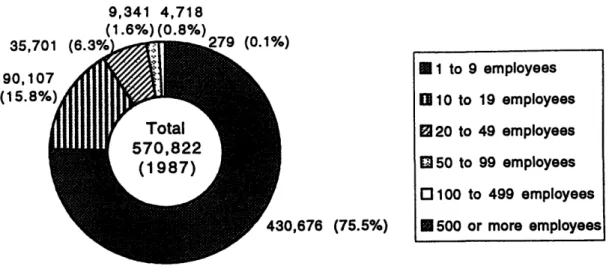
Figure 2.10 Breakdown of Construction Firms in the U.S. by Employment Size in 1994 ... ... .°. ,... ... ... 35
Figure 2.11 Contractual Relationship between Owner, Contractor, and A/E Consultant in the U.S. Construction Industry ... 38
Figure 3.1 Change in Number of Occupational Fatalities and Injuries in Japan...46
Figure 3.2 Change in Number of Occupational Fatalities in Japan ... 47
Figure 3.3 Change in Number of Grave Accidents in Japan...48
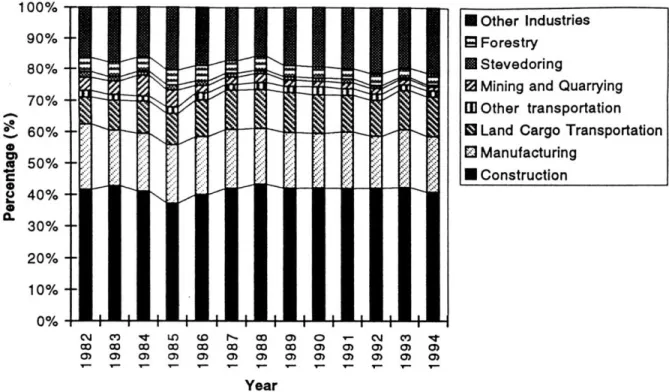
Figure 3.4 Change in Distribution of Occupational Fatalities and Injuries by Industry in Jap an ... 4 9 Figure 3.5 Change in Distribution of Occupational Fatalities by Industry in Japan...50
Figure 3.6 Change in Distribution of Grave Accidents by Industry in Japan...50
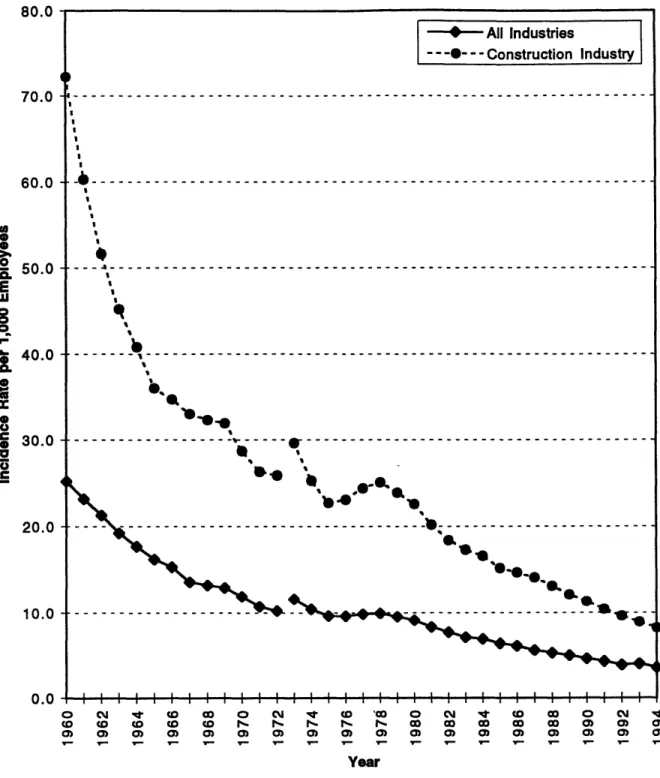
Figure 3.7 Change in Incidence Rates per 1,000 Workers Employed in Japan...52
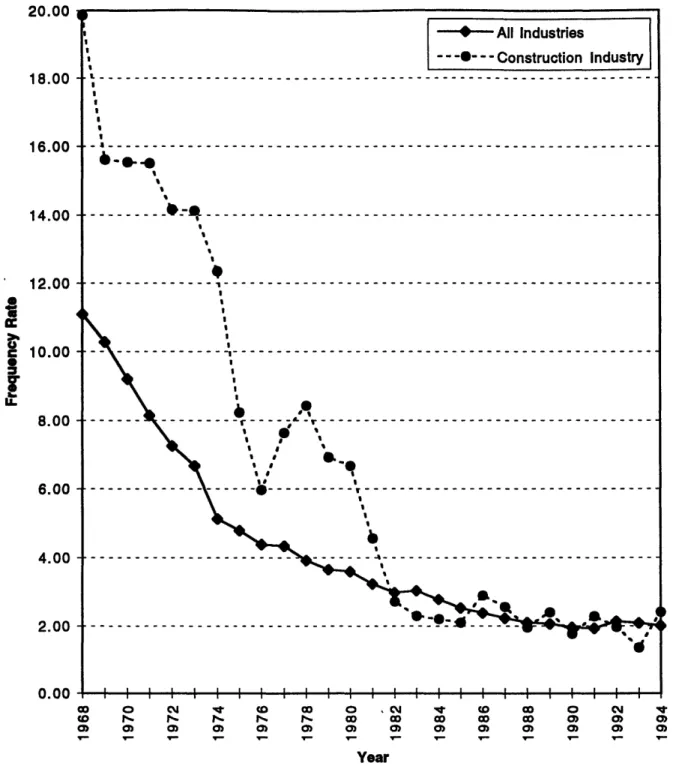
Figure 3.8 Change in Frequency Rates per 1,000,000 Man-Hours Worked in Japan...53
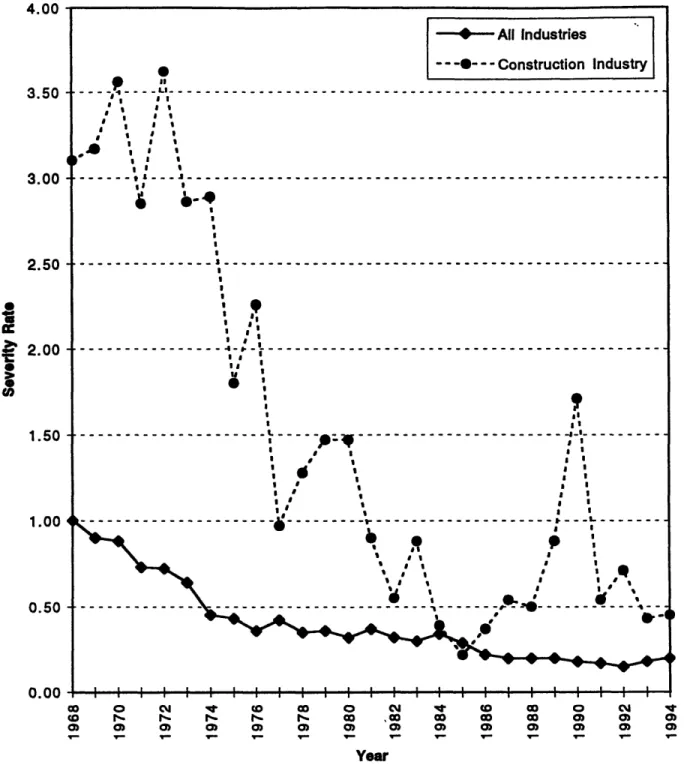
Figure 3.9 Change in Severity Rates in Japan ... 54
Figure 3.10 Change in Distribution of Occupational Fatalities and Injuries by Construction Establishment Employment Size...55
Figure 3.11 Distribution of Occupational Fatality and Injury Frequency Rates per 1,000,000 Man-Hours Worked by Construction Establishment Employment S ize ... ... 56
Figure 3.12 Change in Distribution of Occupational Fatalities and Injuries by Age Group in the Japanese Construction Industry... ... 57
Figure 3.13 Change in Incidence Rates per 1,000 Workers Employed by Age Group in the Japanese Construction Industry...58
Figure 3.14 Change in Distribution of Occupational Fatalities by Cause...59
Figure 3.15 Distribution of Occupational Fatalities Caused by Falls in 1994 by Age G rou p ... .... 60
Figure 3.16 Change in Distribution of Occupational Fatalities by Type of Construction ... 1
Figure 3.17 Change in Number of Occupational Fatalities per One Trillion Yen of Construction Investm ent... 62
Figure 3.18 Change in Number of Nonfatal Occupational Injuries with Lost Workdays in th e U .S ... ... 7 1 Figure 3.19 Change in Number of Fatal Occupational Injuries and Illnesses in the U.S...72
Figure 3.20 Change in Distribution of Nonfatal Occupational Injuries with Lost Workdays by Industry in the U.S ... ... 73
Figure 3.21 Change in Distribution of Fatal Occupational Injuries and Illnesses by Industry in the U .S...74
Figure 3.22 Change in Nonfatal Occupational Injury Incidence Rates per 2,00,000 Hours Worked (= per 100 Full-Time Workers) for Lost Workday Cases in the U.S. ... ... ... ... 76
Figure 3.23 Change in Fatal Occupational Injury and Illness Incidence Rates per
1,000,000 Hours Worked in the U.S. ...
... 77
Figure 3.24 Comparison of Fatal Occupational Injury Incidence Rates per
1,000,000
Man-Hours Worked between the U.S. and Japanese Construction Industries
... ... . ... ... ... ...78Figure
3.25
Distribution of Nonfatal Occupational Injury Incidence Rates per 200,000
Man-Hours Worked (= per 100 Full-Time Workers) by Construction
Establishment Employment Size...79
Figure 3.26 Distribution of Nonfatal Occupational Injuries by Age Group...80
Figure 3.27 Distribution of Fatal Occupational Injuries and Illnesses by Cause...82
Figure 3.28 Distribution of Nonfatal Occupational Injuries and Illnesses by Race with
Lost Workdays Involving Days Away from Work...
83
Figure 3.29 Nonfatal Occupational Injury and Illness Incidence Rates per 1,000
Employees by Race...
...
.
... 83
Figure 3.30 Change in Distribution of Occupational Injuries with Lost Workdays by
Type of C onstruction...
84
Figure 3.31 Change in Distribution of Fatal Occupational Injuries and Illnesses by Type
of C onstruction... 85 Figure 3.32 Change in Nonfatal Occupational Injury Incidence Rates per 200,000
Man-Hours Worked (= per 100 Full-Time Workers) by Type of Construction....86 Figure 3.33 Change in Fatal Occupational Injury Incidence Rates per 200,000
Man-Hours Worked (= per 100 Full-Time Workers) by Type of Construction....87 Figure 4.1 Governmental Agencies for Occupational Safety and Health in Japan ... 97 Figure 4.2 Comparison of Monthly Income by Indistry in Japan...98 Figure 4.3 Comparison of Monthly Working Hours by Industry in Japan...98 Figure 4.4 Multi-Layered Structure of Contracting in the Japanese Construction Industry
... ... 102
Figure 4.5 Safety and Health Management System in Japan...
105
Figure 4.6 Pros and Cons of the Japanese Construction Industry in Preventing
O ccupational A ccidents ... 110
Figure 4.8 Comparison of Hourly Wages by Industry in the U.S ... 120
Figure 4.9 Comparison of Weekly Working Hours by Industry in the U.S. ... 120
Figure 4.10 Typical Project Organization in the U.S. Construction Industry ... 123
Figure 4.11 Typical Safety and Health Management System in the U.S... 126 Figure 4.12 Pros and Cons of the U.S. Construction Industry in Preventing Occupational
Table of Tables
Chapter 1
Introduction
1.1
General Background
The construction industry plays an important role in supporting people's lives and industrial activities. It accounts for about 20 percent and 10 percent of the Gross National Product (GNP), employing about 10 percent and 6.5 percent of the total labor force in Japan and the USA, respectively. However, the construction industry causes about 1,000 fatalities a year in both countries, which roughly accounts for 40 percent and 15 percent of the total industrial fatalities in Japan and the USA, respectively. Both countries have been striving to reduce accidents, but their efforts have not been fully rewarded. Therefore, occupational safety in the construction industry is of great concern in both countries.
Many studies have been done of occupational accidents and safety control in the Japanese and the US construction industries to seek better management and to reduce the number of occupational accidents. One of the best approaches is to compare the safety control and management of construction industries in both countries and to identify the advantages and disadvantages of each industry. However, most of these studies analyze domestic accidents and examine domestic safety control and management; few comparative analyses have been conducted of the safety control and management of the industries in two countries.
1.2
Occupational Safety in Construction
Occupational safety in construction is one of the most important issues for effective project planning and execution. It is an essential factor for successful and
profitable companies in the competitive construction business. Accidents cause the following serious concerns for the project and the parties involved in it (Barrie and Paulson 1992):
* Humanitarian concern for victims and their families; * Increase of the workers' compensation insurance rate; * Medical expense and compensation for victims;
* Damage to materials, machinery, and equipment; * Decrease in productivity and deterioration of morale; * Project delay and interruption and schedule alteration; * Loss of skilled labor force;
* Legal and regulatory sanctions by the government; * Liability problems;
* Deterioration of the companies' images.
1.3
Past Studies of Occupational Accidents
Among studies of occupational accidents, Heinrich's study is notable for his foresighted analysis revealing the accident sequence that is known as the domino theory (Heinrich et al. 1980). He illustrated the sequence as a chain of accident factors: heredity and social environment, fault of person, unsafe performance of persons and/or unsafe condition, accident, and injury and fatality (see Figure 1.1). He also proposed a hierarchical structure of incidents: among 330 incidents, 300 incidents result in no injury, 29 cause minor injuries, and only one of these incidents causes serious injuries or fatality. Bird proposed the 1-10-30-600 relationship based on an analysis of about 1,750,000 accidents: among 641 incidents, 600 result in no visible injury or damage, 30 produce
property damage, 10 causes minor injuries, and 1 causes serious or disabling injury (Heinrich et al. 1980). These studies demonstrate that actual accidents are only a small portion of incidents that have the potential to cause accidents, thus it is important to prevent unsafe acts and conditions that trigger accidents and injuries.
Source: Heinrich, H. W., Petersen, D., and Roos, N., Industrial Accident Prevention. 5th ed.,
McGraw-Hill, Inc., New York, N.Y., 1980.
Figure 1.1 Accident Sequence
Accidents cause huge economic damage directly and indirectly. The direct costs
incurred, medical expenses for injured workers, and damaged materials, machinery, and equipment, are mostly reimbursed by insurance. However, the indirect costs resulting from lower productivity, deteriorated morale, project delay and interruption, loss of skilled labor force, governmental sanctions, and compensation for the victims and their families is not reimbursed by insurance, and the indirect costs can be several times the
direct costs. Heinrich proposed that the indirect costs are four times the direct costs, and his successors estimate an even higher ratio (Heinrich et al. 1980).
In Japan, Hanayasu made a series of statistical analyses on occupational accidents in the Japanese construction industry (Hanayasu 1980, '82, '87, '89, '93, '94). In this series of studies, he demonstrated:
* many occupational accidents occur at random,
* the frequency distribution of their occurrence in a fixed time interval is a Poisson distribution, and
* the time intervals between successive accidents are exponentially distributed. Based on these findings, Hanayasu also demonstrated that his statistical approach to occupational accidents can be used as a method of safety assessment.
Hanayasu and Igarashi made a historical review of the Japanese acquisition system for occupational accident statistics and an international comparison of the occupational accident indicators in different countries including Japan and the USA (Hanayasu and Igarashi 1990). Following this study, several studies compared occupational accidents in the construction industry among countries, based on the accident statistics and indicators (Kim and Kunishima 1992, Kim and Watanabe 1993, Okazaki et al. 1992, Watanabe and
Hanayasu 1995). These studies are helpful in comparing occupational accidents and safety in the construction industry of each country. However, they are focused on the accident data, and not on the managerial, legal, or social background of the construction industry. Therefore, it would be significant to compare these aspects of occupational accidents and safety in the construction industry.
1.4
Objectives and Scope of Thesis
The main objectives of this research are to examine management implemented for occupational safety in the Japanese and the US construction industries, and to compare them by focusing on regulations and ordinances, labor environment, labor management,
and labor relations concerning construction safety. The goals of this research are as follows:
1. To review and analyze the statistics on occupational accidents in the Japanese and US construction industries, and comparing and contrasting the two countries;
2. To examine the management both construction industries have implemented for construction safety by surveying: incentives for safety, regulations and ordinances concerning occupational safety, affiliated governmental agencies, working conditions, labor management, labor relation between parties involved in construction such as owners, architects and engineers, and contractors in both construction industries, and education and training;
3. To compare the management of safety in both construction industries, and to identify the advantages and disadvantages that each construction industry has; 4. To propose ideas for more effective management of construction safety.
1.5
Outline of Thesis
Chapter 2 reviews the Japanese and the U.S. construction industries, and refers to their economic situations, historical backgrounds, and construction practices. Chapter 3 analyzes the statistics on occupational accidents in Japan and the USA to discuss the degree of occupational safety in the Japanese and the US construction industries. Chapter 4, based on the analysis in Chapter 3, examines management for occupational
safety in both construction industries, and compares their management. The comparison focuses on various aspects of the industries such as pertinent laws and regulations regarding occupational accidents and safety, affiliated governmental agencies, working conditions, labor relations and labor management, and education and training offered to workers. The chapter also discusses the pros and cons of their safety management. Finally, Chapter 5 presents conclusions of this comparative analysis between these two construction industries and offers recommendations for better management to assure occupational safety in both industries.
Chapter 2
Overview of the Japanese and the U.S.
Construction Industries
2.1
General
Since humans started building civilization on the earth, the construction industry has played an important role in implementing infrastructure in our civilized society. In the Roman Empire, roads and bridges were constructed, which enabled easy transportation of people and goods between cities. The ancient Chinese dynasties constructed canals, embankments, and diversion channels to protect people and crops from disastrous floods and to ensure their transportation. The dynasties built the Great Wall to protect their territory from the enemies' invasions. In feudal times in Japan, from the 16th to 19th centuries, the feudal lords in the various parts of the country strove to enrich their territory by various activities such as cultivating and irrigating land and embanking and diverting rivers. In modem times, the Industrial Revolution spurred the innovation of construction technology. Large-scale construction projects were completed with the introduction of innovative technology, such as the Panama Canal, the Empire State Building, the Golden Gate Bridge, and the dams of the Tennessee Valley Authority (TVA) project.
Today, the construction industry encompasses a huge range of construction: from small houses in suburbs to skyscrapers in cities; from subway tunnels to highways; from long span bridges over the ocean to large dams in the mountains; from small local airports to large international airports; from hydroelectric power plants to thermal and nuclear power plants. The industry links people in the world together in their social, economic,
The construction industry has the following unique features compared to other industries such as the manufacturing industry (Kohno 1978):
* Construction is executed outdoors on different sites; * Construction is custom-built;
* Construction comprises many different work packages such as earth works, steel erection, concrete works, electric equipment works, and plumbing;
* Construction requires intensive labor despite the innovation of construction machinery.
Because of the above features, the construction industry is greatly influenced by natural, social, political, and economical conditions. Every construction is customized according to the client's request and different site condition; thus there are no identical construction projects. The vulnerability of the industry to the fluctuation of the economy hinders the prediction of future construction demands. Because construction workers are inevitably exposed to potential risks and accidents due to outdoor labor, construction is dangerous in nature and safety in construction is a serious concern in the industry. Consequently, the construction industry involves complexity and difficulty in all phases of the project: planning, designing, construction, and maintenance.
Therefore, the construction industry now seeks new strategies to tackle the increasing complexity involved in project organization and management.
2.2
Japanese Construction Industry
2.2.1 General Description of the Industry
The Japanese construction market is one of the largest in the world. The investment in construction was about 82.4 trillion yen ($ 824 billion)1 in fiscal 19942,
accounting for 17.5 % of the Gross National Product (GNP) of 472 trillion yen ($ 4.71 trillion) for the same fiscal year (see Figure 2.1). Of this investment, public and private investments were 37.8 trillion yen ($ 378 billion) and 44.6 trillion yen ($ 446 billion), spread 45.9 % and 54.1 %, respectively (see Figure 2.2). Note that the public investment was mostly made in civil engineering projects, whereas the private investment was largely made in building projects; the public investment for civil engineering projects was 30.0 trillion yen accounting for 79.3 % of the public investment, whereas the private investment for the architectural projects was 36.9 trillion yen accounting for 82.7 % of the private investment. According to the governmental prospective estimates, the investment will amount to 1,000 trillion yen during the decade between 2001 and 2010.
The Japanese construction industry is comprised of about 540,000 construction firms, ranging from small one-man operation firms to huge general contractors with more than 10,000 employees such as Kajima Corporation and Shimizu Corporation. The industry employed a labor force of 6.55 million in 1994, accounting for about 10 % of the total labor force in all Japanese industries (see Figure 2.3).
At present, the aging of employees is a serious concern to the construction industry (see Figure 2.4). The figure illustrates that the number of employees over 50 years old has increased in recent years; they accounted for 35.1 % of the total employees
in the industry in 1994, whereas they accounted for only about 18.1 % in 1972. In
In this thesis, the exchange rate is assumed to be 100 yen to the US dollar, which is approximately the
prevailing rate in 1995.
contrast, the number of employees under 40 years old is decreasing; their percentage decreased from 58.9 % in 1972 to 38.2 % in 1994, resulting from the employment decline of the young labor force. Although the aging of employees is a common concern to all industries in Japan, the construction industry is exposed to more rapid aging of employees than other industries3. Consequently, the aging labor force is a more serious problem for the construction industry than other industries.
To start a construction business in Japan, construction firms must obtain an official license issued by the Construction Minister or the prefectural governor, depending on the scale of their business. They are required to obtain a license from the Construction Minister if they want to perform nationwide construction work; and they are required to obtain a license from the prefectural governor if they want to perform construction work in the corresponding prefecture. Note that most of these construction firms are small; 73.8 % of the firms are capitalized at less than 10 million yen ($ 100,000), and about one third of the firms are operated by one man (see Figure 2.5). The firms capitalized at more than 100 million yen ($ 1 million) account for only 1 % of the nation's firms, including Kajima Corporation and Shimizu Corporation.
The average percentage of employees over 50 years old in the Japanese industries is 21.8 % in 1972 and
32.7 % in 1994. On the other hand, the average percentage of employees under 40 years old is 56.3 % in
500.0 450.0 400.0 350.0 300.0 250.0 200.0 150.0 100.0 50.0 0.0 o CJ R (0D o0 0 CJ CD CD CO CD C t.. t-o) 0O 0) 0) 0) 0) O) Year
Source: The Ministry of Construction, Kensetsu-Tokei-Yoran(Survey of Construction Statistics), Japan, 1970-1995.
The Economic Planning Agency, Annual Report on National Accounts, Japan, 1961-1995. Note: The data from 1992 to 1994 are projected.
Figure 2.1 Comparison of Construction Investment with Gross National Product (GNP) in Japan
4 1 7 Tir.llir% Van (14 25.2 Trillion Ye (30.6%) 7.7 Trillion Yen (9.4%) .0 Trillion Yen (36.4%) .7 Trillion Yen (2.0%) on Yen (7.5%) Figure
Source: The Ministry of Construction, Kensetsu-Tokei-Yoran (Survey of Construction Statistics), Japan, 1995.
2.2 Breakdown of Japanese Construction Investment in 1994 (Projected)
gU I 70.0 -60.0 50.0 40.0 30.0 -20.0 10.0 0.0
0---- Employed Labor Force in Construction Industry
-- - Total Employed Labor Force
---
----
---
---
--- ----
---
--- ----
---
---CM
Cto 0)CD Wat-Co 0o Co Vo 0)r I I Go oD 0o V-I I I I I I I I I I I I I I I I I I I I I I ! I I I I @d CU lID I O (4 •Q tO CO O 04 o CM 1 CO Go 0 CM V (0 0Co 0 Cm qr,,- r,,. I"- r '. .. ", 0 0 iN x o• o:1 13
) ) ) ) 0) ) ) ) ) 0) 0) 0)
Year
Source: Statistics Bureau, Management and Coordination Agency, Annual Report on the Labour
Force Survey, Japan, 1967-1995.
Note: Persons aged 15 years old and over.
Figure 2.3 Comparison of Employed Labor Force in Construction Industry with Total Labor Force in Japan
8 Public Investment in Civil Engineering Projects
0 Public Investment in Residential Building Projects
MI Public Investment in
Nonresidential Building Projects M Private Investment in Civil
Engineering Projects
83 Private Investment in Residential Building Projects
El Private Investment in
Nonresidential Building Projects
lli| | |
I
-S65 or over * 55 to 64 * 50 to 54 040 to 49 0 30 to 39 * 20 to 29 M under 20 C14 1q c D c O CMI 4 (D C C O 0 C4 1" 0) 0) 0) 0) 0) 0) 0) 0) 0) 0) 0) 0) Year
Source: Statistics Bureau, Management and Coordination Agency, Annual Report on the Labor Force
Survey, Japan, 1973-1994.
Figure 2.4 Breakdown of Employed Labor Force in Japanese Construction Industry by Age 7,347 5,493 (1.4%) (1.0%) 70,264 31.4%) 33,060 (6.1%) 111,041 (20.5%)
Source: The Ministry of Construction, Kensetsu-Tokei-Yoran (Survey of Construction Statistics), Japan, 1995.
Note: As of the end of March, 1994.
Figure 2.5 Breakdown of Licensed Construction Firms in Japan by Capital in
1994 100% 80% 60% 40% 20% 0% 129,1( (23.81 85,71 (15.80/ M One-Man Operation
Il Less than 2 Million Yen
M Less than 5 Million Yen
E Less than 10 Million Yen O Less than 50 Million Yen M Less than 100 Million Yen M More than 100 Million Yen
2.2.2 Historical Background of the Industry
The Japanese construction contracting industry dates from the Edo era--1600 to 1867-the last feudal era (Kohno 1978). During this era, the feudal government, the Tokugawa shogunate, esteemed highly Confucianism as a political philosophy. This philosophy still has great influence on today's construction contracting in Japan.
In the subsequent Meiji era, after the drastic political change called the Meiji restoration of 1867, Japan emerged from being a feudal country as a new modem nation. The Japanese government endeavored to realize prompt industrialization by promoting and protecting modem industries under direct governmental management. Construction projects played an important role in this industrialization by implementing a modem industrial infrastructure. However, at that time, contractors were considered the labor force collectors (Kakoto et al. 1989). Therefore, the contracts for the construction projects were extremely unilateral in favor of the owners, such as the government and the municipal owners. This unilateral characteristic still lingers in today's contracts to some extent.
After World War II, the construction industry again played an important role in reconstructing the infrastructure ruined by the war. Since democracy prevailed in Japan, construction contracting was examined, and the contractual status of contractors improved under the Construction Industry Law enacted in 1949 (Kakoto et al. 1989). The construction industry has greatly contributed to the Japanese economy, accounting constantly for more than 15 % of the nation's GNP.
Today, the Japanese construction industry faces drastic changes: the industry is gradually opening its market which has been kept closed to foreign participants; the industry is revising the ways of bidding on public projects from a nominated bidding system to an open bidding system in order to prevent contractual corruption; a great deal of new investment is sought for future construction projects to boost up the recessive
Japanese economy. With these new changes, the Japanese construction industry will soon be exposed to more severe competition resulting from the increasing participation of foreign construction firms and to the unexpectedly quick internationalization of the industry as a whole.
2.2.3 Characteristics of Construction Practices
Several studies have been made of the Japanese construction industries. Paulson reviewed the Japanese construction industry and emphasized its similarities with the U.S. construction industry (Paulson 1980b). He also pointed out its strength in research and development and discussed the application of its approach to research and development in the U.S. construction industry (Paulson 1980a). Kakoto et al. examined public
contracting practices in the Japanese and the U.S. construction industries and compared them (Kakoto et al. 1989). He presented some recommendations to Japanese contractors operating in the U.S. and to the U.S. contractors who would soon operate in Japan. Oyama wrote a M.S. thesis that compared the Japanese and the U.S. construction industries (Oyama 1991). He studied both industries with respect to several aspects: historical background, industrial organizations and structures, human resources, labor unions, and, finally, market trends that could be predicted. Kashiwagi et al. examined the legal aspects of contracting and construction practices of the two countries with respect to their legal systems and construction laws (Kashiwagi et al. 1988). Baba showed an interesting approach in another comparative study (Baba 1990). He introduced psychological analysis based on the theories of Carl Gustav Jung to explain the different management styles of the two countries.
Based on the afore-mentioned studies, the following summaries seem adequate to characterize construction practices in Japan, in comparison with those in the U.S.;
1) The Japanese construction industry depends heavily on long-term
relationships based on mutual trust and 'a Confucian sense of social
obligation' (Paulson 1980b) among the parties involved in construction
projects. Owners, contractors, specialists, and suppliers have established
these relationships through their cooperation over decades in working toward
common objectives. These relationships still have a great influence on the
Japanese joint surety system, which is generally used in public construction
projects, instead of performance bonds that are generally used in the U.S.
construction industry. In Japan, a contractor who is not involved in a project
bid becomes the joint surety to guarantee project completion if the selected
contractor of the project should fail to complete his/her job. The long-term
relationships, however, yield ambiguity in contractual relationships among the
parties involved in a project. In contrast to U.S. practices, the parties are not
strictly bound by the contract itself in Japan. Consequently, it is difficult for
them to specify their roles and responsibilities clearly only by examining the
contract documents.
2) Like other Japanese industries, the construction industry relies more on a
consensus approach to project management, to decision-making, and to
dispute-settlement than the top-down authoritarian approach that is common
practice in the U.S. construction industry (Paulson 1980b). Through the
consensus approach, the parties involved in decision-making share
responsibility for the decision. In this approach, negotiation plays an
important role in achieving a consensus among them.
The consensus
approach, however, makes it difficult to specify individual responsibilities,
which leads to the ambiguous relationship among the parties.
3) As mentioned above, negotiation is very important in Japanese project management and decision-making. Generally, contractual disputes are resolved by negotiation among the parties involved in the dispute, which presents a striking contrast to the litigious U.S. approach. In a typical Japanese construction contract, there are many provisions that require negotiation to settle contractual disputes, such as an alteration of the contract sum, or the project suspension or termination. The dispute settlement by negotiation, however, sometimes makes it difficult to clarify the liabilities that each party
should bear and thus augments the afore-mentioned contractual ambiguity. 4) Because public and municipal owners have authority to give licenses, ranks,
and protection to contractors, contractual relationships between the owners and the contractors are often unilateral. The contracts are one-sidedly in favor of the owners. Despite the remarkable improvement of contractors' contractual status by the Construction Industry Law, the unilateral relationships still remain in actual practice. Similarly, contractual relationships between general contractors and subcontractors are often biased in favor of the general contractors. There are many subcontractors that operate only for one general contractor in a paternalistic relationship. Under this captive contractual relationship, these subcontractors often seem to be mere labor force suppliers.
5) General contractors depend heavily on subcontracting. Virtually all the work in a project is directly performed by the subcontractors' labor force, not by the general contractors' labor force. This Japanese practice of subcontracting forms a remarkable contrast to the U.S. practice in which a substantial portion of the work is often performed by the general contractors' labor force (Kakoto 1989). This practice enables the general contractors to adjust their labor force
according to the trends in the construction market and it also helps them to foster, long-term relationships with subcontractors. However, the heavy dependence on subcontracting lures the subcontractors into a captive reliance upon general contractors, and undermines their contractual status.
6) As mentioned above, Japanese construction firms rely on subcontractors for the labor supply, in contrast to the U.S. practice where the construction firms hire workers directly, generally from the labor unions.
7) Since labor unions in the Japanese construction industry are organized by industry sub-sectors such as housing contractors, heavy construction contractors, or employees of large contractors, virtually no jurisdictional or inter-union disputes arise (Oyama 1991). The labor unions lack strong bargaining power against employers for better job conditions because they do not serve to refer workers to employers and projects as sources of labor, but merely, supply workers with insurance plans. Moreover, no subcontractor is unionized; labor unions such as those of carpenters, plasterers, and masons do not exist in Japan (Hasegawa 1988).
8) Because of the absence of strong labor unions, job conditions in the Japanese construction industry are inferior to those in the U.S. industry; wages are lower and working hours are longer in Japan than in the U.S. Oyama examined wages and working hours in both industries (Oyama 1991). According to his study, the purchasing power of Japanese construction workers' income is 10 % lower and their annual working hours are 15 % longer than construction workers in the U.S.
9) The contractual status of private architectural and engineering (A/E) consultants in the Japanese construction industry is lower than that in the U.S. industry. In general, the public and municipal owners and major general
contractors have their own in-house architectural and engineering staff. They
exhibit excellent expertise in design and engineering phases of projects based on their practical experience in the construction phase acquired when they move to the sites and supervise the projects. Although the private architectural and engineering consultants are increasingly awarded public contracts, they have no authority in decision making. Thus, in the trilogy of owners, (general) contractors, and architectural and engineering consultants, the involvement of the consultants in projects is more superficial than in the U.S. (see Figure 2.6).
Owner
I
A/E Consultant
Contractor
Contractual Relationships between Owner, Contractor, and A/E
Consultant in the Japanese Construction Industry
10) In the Japanese construction industry, great emphasis of a project, its completion on time, and safety. quality, time, and safety (Bennette 1991). In construction industry, project cost seems to have top
is placed on the quality Cost ranks lower than contrast, in the U.S. priority.
2.3
U.S. Construction Industry
2.3.1 General Description of the Industry
In 1994, the U.S. construction industry put new construction in place that was valued at $ 506.8 billion, accounting for 7.5 % of the GNP of $ 6.73 trillion. The industry employed 7.49 million workers, comprising 6.1 % of 119.3 million workers employed in all industries. Figures 2.7 and 2.8 illustrate the recent trend of the construction
Figure 2.6
C-investment versus the GNP and of the labor force employed in the construction industry
versus the total labor force, respectively. Based on a comparison of Figures 2.7 and 2.8
with Figures 2.1 and 2.3, it is clear that the construction industry has played a more
important role in the Japanese economy than that in the U.S. economy. This is because
since the end of World War II, the Japanese government has striven to replace the
infrastructure ruined by the war. It has aimed for redevelopment at the level of the
Western European countries and the U.S. Therefore, the Japanese government has been
more energetic in construction investment than the U.S. government. Figure 2.9 exhibits
that the U.S. public investment by the federal, state, and local governments represents
only 25.6% of the total investment in 1994. This presents a striking contrast to the
Japanese public investment accounting for 45.9 % of the total investment, as shown in
Figure 2.2.
There is another remarkable characteristic of the U.S. construction industry in
contrast to the Japanese construction industry. In the U.S., the vast majority of the
investment is made in building projects such as construction of residential houses and
nonresidential office buildings. Figure 2.9 reveals that the U.S. investment made in
building projects accounted for 76.6% of the total construction investment in 1994. In
Japan, by contrast, only 54.3% of the construction investment was made in building
projects in 1994, as shown in Figure 2.2.
7,000.0 6,000.0 5,000.0 4,000.0 3,000.0 2,000.0 1,000.0 0.0 o ~l v c Go ..*0 CM c c cO (0 D cD CD r- . -. t - *-I*.-0) 0) 0) 0) 0) 0) ( 0D 0) 0) (00) Year
Source: U.S. Department of Commerce, Business Statistics 1963-1991, 1992.
U.S. Department of Commerce, Survey of Current Business, 1992-1994.
U.S. Department of Commerce, Value of New Construction Put in Place, 1978-1994.
Figure 2.7 Comparison of Construction Investment with Gross National Product (GNP) in the U.S.
I9 I
0o C' •t ( D 0 CM RT W Go O CM V (" G) O Cq V
cD c t cD (D <. 1%- r- r [ý. cU Go Go G) G) 0) 0) 0) 0) 0) 0) 0) 0) 0) 0) 0) 0) 0) 0) 0) 0) 0) 0) 0) 0) M)
Year
urce: International Labour Office, Geneva, Yearbook of Labour Statistici, Switzerland, 1970-1995. te: The data are of civilian labor force aged 16 years old and over.
The data until 1969 are earners and salaried employees.
8 Comparison of Employed Labor Force in Construction Industry with Employed Total Labor Force in the U.S.
$ 74.9 Billion $1 97.8
Billon
(19.3%) Ti .. $5 Bi (1 4.6 Billion (0.9%) $ 47.4 Billion(9.4%) $ 2.3 Billion (0.5%) $ 41.8 Billion (8.3%) $ 238.0 Billion (47.0%)Source: U.S. Department of Commerce, Value of New Construction Put in Place: December 1994, 1994.
Figure 2.9 Breakdown of U.S. Construction Investment in 1994
130.0 120.0 110.0 100.0 90.0 80.0 70.0 60.0 50.0 40.0 30.0 20.0 -10.0 0.0 Soi No Figure 2.
E Public Investment in Civil
Engineering Projects
1e Public Investment in Residential Building Projects
1 Public Investment in
Nonresidential Building Projects * Public Investment in Military
Facilities Projects
[ Private Investment in Civil Engineering Projects
El Private Investment in Residential Building Projects
o
Private Investment inNonresidential Building Projects
I- .. - Total Employed Labor Force, , u , ,,.
--- -- r
---
0 0 - -
VO
--- ---
--- --- --- ---
-- - - - -- - -
---
---
*- -
- - - -- - --
- - - --
-
-
---
--,,----.. . ,,----..
. . .. . .. . . .. . .. .• ,
< .< .'_ . . .. . .: . .
....o o P~...
. . . ..
. . . .
... .... ... .... ....
J
~ A ~Ch ~~~ ~ A ~ ~LC~C~C~Y ~V VV I f A A nl lThe heavy dependence on building construction, especially on private residential building construction, causes the U.S. construction market to be susceptible to economic conditions. Demands for private housing fluctuate heavily depending on economic conditions. This dependence produces an environment in which the great majority of construction firms are small. Figure 2.10 showing the breakdown of U.S. construction firms by employment size illustrates this situation; in 1987, construction firms with fewer than 19 employees accounted for roughly 75% of the total number of construction firms, whereas construction firms with 100 or more employees accounted for less than 1 %.
Oyama examined the size of U.S. construction firms in comparison with the Japanese construction firms in his M. S. thesis (Oyama 1991). He concluded that the average size of the U.S. firms is one third that of the Japanese firms in terms of business receipts. This, he deduced, results from an increasingly large number of small firms involved in housing construction, maintenance, and repair work. Moreover, although both industries largely depend on a great majority of small firms and a small number of large firms, he pointed out that the distribution of firms by size is different in each country; in the U.S. industry, small firms account for a much larger portion of the total number of firms than in the Japanese industry. Yamada, an area manager of Obayashi Corporation4 in the Central Artery/Tunnel (CA/T) Projects in Boston, also corroborated the impression of the U.S. construction firms (Yamada 1995).
4 Obayashi Corporation, one of the top five construction companies in Japan, organized ajoint venture with The Modem Continental Co., Inc., a local construction company in Boston, for the CAR/ project. s The CA/T project is to complete the interstate highway network in Boston. The project started in 1988
and is scheduled to be completed in 2004. The total construction cost is estimated to be $ 9.6 billion in 2004 (projected in 1995).
35,7C 90,10 (15.80) 9,341 4,718 (1.6%) (0.8%) 0,676 (75.5%)
Source: U.S. Department of Commerce, Census of Construction Industries 1987, Washington, DC,
1990.
Note: The data include building construction contractors, heavy construction contractors, special trade contractors, and land subdividers and developers.
Figure 2.10 Breakdown of Construction Firms in the U.S. by Emplyment Size
2.3.2 Historical Background of the Industry
The U.S. construction industry originated in housing construction for immigrants
from Europe. Since the Puritans first came from Europe, an increasing number of
immigrants has supported constant demand for housing construction. Therefore, as
discussed in the previous paragraph, housing construction still plays a very important
role in the U.S. construction industry.
After achieving independence from England, the U.S. strove to expand her
territory to the undeveloped West. The progression of the frontier urged immigrants to
move to the West. This required fast, easy, and mass transportation systems such as the
railroads. When the Civil War ended in 1865, railroad construction boomed. The first
transcontinental railroad was completed in 1869, and early in the 20th century, most of
today's railroad network was implemented.
The railroad construction was succeeded by road construction, after, in 1907,
Henry Ford started mass production of the Model T, an affordable car for ordinary
1 to 9 employees 0M 10 to 19 employees E20 to 49 employees 0 50 to 99 employees O 100 to 499 employees S500 or more employees
people. Thus, demands for road construction jumped. The increasing demand for railroad and road construction gave rise to the emergence of new construction firms. Many of the largest construction companies in the U.S. today were established in this period, such as the Bechtel Group Inc. (1898) and the M.W. Kellog Co. (1900).
In the beginning of the 20th century, the U.S. became a superpower in the world. The U.S. industries experienced a remarkable growth. After World War I, the GNP of the U.S. exceeded that of England, and an increasing number of immigrants became the source of labor to support this industrial growth. The construction industry contributed greatly to the nation's development by furnishing buildings and infrastructure such as bridges and dams. Many epoch-making construction projects were executed with the innovative technologies and economic power of the U.S., for example, the Empire State Building (1931), the Hoover Dam (1936), and the Golden Gate Bridge (1937).
After World War II, the U.S. strengthened her economic power. The construction volume increased steadily. However, in the 1970's, the construction industry suffered economic recession twice due to oil crises. To survive severe competition in the construction market, construction firms struggled to reform their organizational constitution through layoffs and financial operations (Oyama 1991).
Today, the U.S. construction industry is recovering its energies. Furthermore, the industry is challenging the new era of internationalization. Many U.S. construction firms have cooperated with foreign firms, like the Japanese, in domestic and overseas projects with great success. Now U.S. firms are striving to work with Japanese firms in the newly opened Japanese construction market.
2.3.3 Characteristics of Construction Practices
In comparison with the Japanese construction industry, construction practices in the U.S. are characterized as follows:
1) Labor unions in the U.S. are organized nation-wide by trades, not by industries, and have a great influence on the U.S. construction industry by: reference of workers to projects and employers as sources of a skilled labor force, collective bargaining power with employers for better job conditions, apprenticeship training for workers, insurance plans for unemployment, health, and accidents, and collective strikes. The nation-wide trade unions in the construction industry resulted from two situations. One was a chronic shortage of labor due to incredibly rapid development and industrialization of the U.S. The second was a strong requirement for a stable labor supply to construction projects in this huge country. A series of laws6 were enacted to protect, yet control, the trade unions, and to enforce fair labor practices for both employers and unions. The unions have contributed greatly to the improvement of labor conditions in the construction industry (Oyama 1991). 2) The contractual relationships between the parties involved in a project such as
owners, contractors, and architects/engineers are short-term oriented. This presents a remarkable contrast to the Japanese long-term relationships based on mutual trust (Kakoto et al. 1989). The U.S. short-term relationships can be
seen between contractors and workers, because contractors employ union workers and/or non-union workers temporarily for the period of construction,
and most workers are not permanent employees of contractors.
3) Under the U.S. labor law, U.S. construction firms operate a union shop or an open shop (non-union). Levitt et al. made many studies to compare union firms and open shop firms and revealed comparative advantages of open shop firms over union shop competitors: flexible coordination of workers and cost
6The Norris-La Guardia Act was promulgated in 1932, the National Labor Relations Act (Wagner Act) in 1935, Labor Management Relations Act (Taft-Hartley Act) in 1947, and the Landrum-Griffin Act in
benefit of lower wages. Because of these advantages, the number of open shop construction firms has been steadily growing, both in their share of the overall construction market and in geographic penetration throughout the U.S. (Barrie and Paulson 1992). The impact of this growth is not yet fully known, because unions have traditionally trained new workers.
4) The parties involved in a project are strictly bound by the written contract documents. The contract documents are the primary ground on which contractual disputes are resolved.
5) Individual and organizational duties and responsibilities are clearly specified and rigidly specialized, and project management and decision-making depend heavily on a top-down authoritarian approach, not on the consensus and negotiation approach that is common in the Japanese construction industry. 6) In general, architectural and engineering (A/E) consultants are independent
from owners and contractors. They have equivalent contractual status to owners and contractors, and participate in all phases of a project as third parties. Owners, contractors, and A/E consultants form rigid contractual relationships (see Figure 2.11).
Owner
I
I
A/E Consultant
I
I ,-· r
Contractor
Figure 2.11 Contractual Relationship between Owner, Contractor, and A/E
Chapter 3
Analysis of Occupational Accidents in the Japanese
and the U.S. Construction Industries
3.1
Definition of Occupational Accident
Occupational accidents are defined as accidents that cause deaths, injuries, or diseases to workers. The Resolution concerning statistics of occupational injuries adopted by the Thirteenth International Conference of Labour Statisticians held in Geneva in 1982 defines the occupational injuries and work (= occupational') accidents as
(Yearbook ofLabour Statistics 1995, International Labour Office Geneva, 1995):
* Occupational injuries include deaths, personal injuries and diseases resulting from work accidents.
* Work accidents are accidents occurring at or in the course of work which may result in death, personal injury or disease.
The Japanese Industrial Safety and Health Law enacted in 1972 gives the following definition of industrial (= occupationals) accident in its Article 2 of Chapter 1, which depicts the nature of the accidents more clearly (Labour Laws of Japan 1995, Ministry of Labour, 1995):
industrial accident: means that a worker becomes injured, contracts disease or is killed by buildings, equipment, raw materials, gases, vapours, particulate substances or the like which are related to the employment of the workers, or due to causes arising from work activities or other business affairs.
7 This footnote is given by the author.
3.2
Occupational Accidents in Japanese Construction Industry
3.2.1 Historical Review
In Japan, the collection and compilation of statistics on occupational accidents officially began after the promulgation of the Factory Law in 1911. Under this law, all factory employers were obliged to submit a monthly report of any accidents in the factories that had caused injuries to workers resulting in an absence of three or more days. This law, after its revision in 1923, obliged factory employers to report every accident.
However, the Factory Law applied only to those occupational accidents that occurred within factories, not to those in outdoor occupations such as construction work. It was not until the enactment of the Workmen's Accident Relief and Liability Insurance Law in 1931 that accidents in the construction industry were included in the list of occupational accidents officially collected for statistical analyses. Under the Workmen's Accident Relief and Liability Insurance Law, the collection of statistics on occupational accidents in the construction, quarrying, and transportation industries was initiated, and an annual report of the accidents in these industries was issued, beginning in 1932.
After a temporary break in data collection during World War II, the collection and compilation of statistics on occupational accidents resumed. This resumption was enabled by the establishment of new legislative background concerning occupational safety and health. The Ministry of Labour was established in 1947, and three major labour laws were enacted: the Labour Relations Adjustment Law in 1946, the Labour Standards Law in 1947, and the Trade Union Law in 1949. In addition, the Workmen's Accident Compensation Insurance Law was enacted in 1947. Further efforts to increase workers' safety and health resulted, in 1972, in the Industrial Safety and Health Law that was designed to secure the safety and health of workers, as well as to facilitate the establishment of comfortable working environments. Under this law, substantial revisions were added to the data acquisition and compilation system for occupational