CERN-EP-2018-319 28 November 2018
c
2018 CERN for the benefit of the ALICE Collaboration.
Reproduction of this article or parts of it is allowed as specified in the CC-BY-4.0 license.
Study of J/ψ azimuthal anisotropy at forward rapidity
in Pb–Pb collisions at
√
s
NN= 5.02 TeV
ALICE Collaboration∗
Abstract
The second (v2) and third (v3) flow harmonic coefficients of J/ψ mesons are measured at forward rapidity (2.5 < y < 4.0) in Pb–Pb collisions at√sNN= 5.02 TeV with the ALICE detector at the LHC. Results are obtained with the scalar product method and reported as a function of transverse momentum, pT, for various collision centralities. A positive value of J/ψ v3is observed with 3.7σ significance. The measurements, compared to those of prompt D0mesons and charged particles at mid-rapidity, indicate an ordering with vn(J/ψ) < vn(D0) < vn(h±) (n = 2, 3) at low and intermediate pTup to 6 GeV/c and a convergence with v2(J/ψ) ≈ v2(D0) ≈ v2(h±) at high pTabove 6-8 GeV/c. In semi-central collisions (5–40% and 10–50% centrality intervals) at intermediate pT between 2 and 6 GeV/c, the ratio v3/v2of J/ψ mesons is found to be significantly lower (4.6σ ) with respect to that of charged particles. In addition, the comparison to the prompt D0-meson ratio in the same pT interval suggests an ordering similar to that of the v2and v3coefficients. The J/ψ v2coefficient is further studied using the Event Shape Engineering technique. The obtained results are found to be compatible with the expected variations of the eccentricity of the initial-state geometry.
∗See Appendix B for the list of collaboration members
1 Introduction
The study of collisions of ultra-relativistic heavy ions aims to characterize the Quark–Gluon Plasma (QGP), a strongly coupled state of matter comprising of deconfined quarks and gluons. One of the main features of heavy-ion collisions is the anisotropic particle flow [1, 2]. It arises from initial collision geometry anisotropies being converted by the pressure gradients of the QGP medium to final-state parti-cle momentum anisotropies. The anisotropic flow is described by the coefficients vnof a Fourier series
decomposition of the azimuthal distribution of the produced particles [3] dN dϕ ∝ 1 + 2 ∞
∑
n=1 vncos[n(ϕ − Ψn)], (1)where ϕ is the azimuthal angle of the particle and Ψnis the n-th harmonic symmetry plane angle. The
dominant second-order flow coefficient (v2) is called elliptic flow and mostly originates from the
almond-shaped overlap area between the colliding nuclei in non-central collisions. The third-order flow coeffi-cient (v3) is named triangular flow and is generated by fluctuations in the initial distribution of nucleons
in the overlap region [4–8].
Heavy quarks, in particular their bound quark-antiquark states known as quarkonia, are important probes of the QGP. Heavy-quark pairs are created prior to the formation of the QGP through hard parton colli-sions and thus experience the full evolution of the system. Measurements of the J/ψ nuclear modification factor (RAA) as a function of centrality in Pb-Pb collisions at the LHC [9–11] are reproduced by
trans-port [12–14] and statistical hadronization [15, 16] models including partial to full J/ψ (re)generation by recombination of thermalized charm quarks. Such (re)generation component is dominant at low trans-verse momentum (pT) as shown by the comparison [11, 17] of the RAAas function of pT with transport
model calculations. In the case of the statistical hadronization model, the produced J/ψ reflects the dynamics of the charm quarks at the QGP phase boundary. The measured pT spectra seem to support
this idea [18]. Measurements of the azimuthal anisotropies of J/ψ production in high-energy heavy-ion collisions can bring new important insights on the charm quark dynamics.
A recent measurement of the elliptic flow of J/ψ at forward rapidity in central and semi-central Pb– Pb collisions at the center of mass energy per nucleon pair of√sNN = 5.02 TeV indicates a significant
positive v2coefficient [19]. This result is compatible with the hypothesis of J/ψ production via
recombi-nation of thermalized c and ¯c quarks from the QGP medium predominantly at low pT, but the magnitude
and the transverse momentum dependence of the v2coefficient differ significantly from theoretical
cal-culations [12–14]. Moreover, the v2 coefficient is found to be quite significant at high pT, in contrast
with the expectations of small azimuthal asymmetry originating mainly from path-length dependent J/ψ dissociation in the medium. Furthermore, a positive J/ψ v2 coefficient at intermediate and high pT has
been observed in p–Pb collisions [20, 21], in which neither a significant contribution from charm-quark recombination nor sizable path-length effects are expected [22]. Recent measurements of D-meson az-imuthal asymmetry in Pb–Pb collisions are interpreted as collective behavior of the charm quarks at low pT and path-length dependent charm-quark energy loss at high pT[23, 24].
Hydrodynamic calculations [25] show that vn≈ κnεnfor n = 2 and 3, where εnis the eccentricity
coeffi-cient of the initial-state collision geometry. The parameters κnencode the response of the QGP medium
and depend on the particle type and mass as well as its transverse momentum. At low pT, the flow
coef-ficients of light-flavoured particles increase with increasing pT[26, 27]. This increase of vncoefficients
as a function of pTdepends of the particle mass and can be attributed to the radial expansion of the QGP
medium. At 3-4 GeV/c, the flow coefficients reach a maximum. The position of the maximum, divided by the number of constituent quarks nq, does not dependent strongly on the particle mass as predicted
by coalescence models [28]. Furthermore, the vnvalues at the maximum, divided by nq, are similar for
all measured light-flavoured particles, with deviations of up to ±20% between mesons and baryons [27]. At high pT above 6-8 GeV/c, the observed azimuthal anisotropy of the final-state particles is believed
to come from path-length dependent parton energy loss inside the QGP. Calculations [29] show that the corresponding v2and v3coefficients exhibit approximately linear dependence on ε2and ε3, respectively.
Nevertheless, the correlation between the flow coefficients and the initial-state eccentricities is weaker with respect to the hydrodynamic case, especially between v3 and ε3. Interestingly, the particle-mass
dependence of v2 and v3 appears to be strongly reduced in the ratio v3/v2 in semi-central collisions for
light-flavored particles [27]. Whether the above considerations also hold for heavy quarks and quarko-nia is an open question whose answer could help to understand the origin of charm quark azimuthal anisotropies and characterize their interactions with the flowing medium.
In the present analysis, the J/ψ v2and v3coefficients as well as the ratio v3/v2as a function of the
trans-verse momentum and the collision centrality are measured. Wherever possible, the data are compared to existing mid-rapidity charged-particle (predominantly π±) and prompt D0-meson results. In addition, the dependence of the J/ψ v2coefficient on the initial-state conditions is studied with the Event Shape
Engineering (ESE) technique [30]. Fluctuations in the initial-state energy density distribution lead to event-by-event variations of the flow observed at a given centrality [31]. The ESE technique consists of selecting events with the same centrality but different flow and therefore initial-state geometry eccentric-ity [32, 33]. Recently, the ESE technique has been applied to the measurement of mid-rapideccentric-ity D-meson production in Pb–Pb collisions at√sNN = 5.02 TeV [34]. The obtained results indicate a correlation
between the D-meson azimuthal anisotropy and the flow of light-flavoured particles.
The J/ψ mesons are reconstructed at forward rapidity (2.5 < y < 4.0) via their µ+µ− decay channel. The measured J/ψ mesons originate from both prompt J/ψ (direct and from decays of higher-mass char-monium states) and non-prompt J/ψ (feed down from b-hadron decays) production.
This letter is organized as follows. A brief description of the ALICE apparatus and the data sample used is given in Sec. 2. Section 3 outlines the employed analysis technique. The evaluation of the systematic uncertainties is discussed in Sec. 4, while the results are reported in Sec. 5. Finally, conclusions are presented in Sec. 6.
2 Experimental setup and data sample
The ALICE detectors essential for the present analysis are briefly described below. A full overview of the ALICE apparatus and its performance can be found in Refs. [35, 36]. The muon spectrometer, which covers the pseudorapidity range -4 < η < -2.5, is used to reconstruct muon tracks. The spectrometer consists of a front absorber followed by five tracking stations. The third station is placed inside a dipole magnet. The tracking stations are complemented by two trigger stations located downstream behind an iron wall. The Silicon Pixel Detector (SPD) [37] is employed to reconstruct the position of the primary vertex and to determine the flow direction. The SPD consists of two cylindrical layers covering |η| < 2.0 and |η| < 1.4, respectively. It is placed in the central barrel of ALICE. The central barrel is operated inside a solenoidal magnetic field parallel to the beam line. The SPD is also used to reconstruct the so-called tracklets, track segments formed by the clusters in the two SPD layers and the primary vertex [38]. The V0 detector [39] consists of two arrays of 32 scintillator counters each, covering 2.8 < η < 5.1 (V0A) and -3.7 < η < -1.7 (V0C), respectively. It provides the minimum-bias (MB) trigger and is used for event selection and determination of collision centrality [40]. In addition, two tungsten-quartz neutron Zero Degree Calorimeters (ZDCs), installed 112.5 meters from the interaction point along the beam line on each side, are used for event selection.
The present analysis is based on the data sample of Pb–Pb collisions collected by ALICE in 2015 at √
sNN = 5.02 TeV. The trigger required coincidence of MB and dimuon triggers. The MB trigger was
provided by the V0 detector requesting signals in both V0A and V0C arrays. The dimuon unlike-sign trigger required at least a pair of opposite-sign track segments in the muon trigger stations. The transverse momentum threshold of the trigger algorithm was set such that the efficiency for muon tracks with pT
= 1 GeV/c is 50%. The sample of single muons or like-sign dimuons were collected using the same trigger algorithm, but requiring at least one track segment or at least a pair of like-sign track segments, respectively. The integrated luminosity of the analyzed data sample is about 225 µb−1.
The beam-induced background is filtered out offline by applying a selection based on the V0 and the ZDC timing information [41]. The interaction pile-up is removed by exploiting the correlations between the number of clusters in the SPD, the number of reconstructed SPD tracklets and the total signal in the V0A and V0C detectors. The primary vertex position is required to be within ±10 cm from the nominal interaction point along the beam direction. The data are split in intervals of collision centrality, which is obtained based on the total signal in the V0A and V0C detectors [40].
The muon selection is identical to that used in Ref. [20]. The dimuons are reconstructed in the acceptance of the muon spectrometer (2.5 < y < 4.0) and are required to have a transverse momentum between 0 and 12 GeV/c.
3 Analysis
The flow coefficients vnof the selected dimuons are measured using the scalar product (SP) method [2,
42], in which they are calculated from the expression
vn{SP} = hhunQSPD∗n ii Rn , Rn= s hQSPD n QV0A∗n ihQSPDn QV0C∗n i hQV0A n QV0C∗n i , (2)
where un = exp(inϕ) is the unit flow vector of the dimuon, QSPDn , QV0An and QV0Cn are the event flow
vectors measured in the SPD, V0A and V0C detectors, respectively, and n is the harmonic number. The brackets h· · · i denote an average over all events, the double brackets hh· · · ii an average over all particles in all events, and ∗ the complex conjugate. The SPD event flow vector QSPDn is calculated from the azimuthal distribution of the reconstructed SPD tracklets. The V0A and V0C event flow vectors QV0An and QV0Cn are calculated from the azimuthal distribution of the signal in the V0 detector. The components of all three event flow vectors are corrected for non-uniform detector acceptance and efficiency using a recentering procedure (i.e. by subtracting of the Qn-vector averaged over many events from the Qn-vector
of each event) [43]. The denominator Rn in the above equation is called resolution and is obtained as a
function of collision centrality. The gap in pseudorapidity between unand QSPDn (|∆η| > 1.0) suppresses
short-range correlations (“non-flow”), which are unrelated to the azimuthal asymmetry in the initial geometry and come from jets and resonance decays [19]. In the following, the vn{SP} coefficients are
denoted as vn.
The J/ψ flow coefficients are extracted by a fit of the superposition of the J/ψ signal and the background to the dimuon flow coefficients as a function of the dimuon invariant mass [44]
vn(Mµ µ) = NJ/ψ NJ/ψ+ NB +− vJ/ψn + N+−B NJ/ψ+ NB +− vBn(Mµ µ), (3)
where vJ/ψn is the flow coefficient of the signal and vBn is the Mµ µ-dependent flow coefficient of the
background. The NJ/ψ and N+−B are the signal and the background dimuon yields, respectively, as a function of Mµ µ. They are obtained by fitting the Mµ µ distribution with a mixture of an extended Crystal
Ball (CB2) function for the J/ψ signal and a Variable-Width Gaussian (VWG) function for the back-ground [45]. The J/ψ peak position and width are left free, while the CB2 tail parameters are fixed to the values reported in Ref. [46]. The statistical uncertainties of NJ/ψ and N+−B are not considered in the fit of vn(Mµ µ), given their negligible contribution to the statistical uncertainty of the v
J/ψ
ψ (2S) signal is not included in the fit of vn(Mµ µ) because of its extremely low significance in central
and semi-central collisions.
In previous measurements [19, 20], the Mµ µ dependence of the background flow coefficients was
pa-rameterized by an arbitrary function. This approach leads to an increase of the statistical uncertainty of the J/ψ flow coefficients, because the parameters of the function are not fixed. Moreover, an additional systematic uncertainty arises from the fact that the functional form of the background distribution is un-known. In the present analysis, we adopt a different approach. It is known that, in collisions of heavy ions, the dimuon background in the vicinity of the J/ψ is mostly combinatorial and can be described satisfactorily with the event-mixing technique [9, 17]. This technique consists in forming dimuons by combining muons from two different events having similar collision centrality. The flow coefficients of the combinatorial background are fully determined by the flow coefficients of the single muons from which the background dimuons are formed. One can show that for any given kinematical configuration of the background dimuon, its flow coefficients can be expressed as
vBn(Mµ µ) =
hv(1)n (p(1)T , η1) cos[n(ϕ1− ϕ)] + v(2)n (p(2)T , η2) cos[n(ϕ2− ϕ)]iMµ µ h1 + 2 ∑∞ m=1 v(1)m (p(1)T , η1)v (2) m (p (2) T , η2) cos[m(ϕ1− ϕ2)]iMµ µ , (4) where v(1)n (p (1) T , η1) and v (2) n (p (2)
T , η2) are the flow coefficients of the two muons as a function of their
transverse momenta and pseudorapidities, ϕ1and ϕ2are the azimuthal angles of the two muons and ϕ is
the azimuthal angle of the dimuon. The brackets h· · · iMµ µ denote an average over all dimuons (p
(1) T , p
(2) T ,
η1, η2, ϕ1, ϕ2) that belong to any given Mµ µ interval. The details on the derivation of Eq.(4) are given
in appendix A. In case of the event mixing, the numerator in Eq. (4) is calculated as
Du(1)n Q(1),SPDn R(1)n cos(n(ϕ1− ϕ)) + u(2)n Q (2),SPD n R(2)n cos(n(ϕ2− ϕ)) E Mµ µ , (5) where u(1)n and u (2)
n are the unit vector of the two muons, Q (1) n and Q
(2)
n are the SPD flow vectors for the
events containing the two muons, and R(1)n and R (2)
n are their resolutions. The brackets h· · · iMµ µ denote an average over all mixed-event dimuons belonging to any given Mµ µ interval. The denominator in Eq. (4)
reflects the modification of the dimuon yield due to the flow of single muons. Since the event flow vectors of the two mixed events are not correlated, the mixed-event dimuon yield is not modified by the single muon flow. Thus, the denominator is obtained directly as the ratio NB
+−/N+−mix, where N+−mixis the
number of mixed-event unlike-sign dimuons as a function of Mµ µ. The ratio is calculated after a proper
normalization of N+−mixusing the like-sign dimuons from the same and mixed events. The normalization factor is obtained as [17] R Mµ µ N+−mix r Nsame ++ N−−same Nmix ++N−−mix dMµ µ R Mµ µ N+−mixdMµ µ , (6) where Nsame
++ (N−−same) and N++mix(N−−mix) are the numbers of like-sign (positive and negative charges)
same-event and mixed-same-event dimuons, respectively. The integral is calculated in the invariant mass interval between 2.2 and 4.5 GeV/c2. Assuming a purely combinatorial background, the vBn(Mµ µ) coefficient,
obtained with the event-mixing procedure described above, is used directly in order to fix the background term of the fit from Eq. (3). All the analysis steps discussed in this section are performed separately in each considered dimuon transverse momentum and centrality interval. The event mixing and the normalization of N+−mixare done in 5%-wide collision centrality intervals.
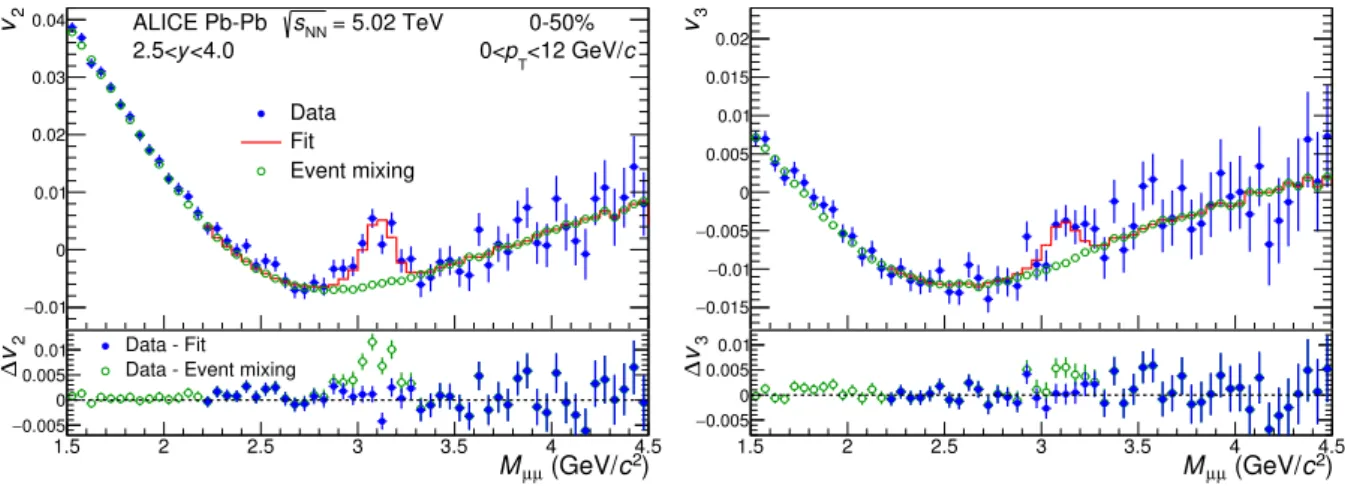
Examples of the Mµ µfit and the mixed-event distribution N+−mixas a function of Mµ µ in several centrality
the dimuon background on a percent level with a residual difference presumably originating from the single muon flow. However, at high pT, this difference becomes much larger (up to ≈ 35% in the
vicinity of the J/ψ mass in 8 < pT < 12 GeV/c and 30–50% centrality interval) and goes beyond a
possible single muon flow contribution. This points to the presence of a correlated dimuon background. Such a background is believed to originate from production of heavy-flavor quark pairs and to become significant in semi-central and peripheral collisions at high pT[47, 48].
Examples of the v2(Mµ µ) fit based on the analysis approach described above are presented in Fig. 2. As
can be seen, the fit performs quite satisfactorily, with the mixed-event v2coefficient being able to describe
the shape and amplitude of the background v2in the entire considered invariant mass interval from 1.5 to
4.5 GeV/c2. This is not surprising at low and intermediate pT, where the mixed-event dimuon distribution
describes rather precisely the background dimuon distribution (top and middle panels in Figs. 1 and 2). Remarkably, however, the mixed-event approach performs satisfactorily also at high pT in semi-central
collisions, where the contribution of the correlated background is significant (bottom right panels in Figs. 1 and 2). Given that the denominator in Eq. (4) is obtained as the ratio N+−B /N+−mix, this means that
the flow coefficient of the correlated background is significantly lower than that of the combinatorial one. The systematic effect arising from the presence of the correlated background and the corresponding uncertainties are discussed in Section 4. The approach described above performs equally well also in case of the v3 coefficient. This is illustrated in Fig.3, where the fits of the centrality and pT-integrated
v2(Mµ µ) and v3(Mµ µ) distributions are compared.
The Event Shape Engineering (ESE) technique is performed following the procedure described in Ref. [33]. It is based on the magnitude of the second-order reduced V0A event flow vector defined as in Ref. [42]
qV0A2 =|Q
V0A
2 |
√
SV0A, (7)
where |QV0A2 | is the magnitude of the second-order V0A event flow vector and SV0A is the total signal
in the V0A detector. The large pseudorapidity gap between the V0A and the muon spectrometer (|∆η| > 5.3) greatly suppresses the non-flow contribution and guarantees a proper event-shape selection. Two event-shape classes with the lowest and highest qV0A2 values corresponding to the 0–20% and 80–100% intervals, respectively, are investigated for the 5–40% centrality interval.
4 Systematic uncertainties
The systematic effect related to the presence of correlated background is checked by modifying the definition of the background coefficient v2B(Mµ µ). The ratio N+−B /N+−mix is replaced by N+−B /(N+−mix+
α (N+−B − N+−mix)), where the parameter α represents the strength of the flow of the correlated background. The value of 0 corresponds to the default approach (e.g. assuming negligible flow of the correlated background), while the value of 1 corresponds to the assumption that the correlated background has the same flow coefficient as compared to the combinatorial background. The parameter α is left free in the fit of Eq. (3) and the differences in the resulting J/ψ v2with respect to the default approach are taken as
systematic uncertainties. As expected, in central (0–10%) collisions and at low transverse momentum, the uncertainties are practically negligible. In semi-central (30–50% centrality interval) collisions and in the highest considered transverse momentum interval (8 < pT < 12 GeV/c), the uncertainty of the
J/ψ v2 reaches 0.013. The parameter α is found to be well below 1 in all centrality and pT intervals.
The corresponding systematic uncertainty of the J/ψ v3coefficient is in general significantly smaller. No
clear pattern is found as a function of collision centrality and pT. Conservatively, the parameter α is fixed
to 1 and the difference in the results with respect to the ones obtained with default value of 0 is taken as systematic uncertainty. It is worth noting that even though the fraction of correlated background at high pTin semi-central collisions is significant, its effect on the J/ψ flow coefficients is suppressed by the high
1.5 2 2.5 3 3.5 4 4.5 2 c Counts / 50 MeV/ 50 100 150 200 250 300 350 400 450 3 10 × Data Total fit Signal fit Background fit Event mixing = 5.02 TeV NN s ALICE Pb-Pb 0-10% <4.0 y 2.5< <2 GeV/c T p 0< ) 2 c (GeV/ µ µ M 1.5 2 2.5 3 3.5 4 4.5 Ratio 0.96 0.98 1 1.02
Data / Total fit
Data / Event mixing Background fit / Event mixing
1.5 2 2.5 3 3.5 4 4.5 2 c Counts / 50 MeV/ 50 100 150 200 250 3 10 × 10-50% c <2 GeV/ T p 0< ) 2 c (GeV/ µ µ M 1.5 2 2.5 3 3.5 4 4.5 Ratio 0.9 0.95 1 1.05 1.5 2 2.5 3 3.5 4 4.5 2 c Counts / 50 MeV/ 20 40 60 80 100 120 140 160 3 10 × 0-10% c <6 GeV/ T p 2< ) 2 c (GeV/ µ µ M 1.5 2 2.5 3 3.5 4 4.5 Ratio 0.96 0.98 1 1.02 1.04 1.5 2 2.5 3 3.5 4 4.5 2 c Counts / 50 MeV/ 20 40 60 80 100 3 10 × 10-50% c <6 GeV/ T p 2< ) 2 c (GeV/ µ µ M 1.5 2 2.5 3 3.5 4 4.5 Ratio 0.95 1 1.05 1.5 2 2.5 3 3.5 4 4.5 2 c Counts / 50 MeV/ 200 400 600 800 1000 1200 1400 1600 0-10% c <12 GeV/ T p 6< ) 2 c (GeV/ µ µ M 1.5 2 2.5 3 3.5 4 4.5 Ratio 0.9 1 1.1 1.2 1.5 2 2.5 3 3.5 4 4.5 2 c Counts / 50 MeV/ 500 1000 1500 2000 2500 10-50% c <12 GeV/ T p 6< ) 2 c (GeV/ µ µ M 1.5 2 2.5 3 3.5 4 4.5 Ratio 1 1.2 1.4
Fig. 1: (Color online) The Mµ µ distribution in low (top panels), intermediate (middle panels) and high (bottom panels) pT intervals for central (left panels) and semi-central (right panels) collisions. The data are fitted to a combination of an extended Crystal Ball (CB2) function for the signal and a Variable-Width Gaussian (VWG) function for the background. The distributions are compared to the ones obtained with the event-mixing technique (see text for details). Only statistical uncertainties are shown.
term is present in vB2. Its estimated contribution is added to the fit to the v2(Mµ µ) distribution and the
change in the J/ψ v2results with respect to the default approach is taken as systematic uncertainty. These
uncertainties are found to be sizable only in 0 < pT < 2 GeV/c and 10–50% centrality interval, where
1.5 2 2.5 3 3.5 4 4.5 2 v 0.01 − 0 0.01 0.02 0.03 0.04 Data Fit Event mixing = 5.02 TeV NN s ALICE Pb-Pb 0-10% <4.0 y 2.5< <2 GeV/c T p 0< ) 2 c (GeV/ µ µ M 1.5 2 2.5 3 3.5 4 4.5 2 v ∆ 0.01 − 0 0.01 0.02
Data - Fit Data - Event mixing 1.5 2 2.5 3 3.5 4 4.5
2 v 0.03 − 0.02 − 0.01 − 0 0.01 0.02 0.03 0.04 10-50% c <2 GeV/ T p 0< ) 2 c (GeV/ µ µ M 1.5 2 2.5 3 3.5 4 4.5 2 v ∆ 0.01 − 0 0.01 0.02 1.5 2 2.5 3 3.5 4 4.5 2 v 0.01 − 0 0.01 0.02 0.03 0.04 0.05 0.06 0-10% c <6 GeV/ T p 2< ) 2 c (GeV/ µ µ M 1.5 2 2.5 3 3.5 4 4.5 2 v ∆ 0.01 − 0 0.01 0.02 1.5 2 2.5 3 3.5 4 4.5 2 v 0 0.02 0.04 0.06 0.08 0.1 0.12 10-50% c <6 GeV/ T p 2< ) 2 c (GeV/ µ µ M 1.5 2 2.5 3 3.5 4 4.5 2 v ∆ 0.01 − 0 0.01 0.02 0.03 1.5 2 2.5 3 3.5 4 4.5 2 v 0.15 − 0.1 − 0.05 − 0 0.05 0.1 0.15 0.2 0-10% c <12 GeV/ T p 6< ) 2 c (GeV/ µ µ M 1.5 2 2.5 3 3.5 4 4.5 2 v ∆ 0.1 − 0.05 − 0 0.05 0.1 1.5 2 2.5 3 3.5 4 4.5 2 v 0.1 − 0.05 − 0 0.05 0.1 0.15 0.2 10-50% c <12 GeV/ T p 6< ) 2 c (GeV/ µ µ M 1.5 2 2.5 3 3.5 4 4.5 2 v ∆ 0.05 − 0 0.05 0.1
Fig. 2: (Color online) The v2(Mµ µ) distribution in low (top panels), intermediate (middle panels) and high (bottom panels) pTintervals for central (left panels) and semi-central (right panels) collisions. The data are fitted with the function from Eq. 3, where the background coefficient vB2(Mµ µ) is fixed using the event-mixing procedure. The background coefficient vB2(Mµ µ) alone down to 1.5 GeV/c2 is also presented. Only statistical uncertainties are shown.
The systematic uncertainty related to the signal-to-background ratio NJ/ψ/N+−B in Eq. (3) is estimated by varying the signal tails (e.g. the parameters describing the tails of the CB2 function, employed to fit the signal peak), the background fit functions and the fit range [19, 20]. The obtained uncertainties are up to 0.001.
1.5 2 2.5 3 3.5 4 4.5 2 v 0.01 − 0 0.01 0.02 0.03 0.04 Data Fit Event mixing = 5.02 TeV NN s ALICE Pb-Pb 0-50% <4.0 y 2.5< <12 GeV/c T p 0< ) 2 c (GeV/ µ µ M 1.5 2 2.5 3 3.5 4 4.5 2 v ∆ 0.005 − 0 0.005 0.01 Data - Fit Data - Event mixing
1.5 2 2.5 3 3.5 4 4.5 3 v 0.015 − 0.01 − 0.005 − 0 0.005 0.01 0.015 0.02 ) 2 c (GeV/ µ µ M 1.5 2 2.5 3 3.5 4 4.5 3 v ∆ 0.005 − 0 0.005 0.01
Fig. 3: (Color online) The v2(Mµ µ) (left panel) and v3(Mµ µ) (right panel) distributions in the 0–50% centrality and 0 < pT< 12 GeV/c. The distributions are fitted with the function from Eq. 3, where the background coefficients vB2(Mµ µ) and vB3(Mµ µ) are fixed using the event-mixing procedure. The background coefficients alone down to 1.5 GeV/c2are also presented. Only statistical uncertainties are shown.
The effect of any residual non-uniform detector acceptance and efficiency in the calculation of the SPD event flow vector is checked via the imaginary part of the scalar product defined in Eq. (2) [49]. No systematic uncertainty is assigned as the terms are consistent with zero within statistical uncertainties. The resolution of the SPD event flow vector is calculated from the events containing at least one selected dimuon by default. Alternatively, it is calculated from all events recorded with the MB trigger and passing the offline event selection, as well as from the events containing at least one selected single muon. Differences up to 1% and 2% with respect to the default approach are observed for R2 and R3,
respectively, and are taken as systematic uncertainties. For the event-shape classes, a bias can arise from auto-correlations due to the usage of the V0A event flow vector for both q2and R2. This potential bias
is assessed by replacing the ratio hQSPDn QV0A∗n i/hQV0A
n QV0C∗n i in Eq. 2 with the one from the unbiased
data sample. The resulting effect is smaller than 1% and is neglected.
The muon spectrometer occupancy affects the reconstruction efficiency and thus can bias (lower) the measured vncoefficients. The reconstruction efficiency as a function of centrality is taken from Ref. [11],
where it is obtained by embedding simulated J/ψ → µ+µ− decays into real Pb–Pb events. It is found to decrease linearly with the signal in the V0C detector SV0C, which largely covers the geometrical
acceptance of the muon spectrometer. Thus, the systematic deviations of the J/ψ vnare calculated as the
product of the single muon vn, the first derivative of the reconstruction efficiency with respect to SV0C
and the mean hSV0Ci in the considered centrality interval. The single muon v
n coefficients are obtained
with the same SP approach as the one employed for J/ψ. Conservatively, the maximum of the single muon vnas a function of pT is used. The typical values of these systematic deviations are found to be up
to 0.0025 and 0.0015 for the J/ψ v2and v3, respectively. Given the small magnitude of the effect, we do
not correct the measured coefficients, but take the above deviations as systematic uncertainties.
5 Results
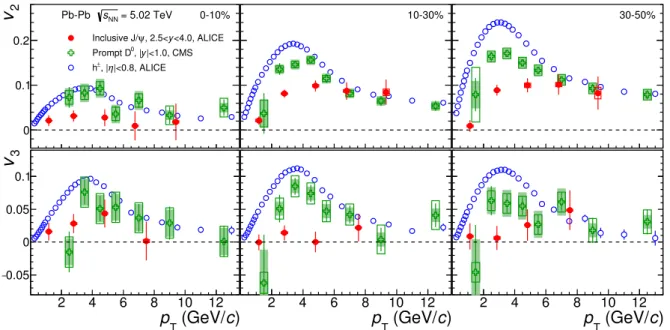
Figure 4 shows the measured J/ψ v2 and v3coefficients as a function of the transverse momentum for
three centrality intervals. The results are compared to the v2and v3coefficients of charged particles [50]
and prompt D0 mesons [23] at mid-rapidity obtained with the SP method and a pseudo-rapidity gap |∆η| > 2.0 between the particle of interest and the kinematic interval of the event flow vector calculation. At low and intermediate pT, up to 6 GeV/c, one can observe a clear ordering with vn(J/ψ) < vn(D0) <
2 4 6 8 10 12 2
v
0 0.1 0.2 Inclusive J/ψ, 2.5<y<4.0, ALICE |<1.0, CMS y , | 0 Prompt D |<0.8, ALICE η , | ± h = 5.02 TeV NN s Pb-Pb 0-10% 2 4 6 8 10 12 0 0.1 0.2 10-30% 2 4 6 8 10 12 0 0.1 0.2 30-50% ) c (GeV/ T p 2 4 6 8 10 12 3v
0.05 − 0 0.05 0.1 ) c (GeV/ T p 2 4 6 8 10 12 0.05 0 0.05 0.1 ) c (GeV/ T p 2 4 6 8 10 12 0.05 0 0.05 0.1Fig. 4: (Color online) The J/ψ v2(upper panels) and v3(bottom panels) coefficients as a function of pTin three centrality intervals (from left to right) in Pb–Pb collisions at√sNN= 5.02 TeV. The results are compared to the v2 and v3coefficients of mid-rapidity charged particles [50] and prompt D0mesons [23]. Statistical and systematic uncertainties are shown as bars and boxes, respectively. The shaded bands represent the systematic uncertainties from the contribution of non-prompt D0mesons.
vn(h±) (n = 2, 3). At high pT, above 6-8 GeV/c, the v2 results indicate a convergence between charged
particles, prompt D0 mesons and J/ψ. Such an observation suggests that, at high pT, the azimuthal
asymmetry of the J/ψ mesons as well as that of charged particles and prompt D0 mesons is possibly governed by in-medium path-length dependent energy-loss effects.
Discussing the above observations, should be noted the different rapidity interval of the J/ψ measure-ment. The effect of the decorrelation of the symmetry plane angles Ψn(n = 2, 3) between mid and
for-ward pseudorapidity has been estimated to be less than 1% and 3% for v2and v3, respectively [51, 52].
An η dependence of the pT-integrated vncoefficients for charged particles has been observed in Pb–Pb
collisions at√sNN = 2.76 TeV [53]. However, the ratio v3/v2 has shown no significant dependence on
η . Furthermore, the pT-differential v2 was found to be independent of η (up to |η| < 2.4) [54], thus
indicating that the η dependence of the pT-integrated v2 arises mainly from changes in the transverse
momentum spectra.
The presented results are for inclusive J/ψ and therefore the comparison to D0-meson results can be influenced by the considerable fraction of non-prompt J/ψ from b-hadron decays at intermediate and high transverse momentum [55, 56]. Finally, the J/ψ v2at intermediate and high transverse momentum
can contain an additional contribution arising from a strong magnetic field at the initial stages of the collision, as suggested in Ref. [57].
The present analysis of the J/ψ v2 coefficient, performed in the centrality intervals used in Ref. [19],
yields consistent results. The main improvement with respect to the measurement in Ref. [19] is the up to 15% reduction of the statistical uncertainties due to the event-mixing approach described in Section 3. In Fig. 4, the J/ψ v3 is positive in most of the intervals, although it is also compatible with zero given
the large uncertainties. A positive value of v3is found integrating the data over the centrality intervals,
as seen in Fig. 5. The Fisher’s combined probability test [58] is used to quantify the probability that J/ψ v3is zero. The data in all pTintervals are treated as independent measurements. The statistical and
) c (GeV/ T p 0 2 4 6 8 3 v 0 0.01 0.02 0.03 0.04 ALICE Pb-Pb sNN = 5.02 TeV ψ Inclusive J/ <4.0 y 2.5< 0-50%
Fig. 5: (Color online) The J/ψ v3coefficient as a function of pTin the 0–50% centrality interval in Pb–Pb collisions at√sNN= 5.02 TeV. Statistical and systematic uncertainties are shown as bars and boxes, respectively.
) c (GeV/ T p 2 4 6 8 10 12 2 v/3 v 0 0.5 1 = 5.02 TeV NN s Pb-Pb 5-40% ) c (GeV/ T p 2 4 6 8 10 12 <4.0, ALICE y , 2.5< ψ Inclusive J/ |<1.0, CMS y , | 0 Prompt D |<0.8, ALICE η , | ± h 10-50%
Fig. 6: (Color online) The J/ψ v3/v2ratio as a function of pTin the 5–40% (left panel) and 10–50% (right panel) centrality intervals in Pb–Pb collisions at√sNN = 5.02 TeV. The results are compared to those of mid-rapidity charged particles [50] and prompt D0mesons [23]. Statistical and systematic uncertainties are shown as bars and boxes, respectively. The shaded bands represent the systematic uncertainties from the contribution of non-prompt D0mesons.
systematic uncertainties are added in quadrature. The total combined probability of the zero hypothesis is found to be 1.23×10⁻⁴, which corresponds to about 3.7σ significance of the measured positive J/ψ v3
coefficient.
The flow coefficients of the J/ψ, prompt D0mesons and charged particles are further compared in Fig. 6, where the ratio v3/v2 is shown as a function of pT. In order to increase the significance of the ratio, the
central collisions (0–5% and 0–10% centrality intervals), where v2 has small magnitude, are excluded.
The uncertainties of v2 and v3 coefficients are considered uncorrelated due to the weak correlation
be-tween the Ψ2 and Ψ3 angles [59]. Taking into account all pT intervals, the obtained J/ψ v3/v2 ratio is
found to be significantly lower (4.6σ ) with respect to that of charged particles. Moreover, at intermediate pT between 2 and 6 GeV/c, the prompt D0-mesons v3/v2 ratio is 2.3σ below that of charged particles
and 3.4σ above that of the J/ψ mesons. Thus, the data seem to suggest an ordering similar to the one observed for the v2 and v3 coefficients in semi-central collisions. It is interesting to note that, in
con-) c (GeV/ T p 2 4 6 8 10 2 v 0 0.05 0.1 0.15 0.2 Unbiased V0A 2 q 20% low-V0A 2 q 20% = 5.02 TeV NN s ALICE Pb-Pb <4.0 y , 2.5< ψ Inclusive J/ 5-40% ) c (GeV/ T p 2 4 6 8 10 (unbiased)2 v )/ V0A 2 q (low/high-2 v 1 − 0 1 2 V0A 2 low-q ψ J/ V0A 2 high-q ψ J/ σ 1 ± : Fit V0A 2 low-q ψ J/ σ 1 ± : Fit V0A 2 high-q ψ J/ V0A 2 low-q ± µ V0A 2 high-q ± µ = 5.02 TeV NN s ALICE Pb-Pb <4.0 y 2.5< 5-40%
Fig. 7: (Color online) Left: The J/ψ v2as a function of pTfor shape selected and unbiased samples in the 5–40% centrality interval in Pb–Pb collisions at√sNN= 5.02 TeV. Points are slightly shifted along the horizontal axis for better visibility. Statistical and systematic uncertainties are shown as bars and boxes, respectively. Right: Ratio of the J/ψ v2in lowest and highest qV0A2 event-shape classes and the unbiased sample. The shaded bands represent the result with a constant function ±1σ . The J/ψ results are compared to the ratios for the single muons v2obtained with the same event-shape classes.
trast, the mass ordering of v2 and v3 seen for light-flavored particles is strongly suppressed in the ratio
v3/v2[27].
The left panel of Fig. 7 presents the J/ψ v2 as a function of pT for event-shape selected and unbiased
events in the 5–40% centrality interval. The systematic uncertainties of the results from the event-shape selected and unbiased events are considered fully correlated and therefore cancel out in the ratios shown in the right panel of Fig. 7. The values of the J/ψ v2 coefficient in low (high) qV0A2 event classes are
found to be lower (higher) with respect to those in the unbiased events. The v2 coefficient of single
muons is also measured in the same event-shape selected and unbiased samples. The corresponding ratios between the results in the event-shape selected and unbiased events show no pT dependence up to
10 GeV/c (Fig. 7, right panel). This behavior demonstrates that the applied ESE technique based on qV0A2 allows the selection of a global property of the collisions, most likely linked to the eccentricity ε2of the
initial-state geometry [33]. The mean values of the ratios for single muons v2{low-qV0A2 }/v2{unbiased}
and v2{high-qV0A2 }/v2{unbiased} are estimated from a fit with constant and are found to be 0.87 and
1.15, respectively. These values reflect the sensitivity of the V0A-based event-shape selection. The corresponding mean values of the J/ψ ratios, 0.79±0.14 and 1.35±0.14, are consistent with the muon ratios. This implies that the J/ψ v2results are compatible with the expected variations of the eccentricity
of the initial-state geometry within the uncertainties.
6 Conclusions
In summary, the elliptic and triangular flow coefficients of inclusive J/ψ mesons at forward rapidity have been measured in Pb–Pb collisions at√sNN = 5.02 TeV over a broad range of transverse momentum and in various centrality intervals. This is the first measurement of the v3coefficient for inclusive J/ψ
production, indicating a positive value with 3.7σ significance for 0 < pT< 12 GeV/c.
The obtained inclusive J/ψ v2 and v3 coefficients as well as the ratio v3/v2 are compared to the results
results exhibit an ordering with the charged particles having largest values, followed by the prompt D0 mesons and finally the J/ψ having the smallest values. In semi-central collisions at intermediate pT, the
J/ψ v3/v2ratio is found to be significantly lower compared to that of charged particles. Despite the large
uncertainties, the values of the prompt D0ratio are somewhat lower than the charged particles and higher than the J/ψ mesons, hinting at a possible ordering similar to that observed for the v2and v3coefficients.
At high pT, the v2 of the charged particles, the prompt D0 mesons and the J/ψ seem to converge to
similar values. The uncertainties of the v3coefficients do not allow one to draw firm conclusions about
their convergence, although the centrality- and pT-integrated J/ψ v3is compatible with that of high-pT
charged particles.
The analysis using Event Shape Engineering technique shows that the J/ψ v2 coefficients increase
(de-crease) for classes of events with high (low) reduced event flow vector. Compared to single muons reconstructed in the same rapidity interval, the J/ψ results are found compatible with the expected varia-tions of the eccentricity of the initial-state geometry.
Acknowledgements
The ALICE Collaboration would like to thank all its engineers and technicians for their invaluable con-tributions to the construction of the experiment and the CERN accelerator teams for the outstanding performance of the LHC complex. The ALICE Collaboration gratefully acknowledges the resources and support provided by all Grid centres and the Worldwide LHC Computing Grid (WLCG) collaboration. The ALICE Collaboration acknowledges the following funding agencies for their support in building and running the ALICE detector: A. I. Alikhanyan National Science Laboratory (Yerevan Physics Institute) Foundation (ANSL), State Committee of Science and World Federation of Scientists (WFS), Arme-nia; Austrian Academy of Sciences and Nationalstiftung f¨ur Forschung, Technologie und Entwicklung, Austria; Ministry of Communications and High Technologies, National Nuclear Research Center, Azer-baijan; Conselho Nacional de Desenvolvimento Cient´ıfico e Tecnol´ogico (CNPq), Universidade Federal do Rio Grande do Sul (UFRGS), Financiadora de Estudos e Projetos (Finep) and Fundac¸˜ao de Am-paro `a Pesquisa do Estado de S˜ao Paulo (FAPESP), Brazil; Ministry of Science & Technology of China (MSTC), National Natural Science Foundation of China (NSFC) and Ministry of Education of China (MOEC) , China; Ministry of Science and Education, Croatia; Centro de Aplicaciones Tecnol´ogicas y Desarrollo Nuclear (CEADEN), Cubaenerg´ıa, Cuba; Ministry of Education, Youth and Sports of the Czech Republic, Czech Republic; The Danish Council for Independent Research — Natural Sciences, the Carlsberg Foundation and Danish National Research Foundation (DNRF), Denmark; Helsinki In-stitute of Physics (HIP), Finland; Commissariat `a l’Energie Atomique (CEA) and Institut National de Physique Nucl´eaire et de Physique des Particules (IN2P3) and Centre National de la Recherche Sci-entifique (CNRS), France; Bundesministerium f¨ur Bildung, Wissenschaft, Forschung und Technologie (BMBF) and GSI Helmholtzzentrum f¨ur Schwerionenforschung GmbH, Germany; General Secretariat for Research and Technology, Ministry of Education, Research and Religions, Greece; National Re-search, Development and Innovation Office, Hungary; Department of Atomic Energy Government of India (DAE), Department of Science and Technology, Government of India (DST), University Grants Commission, Government of India (UGC) and Council of Scientific and Industrial Research (CSIR), In-dia; Indonesian Institute of Science, Indonesia; Centro Fermi - Museo Storico della Fisica e Centro Studi e Ricerche Enrico Fermi and Istituto Nazionale di Fisica Nucleare (INFN), Italy; Institute for Innovative Science and Technology , Nagasaki Institute of Applied Science (IIST), Japan Society for the Promo-tion of Science (JSPS) KAKENHI and Japanese Ministry of EducaPromo-tion, Culture, Sports, Science and Technology (MEXT), Japan; Consejo Nacional de Ciencia (CONACYT) y Tecnolog´ıa, through Fondo de Cooperaci´on Internacional en Ciencia y Tecnolog´ıa (FONCICYT) and Direcci´on General de Asuntos del Personal Academico (DGAPA), Mexico; Nederlandse Organisatie voor Wetenschappelijk Onderzoek (NWO), Netherlands; The Research Council of Norway, Norway; Commission on Science and
Technol-ogy for Sustainable Development in the South (COMSATS), Pakistan; Pontificia Universidad Cat´olica del Per´u, Peru; Ministry of Science and Higher Education and National Science Centre, Poland; Korea Institute of Science and Technology Information and National Research Foundation of Korea (NRF), Republic of Korea; Ministry of Education and Scientific Research, Institute of Atomic Physics and Ro-manian National Agency for Science, Technology and Innovation, Romania; Joint Institute for Nuclear Research (JINR), Ministry of Education and Science of the Russian Federation, National Research Cen-tre Kurchatov Institute, Russian Science Foundation and Russian Foundation for Basic Research, Russia; Ministry of Education, Science, Research and Sport of the Slovak Republic, Slovakia; National Research Foundation of South Africa, South Africa; Swedish Research Council (VR) and Knut & Alice Wallen-berg Foundation (KAW), Sweden; European Organization for Nuclear Research, Switzerland; National Science and Technology Development Agency (NSDTA), Suranaree University of Technology (SUT) and Office of the Higher Education Commission under NRU project of Thailand, Thailand; Turkish Atomic Energy Agency (TAEK), Turkey; National Academy of Sciences of Ukraine, Ukraine; Science and Technology Facilities Council (STFC), United Kingdom; National Science Foundation of the United States of America (NSF) and United States Department of Energy, Office of Nuclear Physics (DOE NP), United States of America.
References
[1] J.-Y. Ollitrault, “Anisotropy as a signature of transverse collective flow,” Phys. Rev. D 46 (Jul, 1992) 229–245. https://link.aps.org/doi/10.1103/PhysRevD.46.229.
[2] S. A. Voloshin, A. M. Poskanzer, and R. Snellings, “Collective phenomena in non-central nuclear collisions,” Landolt-Bornstein 23 (2010) 293–333, arXiv:0809.2949 [nucl-ex].
[3] S. Voloshin and Y. Zhang, “Flow study in relativistic nuclear collisions by Fourier expansion of Azimuthal particle distributions,” Z. Phys. C70 (1996) 665–672, arXiv:hep-ph/9407282 [hep-ph].
[4] A. P. Mishra, R. K. Mohapatra, P. S. Saumia, and A. M. Srivastava, “Super-horizon fluctuations and acoustic oscillations in relativistic heavy-ion collisions,” Phys. Rev. C77 (2008) 064902, arXiv:0711.1323 [hep-ph].
[5] J. Takahashi, B. M. Tavares, W. L. Qian, R. Andrade, F. Grassi, Y. Hama, T. Kodama, and N. Xu, “Topology studies of hydrodynamics using two particle correlation analysis,” Phys. Rev. Lett. 103 (2009) 242301, arXiv:0902.4870 [nucl-th].
[6] B. Alver and G. Roland, “Collision-geometry fluctuations and triangular flow in heavy-ion collisions,” Phys. Rev. C 81 (May, 2010) 054905.
https://link.aps.org/doi/10.1103/PhysRevC.81.054905.
[7] B. H. Alver, C. Gombeaud, M. Luzum, and J.-Y. Ollitrault, “Triangular flow in hydrodynamics and transport theory,” Phys. Rev. C 82 (Sep, 2010) 034913.
https://link.aps.org/doi/10.1103/PhysRevC.82.034913.
[8] D. Teaney and L. Yan, “Triangularity and Dipole Asymmetry in Heavy Ion Collisions,” Phys. Rev. C83 (2011) 064904, arXiv:1010.1876 [nucl-th].
[9] ALICE Collaboration, B. Abelev et al., “J/ψ suppression at forward rapidity in Pb-Pb collisions at√sNN= 2.76 TeV,” Phys. Rev. Lett. 109 (2012) 072301, arXiv:1202.1383 [hep-ex].
[10] ALICE Collaboration, B. B. Abelev et al., “Centrality, rapidity and transverse momentum dependence of J/ψ suppression in Pb-Pb collisions at√sNN=2.76 TeV,” Phys. Lett. B734 (2014)
[11] ALICE Collaboration, J. Adam et al., “J/ψ suppression at forward rapidity in Pb-Pb collisions at√ sNN= 5.02 TeV,” Phys. Lett. B766 (2017) 212–224, arXiv:1606.08197 [nucl-ex].
[12] K. Zhou, N. Xu, Z. Xu, and P. Zhuang, “Medium effects on charmonium production at ultrarelativistic energies available at the CERN Large Hadron Collider,” Phys. Rev. C89 no. 5, (2014) 054911, arXiv:1401.5845 [nucl-th].
[13] X. Du and R. Rapp, “Sequential Regeneration of Charmonia in Heavy-Ion Collisions,” Nucl. Phys. A943 (2015) 147–158, arXiv:1504.00670 [hep-ph].
[14] M. He, R. J. Fries, and R. Rapp, “Heavy Flavor at the Large Hadron Collider in a Strong Coupling Approach,” Phys. Lett. B735 (2014) 445–450, arXiv:1401.3817 [nucl-th].
[15] P. Braun-Munzinger and J. Stachel, “(Non)thermal aspects of charmonium production and a new look at J / psi suppression,” Phys. Lett. B490 (2000) 196–202, arXiv:nucl-th/0007059 [nucl-th].
[16] A. Andronic, P. Braun-Munzinger, K. Redlich, and J. Stachel, “The statistical model in Pb-Pb collisions at the LHC,” Nucl. Phys. A904-905 (2013) 535c–538c, arXiv:1210.7724
[nucl-th].
[17] ALICE Collaboration, J. Adam et al., “Differential studies of inclusive J/ψ and ψ(2S) production at forward rapidity in Pb-Pb collisions at√sNN= 2.76 TeV,” JHEP 05 (2016) 179,
arXiv:1506.08804 [nucl-ex].
[18] A. Andronic, P. Braun-Munzinger, M. K. Koehler, and J. Stachel, “Testing charm quark thermalisation within the Statistical Hadronisation Model,” arXiv:1807.01236 [nucl-th]. [19] ALICE Collaboration, S. Acharya et al., “J/ψ elliptic flow in Pb-Pb collisions at√sNN= 5.02
TeV,” Phys. Rev. Lett. 119 no. 24, (2017) 242301, arXiv:1709.05260 [nucl-ex]. [20] ALICE Collaboration, S. Acharya et al., “Search for collectivity with azimuthal J/ψ-hadron
correlations in high multiplicity p-Pb collisions at√sNN= 5.02 and 8.16 TeV,” Phys. Lett. B780 (2018) 7–20, arXiv:1709.06807 [nucl-ex].
[21] CMS Collaboration, A. M. Sirunyan et al., “Observation of prompt J/ψ meson elliptic flow in high-multiplicity pPb collisions at√sNN= 8.16 TeV,” arXiv:1810.01473 [hep-ex].
[22] X. Du and R. Rapp, “In-Medium Charmonium Production in Proton-Nucleus Collisions,” arXiv:1808.10014 [nucl-th].
[23] CMS Collaboration, A. M. Sirunyan et al., “Measurement of prompt D0meson azimuthal anisotropy in Pb-Pb collisions at√sNN= 5.02 TeV,” Phys. Rev. Lett. 120 no. 20, (2018) 202301,
arXiv:1708.03497 [nucl-ex].
[24] ALICE Collaboration, S. Acharya et al., “D-meson azimuthal anisotropy in midcentral Pb-Pb collisions at√sNN= 5.02 TeV,” Phys. Rev. Lett. 120 no. 10, (2018) 102301, arXiv:1707.01005
[nucl-ex].
[25] F. G. Gardim, F. Grassi, M. Luzum, and J.-Y. Ollitrault, “Mapping the hydrodynamic response to the initial geometry in heavy-ion collisions,” Phys. Rev. C85 (2012) 024908, arXiv:1111.6538 [nucl-th].
[26] ALICE Collaboration, S. Acharya et al., “Energy dependence and fluctuations of anisotropic flow in Pb-Pb collisions at√sNN= 5.02 and 2.76 TeV,” JHEP 07 (2018) 103, arXiv:1804.02944
[27] ALICE Collaboration, S. Acharya et al., “Anisotropic flow of identified particles in Pb-Pb collisions at√sNN= 5.02 TeV,” JHEP 09 (2018) 006, arXiv:1805.04390 [nucl-ex]. [28] R. J. Fries, V. Greco, and P. Sorensen, “Coalescence Models For Hadron Formation From Quark
Gluon Plasma,” Ann. Rev. Nucl. Part. Sci. 58 (2008) 177–205, arXiv:0807.4939 [nucl-th]. [29] B. Betz, M. Gyulassy, M. Luzum, J. Noronha, J. Noronha-Hostler, I. Portillo, and C. Ratti,
“Cumulants and nonlinear response of high pT harmonic flow at
√
sNN= 5.02 TeV,” Phys. Rev.
C95 no. 4, (2017) 044901, arXiv:1609.05171 [nucl-th].
[30] J. Schukraft, A. Timmins, and S. A. Voloshin, “Ultra-relativistic nuclear collisions: event shape engineering,” Phys. Lett. B719 (2013) 394–398, arXiv:1208.4563 [nucl-ex].
[31] ALICE Collaboration, B. Abelev et al., “Anisotropic flow of charged hadrons, pions and (anti-)protons measured at high transverse momentum in Pb-Pb collisions at√sNN=2.76 TeV,”
Phys. Lett.B719 (2013) 18–28, arXiv:1205.5761 [nucl-ex].
[32] ATLAS Collaboration, G. Aad et al., “Measurement of the correlation between flow harmonics of different order in lead-lead collisions at√sNN=2.76 TeV with the ATLAS detector,” Phys. Rev.
C92 no. 3, (2015) 034903, arXiv:1504.01289 [hep-ex].
[33] ALICE Collaboration, J. Adam et al., “Event shape engineering for inclusive spectra and elliptic flow in Pb-Pb collisions at√sNN= 2.76 TeV,” Phys. Rev. C93 no. 3, (2016) 034916,
arXiv:1507.06194 [nucl-ex].
[34] ALICE Collaboration, S. Acharya et al., “Event-shape engineering for the D-meson elliptic flow in mid-central Pb-Pb collisions at√sNN= 5.02 TeV,” arXiv:1809.09371 [nucl-ex].
[35] ALICE Collaboration, K. Aamodt et al., “The ALICE experiment at the CERN LHC,” JINST 3 (2008) S08002.
[36] ALICE Collaboration, B. Abelev et al., “Performance of the ALICE Experiment at the CERN LHC,” Int. J. Mod. Phys. A29 (2014) 1430044, arXiv:1402.4476 [nucl-ex].
[37] ALICE Collaboration, K. Aamodt et al., “Alignment of the ALICE Inner Tracking System with cosmic-ray tracks,” JINST 5 (2010) P03003, arXiv:1001.0502 [physics.ins-det].
[38] ALICE Collaboration, J. Adam et al., “Charged-particle multiplicities in proton-proton collisions at√s= 0.9 to 8 TeV,” Eur. Phys. J. C77 no. 1, (2017) 33, arXiv:1509.07541 [nucl-ex]. [39] ALICE Collaboration, E. Abbas et al., “Performance of the ALICE VZERO system,” JINST 8
(2013) P10016, arXiv:1306.3130 [nucl-ex].
[40] ALICE Collaboration, J. Adam et al., “Centrality dependence of the charged-particle multiplicity density at midrapidity in Pb-Pb collisions at√sNN= 5.02 TeV,” Phys. Rev. Lett. 116 no. 22,
(2016) 222302, arXiv:1512.06104 [nucl-ex].
[41] ALICE Collaboration, B. Abelev et al., “Centrality determination of Pb-Pb collisions at√sNN=
2.76 TeV with ALICE,” Phys. Rev. C88 no. 4, (2013) 044909, arXiv:1301.4361 [nucl-ex]. [42] STAR Collaboration, C. Adler et al., “Elliptic flow from two and four particle correlations in
Au+Au collisions at√sNN= 130 GeV,” Phys. Rev. C66 (2002) 034904,
arXiv:nucl-ex/0206001 [nucl-ex].
[43] I. Selyuzhenkov and S. Voloshin, “Effects of nonuniform acceptance in anisotropic flow measurements,” Phys. Rev. C 77 (2008) 034904.
[44] N. Borghini and J. Y. Ollitrault, “Azimuthally sensitive correlations in nucleus-nucleus collisions,” Phys. Rev.C70 (2004) 064905, arXiv:nucl-th/0407041 [nucl-th].
[45] ALICE Collaboration, “Quarkonium signal extraction in ALICE,”. https://cds.cern.ch/record/2060096. ALICE-PUBLIC-2015-006.
[46] ALICE Collaboration, S. Acharya et al., “Energy dependence of forward-rapidity J/ψ and ψ(2S) production in pp collisions at the LHC,” Eur. Phys. J. C77 no. 6, (2017) 392, arXiv:1702.00557 [hep-ex].
[47] ALICE Collaboration, J. Adam et al., “φ -meson production at forward rapidity in p-Pb collisions at√sNN= 5.02 TeV and in pp collisions at√s= 2.76 TeV,” Phys. Lett. B768 (2017) 203–217, arXiv:1506.09206 [nucl-ex].
[48] STAR Collaboration, L. Adamczyk et al., “Measurements of Dielectron Production in Au+Au Collisions at√sNN= 200 GeV from the STAR Experiment,” Phys. Rev. C92 no. 2, (2015) 024912,
arXiv:1504.01317 [hep-ex].
[49] A. Bilandzic, C. H. Christensen, K. Gulbrandsen, A. Hansen, and Y. Zhou, “Generic framework for anisotropic flow analyses with multiparticle azimuthal correlations,” Phys. Rev. C89 no. 6, (2014) 064904, arXiv:1312.3572 [nucl-ex].
[50] ALICE Collaboration, S. Acharya et al., “Energy dependence and fluctuations of anisotropic flow in Pb-Pb collisions at√sNN= 5.02 and 2.76 TeV,” arXiv:1804.02944 [nucl-ex].
[51] CMS Collaboration, V. Khachatryan et al., “Evidence for transverse momentum and
pseudorapidity dependent event plane fluctuations in PbPb and pPb collisions,” Phys. Rev. C92 no. 3, (2015) 034911, arXiv:1503.01692 [nucl-ex].
[52] ATLAS Collaboration, M. Aaboud et al., “Measurement of longitudinal flow decorrelations in Pb+Pb collisions at√sNN= 2.76 and 5.02 TeV with the ATLAS detector,” Eur. Phys. J. C78
no. 2, (2018) 142, arXiv:1709.02301 [nucl-ex].
[53] ALICE Collaboration, J. Adam et al., “Pseudorapidity dependence of the anisotropic flow of charged particles in Pb-Pb collisions at√sNN= 2.76 TeV,” Phys. Lett. B762 (2016) 376–388, arXiv:1605.02035 [nucl-ex].
[54] CMS Collaboration, S. Chatrchyan et al., “Measurement of the elliptic anisotropy of charged particles produced in PbPb collisions at√sNN= 2.76 TeV,” Phys. Rev. C87 no. 1, (2013) 014902, arXiv:1204.1409 [nucl-ex].
[55] ALICE Collaboration, J. Adam et al., “Inclusive, prompt and non-prompt J/ψ production at mid-rapidity in Pb-Pb collisions at√sNN= 2.76 TeV,” JHEP 07 (2015) 051, arXiv:1504.07151 [nucl-ex].
[56] CMS Collaboration, S. Chatrchyan et al., “Suppression of non-prompt J/ψ, prompt J/ψ, and Y(1S) in PbPb collisions at√sNN= 2.76 TeV,” JHEP 05 (2012) 063, arXiv:1201.5069
[nucl-ex].
[57] X. Guo, S. Shi, N. Xu, Z. Xu, and P. Zhuang, “Magnetic Field Effect on Charmonium Production in High Energy Nuclear Collisions,” Phys. Lett. B751 (2015) 215–219, arXiv:1502.04407 [hep-ph].
[58] R. A. Fisher, Statistical Methods for Research Workers, pp. 66–70. Springer New York, New York, NY, 1992. http://dx.doi.org/10.1007/978-1-4612-4380-9_6.
[59] ATLAS Collaboration, G. Aad et al., “Measurement of event-plane correlations in√sNN= 2.76
TeV lead-lead collisions with the ATLAS detector,” Phys. Rev. C90 no. 2, (2014) 024905, arXiv:1403.0489 [hep-ex].
A Appendix
The azimuthal distribution of the combinatorial background dNB/dϕ is a product of the azimuthal dis-tributions of the single muons from which the background dimuons are formed. Thus, using Eq.(1) one obtains dNB dϕ ∝(1 + 2 ∞
∑
n=1 v(1)n (p(1)T , η1) cos[n(ϕ1− Ψn)])(1 + 2 ∞∑
m=1 v(2)m (p(2)T , η2) cos[m(ϕ2− Ψm)]) ∝1 + 2 ∞∑
n=1 v(1)n (p(1)T , η1) cos[n(∆ϕ1+ ϕ − Ψn)] + 2 ∞∑
m=1 v(2)m (p(2)T , η2) cos[m(∆ϕ2+ ϕ − Ψm)] + 4 ∞∑
n=1 ∞∑
m=1 v(1)n (p(1)T , η1)v(2)m (p(2)T , η2) cos[n(∆ϕ1+ ϕ − Ψn)] cos[m(∆ϕ2+ ϕ − Ψm)], (A.1)where v(1)n (p(1)T , η1) and v(2)m (p(2)T , η2) are the flow coefficients of the two muons as a function of their
transverse momenta and pseudorapidities, ϕ1and ϕ2are the azimuthal angles of the two muons, ϕ is the
azimuthal angle of the dimuon and ∆ϕ1,2= ϕ1,2− ϕ.
The n-th order flow coefficient of the background dimuon is then calculated as
vBn(p(1)T , p(2)T , η1, η2, ϕ1, ϕ2) = hcos[n(ϕ − Ψn)]i = 2π R 0 dNB dϕ cos[n(ϕ − Ψn)]dϕ 2π R 0 dNB dϕ dϕ . (A.2)
The denominator in Eq.(A.2) is obtained as 2π + 2 ∞
∑
n=1 v(1)n (p(1)T , η1)In(∆ϕ1) + 2 ∞∑
m=1 v(2)m (p(2)T , η2)Im(∆ϕ2) + 4 ∞∑
n=1 ∞∑
m=1 v(1)n (p(1)T , η1)v (2) m (p (2) T , η2)Inm(∆ϕ1, ∆ϕ2), (A.3) where In(∆ϕ1,2) = 2π Z 0 cos[n(∆ϕ1,2+ ϕ − Ψn)]dϕ = 0, (A.4) Imn(∆ϕ1, ∆ϕ2) = 2π Z 0 cos[n(∆ϕ1+ ϕ − Ψn)] cos[m(∆ϕ2+ ϕ − Ψm)]dϕ = ( 0, n 6= m π cos[n(∆ϕ1− ∆ϕ2)], n = m. (A.5) The numerator in Eq.(A.2) is obtained as2 ∞
∑
k=1 v(1)k (p(1)T , η1)Jkn(∆ϕ1) + 2 ∞∑
m=1 v(2)m (p(2)T , η2)Jmn(∆ϕ2) + 4 ∞∑
k=1 ∞∑
m=1 v(1)k (p(1)T , η1)v(2)m (p(2)T , η2)Jkmn(∆ϕ1, ∆ϕ2), (A.6) where Jkn(∆ϕ1,2) = 2π Z 0 cos[k(∆ϕ1,2+ ϕ − Ψk)] cos[n(ϕ − Ψn)]dϕ = ( 0, k 6= n π cos[n∆ϕ1,2], k = n, (A.7)Jkmn(∆ϕ1, ∆ϕ2) = 2π Z
0
cos[k(∆ϕ1+ ϕ − Ψk)] cos[m(∆ϕ2+ ϕ − Ψm)] cos[n(ϕ − Ψn)]dϕ = 0. (A.8)
Combining Eq.(A.2)-(A.8) yields
vBn(p(1)T , p(2)T , η1, η2, ϕ1, ϕ2) = v(1)n (p(1)T , η1) cos[n(ϕ1− ϕ)] + v (2) n (p (2) T , η2) cos[n(ϕ2− ϕ)] 1 + 2 ∞ ∑ m=1 v(1)m (p(1)T , η1)vm(2)(p(2)T , η2) cos[m(ϕ1− ϕ2)] . (A.9)
Finally, the vBn as a function of Mµ µis obtained by averaging the numerator and denominator in Eq.(A.9)
over all dimuons, which belong to a given Mµ µ interval:
vBn(Mµ µ) =
hv(1)n (p(1)T , η1) cos[n(ϕ1− ϕ)] + v(2)n (p(2)T , η2) cos[n(ϕ2− ϕ)]iMµ µ
h1 + 2 ∑∞
m=1
v(1)m (p(1)T , η1)v(2)m (p(2)T , η2) cos[m(ϕ1− ϕ2)]iMµ µ
. (A.10)
The Eq.(A.8) is derived assuming no correlation between different harmonic symmetry plane angles Ψ. While this is in general the case, there are some noticeable exceptions [59]. In fact, the significant correlation between the Ψ2and Ψ4angles leads to non-zero J422. The corresponding contribution to the
numerator of Eq.(A.10) for vB2 is given approximately by 1 2hcos[4(Ψ4− Ψ2)]ihv (1) 4 (p (1) T , η1)v (2) 2 (p (2) T , η2) cos[4(ϕ1− ϕ) − 2(ϕ2− ϕ)] + v(2)4 (p(2)T , η2)v(1)2 (p(1)T , η1) cos[4(ϕ2− ϕ) − 2(ϕ1− ϕ)]iMµ µ, (A.11)
where the brackets h· · · i denote an average over all events. The contribution is estimated as described in the following. First, the v2 and v4 coefficients of single muons are measured with the SP method,
averaged over pseudorapidity and parameterized as a function of pT. The obtained parameterizations
v2,4(pT) are then combined with opposite-sign dimuons (p (1) T , p
(2)
T , η1, η2, ϕ1, ϕ2) in the data outside the
J/ψ mass peak. The values of hcos[4(Ψ4− Ψ2)]i, which ranges from 0 in central collisions to about 0.8
in peripheral collisions, are taken from Ref. [59]. Finally, the magnitude of the effect is calculated via interpolation of the results at the J/ψ mass peak. In general, the magnitude is found to be at the order of 10−4, reaching at most 7 × 10⁻⁴for 0 < pT < 2 GeV/c and the 30–50% centrality interval.
A similar effect is present in the numerator of Eq.(A.10) for vB3, due to the correlation of the Ψ3and Ψ6
angles. In practice, however, this contribution can be certainly neglected, because of the small magnitude of the v6coefficient.
B The ALICE Collaboration
S. Acharya139, F.T.-. Acosta20, D. Adamov´a93, A. Adler74, J. Adolfsson80, M.M. Aggarwal98, G. Aglieri Rinella34, M. Agnello31, N. Agrawal48, Z. Ahammed139, S.U. Ahn76, S. Aiola144, A. Akindinov64,
M. Al-Turany104, S.N. Alam139, D.S.D. Albuquerque121, D. Aleksandrov87, B. Alessandro58, H.M. Alfanda6, R. Alfaro Molina72, Y. Ali15, A. Alici10 ,27 ,53, A. Alkin2, J. Alme22, T. Alt69, L. Altenkamper22,
I. Altsybeev111, M.N. Anaam6, C. Andrei47, D. Andreou34, H.A. Andrews108, A. Andronic142 ,104, M. Angeletti34, V. Anguelov102, C. Anson16, T. Antiˇci´c105, F. Antinori56, P. Antonioli53, R. Anwar125, N. Apadula79, L. Aphecetche113, H. Appelsh¨auser69, S. Arcelli27, R. Arnaldi58, I.C. Arsene21, M. Arslandok102, A. Augustinus34, R. Averbeck104, M.D. Azmi17, A. Badal`a55, Y.W. Baek60 ,40, S. Bagnasco58, R. Bailhache69, R. Bala99, A. Baldisseri135, M. Ball42, R.C. Baral85, A.M. Barbano26, R. Barbera28, F. Barile52, L. Barioglio26, G.G. Barnaf¨oldi143, L.S. Barnby92, V. Barret132, P. Bartalini6, K. Barth34, E. Bartsch69, N. Bastid132, S. Basu141, G. Batigne113, B. Batyunya75, P.C. Batzing21,
J.L. Bazo Alba109, I.G. Bearden88, H. Beck102, C. Bedda63, N.K. Behera60, I. Belikov134, F. Bellini34, H. Bello Martinez44, R. Bellwied125, L.G.E. Beltran119, V. Belyaev91, G. Bencedi143, S. Beole26, A. Bercuci47,
Y. Berdnikov96, D. Berenyi143, R.A. Bertens128, D. Berzano58 ,34, L. Betev34, P.P. Bhaduri139, A. Bhasin99, I.R. Bhat99, H. Bhatt48, B. Bhattacharjee41, J. Bhom117, A. Bianchi26, L. Bianchi125, N. Bianchi51,
J. Bielˇc´ık37, J. Bielˇc´ıkov´a93, A. Bilandzic103 ,116, G. Biro143, R. Biswas3, S. Biswas3, J.T. Blair118, D. Blau87, C. Blume69, G. Boca137, F. Bock34, A. Bogdanov91, L. Boldizs´ar143, A. Bolozdynya91, M. Bombara38, G. Bonomi138, M. Bonora34, H. Borel135, A. Borissov142 ,102, M. Borri127, E. Botta26, C. Bourjau88, L. Bratrud69, P. Braun-Munzinger104, M. Bregant120, T.A. Broker69, M. Broz37, E.J. Brucken43, E. Bruna58, G.E. Bruno34 ,33, D. Budnikov106, H. Buesching69, S. Bufalino31, P. Buhler112, P. Buncic34, O. Busch131 ,i, Z. Buthelezi73, J.B. Butt15, J.T. Buxton95, J. Cabala115, D. Caffarri89, H. Caines144, A. Caliva104, E. Calvo Villar109, R.S. Camacho44, P. Camerini25, A.A. Capon112, W. Carena34, F. Carnesecchi10 ,27, J. Castillo Castellanos135, A.J. Castro128, E.A.R. Casula54, C. Ceballos Sanchez8, S. Chandra139, B. Chang126, W. Chang6, S. Chapeland34, M. Chartier127, S. Chattopadhyay139, S. Chattopadhyay107, A. Chauvin24, C. Cheshkov133, B. Cheynis133, V. Chibante Barroso34, D.D. Chinellato121, S. Cho60, P. Chochula34, T. Chowdhury132, P. Christakoglou89, C.H. Christensen88, P. Christiansen80, T. Chujo131, S.U. Chung18, C. Cicalo54, L. Cifarelli10 ,27, F. Cindolo53, J. Cleymans124, F. Colamaria52, D. Colella52, A. Collu79,
M. Colocci27, M. Concas58 ,ii, G. Conesa Balbastre78, Z. Conesa del Valle61, J.G. Contreras37, T.M. Cormier94, Y. Corrales Morales58, P. Cortese32, M.R. Cosentino122, F. Costa34, S. Costanza137, J. Crkovsk´a61,
P. Crochet132, E. Cuautle70, L. Cunqueiro94 ,142, T. Dahms103 ,116, A. Dainese56, F.P.A. Damas113 ,135, S. Dani66, M.C. Danisch102, A. Danu68, D. Das107, I. Das107, S. Das3, A. Dash85, S. Dash48, S. De49, A. De Caro30, G. de Cataldo52, C. de Conti120, J. de Cuveland39, A. De Falco24, D. De Gruttola10 ,30, N. De Marco58, S. De Pasquale30, R.D. De Souza121, H.F. Degenhardt120, A. Deisting104 ,102, A. Deloff84, S. Delsanto26, C. Deplano89, P. Dhankher48, D. Di Bari33, A. Di Mauro34, B. Di Ruzza56, R.A. Diaz8, T. Dietel124,
P. Dillenseger69, Y. Ding6, R. Divi`a34, Ø. Djuvsland22, A. Dobrin34, D. Domenicis Gimenez120, B. D¨onigus69, O. Dordic21, A.K. Dubey139, A. Dubla104, L. Ducroux133, S. Dudi98, A.K. Duggal98, M. Dukhishyam85, P. Dupieux132, R.J. Ehlers144, D. Elia52, E. Endress109, H. Engel74, E. Epple144, B. Erazmus113, F. Erhardt97, M.R. Ersdal22, B. Espagnon61, G. Eulisse34, J. Eum18, D. Evans108, S. Evdokimov90, L. Fabbietti103 ,116, M. Faggin29, J. Faivre78, A. Fantoni51, M. Fasel94, L. Feldkamp142, A. Feliciello58, G. Feofilov111, A. Fern´andez T´ellez44, A. Ferretti26, A. Festanti34, V.J.G. Feuillard102, J. Figiel117, M.A.S. Figueredo120, S. Filchagin106, D. Finogeev62, F.M. Fionda22, G. Fiorenza52, F. Flor125, M. Floris34, S. Foertsch73,
P. Foka104, S. Fokin87, E. Fragiacomo59, A. Francescon34, A. Francisco113, U. Frankenfeld104, G.G. Fronze26, U. Fuchs34, C. Furget78, A. Furs62, M. Fusco Girard30, J.J. Gaardhøje88, M. Gagliardi26, A.M. Gago109, K. Gajdosova88, M. Gallio26, C.D. Galvan119, P. Ganoti83, C. Garabatos104, E. Garcia-Solis11, K. Garg28, C. Gargiulo34, P. Gasik116 ,103, E.F. Gauger118, M.B. Gay Ducati71, M. Germain113, J. Ghosh107, P. Ghosh139, S.K. Ghosh3, P. Gianotti51, P. Giubellino104 ,58, P. Giubilato29, P. Gl¨assel102, D.M. Gom´ez Coral72, A. Gomez Ramirez74, V. Gonzalez104, P. Gonz´alez-Zamora44, S. Gorbunov39, L. G¨orlich117, S. Gotovac35, V. Grabski72, L.K. Graczykowski140, K.L. Graham108, L. Greiner79, A. Grelli63, C. Grigoras34, V. Grigoriev91,
A. Grigoryan1, S. Grigoryan75, J.M. Gronefeld104, F. Grosa31, J.F. Grosse-Oetringhaus34, R. Grosso104, R. Guernane78, B. Guerzoni27, M. Guittiere113, K. Gulbrandsen88, T. Gunji130, A. Gupta99, R. Gupta99, I.B. Guzman44, R. Haake34 ,144, M.K. Habib104, C. Hadjidakis61, H. Hamagaki81, G. Hamar143, M. Hamid6, J.C. Hamon134, R. Hannigan118, M.R. Haque63, A. Harlenderova104, J.W. Harris144, A. Harton11, H. Hassan78, D. Hatzifotiadou53 ,10, S. Hayashi130, S.T. Heckel69, E. Hellb¨ar69, H. Helstrup36, A. Herghelegiu47,
E.G. Hernandez44, G. Herrera Corral9, F. Herrmann142, K.F. Hetland36, T.E. Hilden43, H. Hillemanns34, C. Hills127, B. Hippolyte134, B. Hohlweger103, D. Horak37, S. Hornung104, R. Hosokawa131 ,78, J. Hota66,