Saturating Light Induces Sustained Accumulation of
Oil in Plastidal Lipid Droplets in
Chlamydomonas reinhardtii
1
Hugh Douglas Goold, Stéphan Cuiné, Bertrand Légeret, Yuanxue Liang, Sabine Brugière, Pascaline Auroy, Hélène Javot, Marianne Tardif, Brian Jones, Fred Beisson, Gilles Peltier, and Yonghua Li-Beisson*
Commissariat à l’Energie Atomique, Centre National de la Recherche Scientifique Aix Marseille Université, Unité Mixte de Recherche 7265, Institut de Biosciences et Biotechnologies, Cadarache 13108, France (H.D.G., S.C., B.L., Y.L., P.A., H.J., F.B., G.P., Y.L.-B.); Faculty of Agriculture and the Environment, University of Sydney, Sydney, New South Wales 2006, Australia (H.D.G., B.J.); and Commissariat à l’Energie Atomique, INSERM, Université Grenoble Alpes, Institut de Biosciences et Biotechnologies de Grenoble, Grenoble 38000, France (S.B., M.T.)
ORCID IDs: 0000-0002-3000-3355 (S.C.); 0000-0002-4577-2747 (H.J.); 0000-0001-9995-7387 (F.B.); 0000-0003-1064-1816 (Y.L.-B.).
Enriching algal biomass in energy density is an important goal in algal biotechnology. Nitrogen (N) starvation is considered the most potent trigger of oil accumulation in microalgae and has been thoroughly investigated. However, N starvation causes the slow down and eventually the arrest of biomass growth. In this study, we show that exposing a Chlamydomonas reinhardtii
culture to saturating light (SL) under a nonlimiting CO2concentration in turbidostatic photobioreactors induces a sustained
accumulation of lipid droplets (LDs) without compromising growth, which results in much higher oil productivity than N starvation. We also show that the polar membrane lipid fraction of SL-induced LDs is rich in plastidial lipids (approximately 70%), in contrast to N starvation-induced LDs, which contain approximately 60% lipids of endoplasmic reticulum origin. Proteomic analysis of LDs isolated from SL-exposed cells identified more than 200 proteins, including known proteins of lipid metabolism, as well as 74 proteins uniquely present in SL-induced LDs. LDs induced by SL and N depletion thus differ in protein and lipid contents. Taken together, lipidomic and proteomic data thus show that a large part of the sustained oil accumulation occurring under SL is likely due to the formation of plastidial LDs. We discuss our data in relation to the different metabolic routes used by microalgae to accumulate oil reserves depending on cultivation conditions. Finally, we propose a model in which oil accumulation is governed by an imbalance between photosynthesis and growth, which can be achieved by
impairing growth or by boosting photosynthetic carbonfixation, with the latter resulting in higher oil productivity.
Neutral lipid accumulation by microalgae has re-cently regained intensive interest because these orga-nisms are considered promising as a feedstock for the production of renewable fuels and fatty acid
derivatives (Rosenberg et al., 2008; Wijffels and Barbosa, 2010; Khozin-Goldberg and Cohen, 2011). Most micro-algal species do not accumulate large amounts of neutral lipids (i.e. triacylglycerols [TAGs]) when grown under optimal conditions (Sheehan et al., 1998). Neutral lipid accumulation, however, can be induced by exposing cells to unfavorable culture conditions, such as removing nutritional elements (nitrogen [N], sulfur, iron, phos-phate, etc.) from the media; increasing salinity or growth temperature (Moellering and Benning, 2010; Siaut et al., 2011; Urzica et al., 2013; Abida et al., 2015; Légeret et al., 2016); or exposing cells to small chemically active mol-ecules (Kato et al., 2013; Kim et al., 2013, 2015). Most of the current understanding of TAG metabolism in Chlamydomonas reinhardtii has been gained through the study of molecular mechanisms occurring during the N starvation response (Fan et al., 2011; Goodson et al., 2011; Siaut et al., 2011; Tsai et al., 2014, 2015). It is un-certain if the mechanisms of TAG accumulation upon N starvation are generally applicable or whether different mechanisms are employed under other types of condi-tions. A major limitation of the use of microalgae to produce oil is the fact that N deprivation, as well as most other TAG-inducing conditions, provoke impairments
1
This work was supported by the French Agence Nationale pour la Recherche (grant nos. ANR–12–BIME–0001–02 and ANR–10– INBS–08–01), the Région Provence Alpes Côte d’Azur, the Conseil Général des Bouches-du-Rhône, the French Ministry of Research, the Centre National de la Recherche Scientifique, the Commissariat à l’Energie Atomique, the European Union Regional Developing Fund, the University of Sydney for an Australian Postgraduate Award and the Paul Finlay Scholarship to H.D.G., and the China Scholarship Council for a postgraduate award to Y.L.
* Address correspondence to yonghua.li@cea.fr.
The author responsible for distribution of materials integral to the findings presented in this article in accordance with the policy de-scribed in the Instructions for Authors (www.plantphysiol.org) is: Yonghua Li-Beisson (yonghua.li@cea.fr).
H.D.G., G.P., B.J., F.B., and Y.L.-B. designed research; H.D.G., S.C., B.L., Y.L., H.J., S.B., and P.A. performed research; H.D.G., M.T., B.L., Y.L., H.J., M.T., F.B., G.P., and Y.L.-B. analyzed data; H.D.G., F.B., M.T., G.P., and Y.L.-B. wrote the article; all authors agreed on the article.
www.plantphysiol.org/cgi/doi/10.1104/pp.16.00718
Ò, August 2016, Vol. 171, pp. 2406–2417, www.plantphysiol.org Ó 2016 American Society of Plant Biologists. All Rights Reserved.
in protein synthesis and cell division, thus limiting pro-ductivity (Hu et al., 2008; Scott et al., 2010).
Biomass productivity is the result of highly coordi-nated cellular processes, starting with the capture of light by photosystems, thefixation of CO2through the Calvin-Benson cycle, and cell growth and division. Light is one of the most variable environmental pa-rameters during the growth of photoautotrophs in natural environments. In nonsaturating light, CO2 fix-ation and biomass productivity increase linearly as a function of light intensity. Above a certain threshold, light saturation occurs. A considerable body of work has documented the effects of high light on photosyn-thesis, including effects on the pigment content (Bonente et al., 2012), on the induction of dissipation or protection mechanisms (Peers et al., 2009), and on the production of reactive oxygen species (Fischer et al., 2006; Förster et al., 2006; Erickson et al., 2015; Sato et al., 2015). The effect of light intensity on carbon allocation and reserve formation also has been explored (Pal et al., 2011; Fan et al., 2012; Klok et al., 2013; He et al., 2015). For example, increasing light intensity has been shown to increase the cellular neutral lipid content in a num-ber of microalgal species, including Haematococcus pluvialis (Zhekisheva et al., 2002), Tichocarpus crinitus (Khotimchenko and Yakovleva, 2005), and C. reinhardtii (Mettler et al., 2014). Molecular factors involved in TAG storage under high light are still to be uncovered.
Oil accumulation is associated with the formation of lipophilic droplets, called lipid droplets (LDs [or oil bodies or oleosomes]; Jolivet et al., 2013). LDs are spe-cialized intracellular organelles made of a neutral lipid core surrounded by a membrane lipid coat in which proteins are embedded (Huang, 1996). LDs serve as a temporary storage site for neutral lipids and also par-ticipate in the active synthesis and metabolism of these non-membrane-forming lipids (Goodman, 2008; Farese and Walther, 2009; Chapman et al., 2012; Goold et al., 2015; Tsai et al., 2015). The current model of LD bio-genesis suggests that these lipid-rich subcellular struc-tures arise from membrane budding or blistering; thus, the lipid molecules present in the LD lipid coat suggest its origin of biogenesis. For example, oil bodies in the oilseed are coated by a monolayer of lipids of mostly endoplasmic reticulum (ER) origin (Huang, 1992; Tzen and Huang, 1992), whereas plastoglobules are covered by lipids usually found as part of the thylakoid mem-branes (Austin et al., 2006). Thus, the protein and lipid composition of LDs can shed light on the likely sub-cellular location of TAG synthesis and LD biogenesis. Compared with oilseeds, the unicellular microalga C. reinhardtii offers an excellent platform in which to study LD formation, due to the ease with which researchers can induce LD biogenesis or degradation by simply changing the culture medium (Goodson et al., 2011; Goold et al., 2015; Tsai et al., 2015).
Here, we used a turbidostatic continuous cultivation system to study the effect of light intensity on oil accu-mulation and productivity in C. reinhardtii cells. We report that exposure to a saturating light (SL) leads to increased
cellular oil content and to much higher oil productivity than observed in response to N depletion. A general model in which oil accumulation is the result of an im-balance between photosynthetic activity and demand for growth is discussed. We also provide insights into the mechanism of oil accumulation under SL by reporting the proteomic and lipidomic analyses of SL-induced LDs.
RESULTS
Experimental Setup and Choice of Light Intensity
To investigate the formation of carbon reserves in re-sponse to high light under photoautotrophic conditions, it is paramount that light supply and penetrance be kept uniform throughout all culture stages. When cultivat-ing algae in batch cultures under current laboratory conditions, the biomass increase leads to a decrease of light perceived per cell due to shading in dense cultures. To achieve constant light perception, we cultivated C. reinhardtii in continuous culture in photobioreactors (PBRs) monitored as turbidostats. This allows for the cultures to be maintained at constant biomass levels (i.e. under a defined physiological condition) throughout the course of the experiment with minimal differences be-tween cultures in terms of light exposure and other pa-rameters, such as pH, nutrient, or CO2supply.
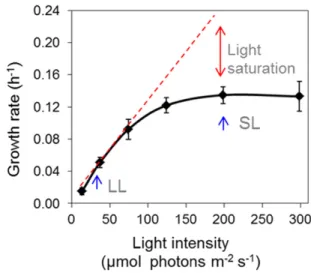
Wefirst measured biomass productivity as a function of photon flux density (Fig. 1). A nonlimiting CO2
condition was achieved by bubbling air containing 1.8% CO2. The growth rate increased progressively
with rising photon flux density in the range of 0 to
Figure 1. Growth rate of biomass as a function of photon flux density in turbidostatic PBRs. Strain CC-124 was cultivated in PBRs, with a supply of 1.8% CO2in air. Growth rate was calculated as the rate of injection of
fresh medium to an existing culture while maintaining an optical den-sity at 880 nm (OD880) of 0.4 (equivalent to approximately 2 million
cells mL21). The light intensities used in the rest of this study are indi-cated by blue arrows. Low light (LL) refers to 37mmol m22s21, and SL refers to 200mmol m22s21. Data are means of two biological replicates and two technical replicates each. Error bars representSD.
100mmol m22s21, but when light reached more than 120 mmol m22 s21, a plateau in biomass growth was observed. Light intensities above that threshold are thus SL. To evaluate the effects of light intensity on carbon reserve formation, based on thisfirst experiment, cells of C. reinhardtii were cultivated first at a sub-saturating LL (37mmol m22s21) and then exposed to SL of 200mmol m22s21for 48 h (blue arrows in Fig. 1). It is worth noting that the light intensity at which the satu-ration of photosynthesis and growth was obtained un-der this experimental setup (around 200mmol m22s21) may appear low compared with what is generally used in most laboratory conditions (i.e. shake flasks with monodirectional illumination). Such an LL saturation level resulted from the use of a relatively low-density culture (OD880 = 0.4) and radial illumination (creating a homogenous light inside the PBR). Since high light is a relative term, to avoid ambiguity, in this study we use the term SL throughout.
To dissect mechanistic differences in carbon reserve formation between cells exposed to SL and those cul-tivated under N-starvation conditions, we set up four 1-L PBRs, two for SL experiments and two for the N-depletion experiments. To reflect real production conditions, we employed a gradual N-depletion pro-cess rather than an abrupt N starvation. The experi-mental setups used and the parameters analyzed in the rest of the work are outlined in Figure 2.
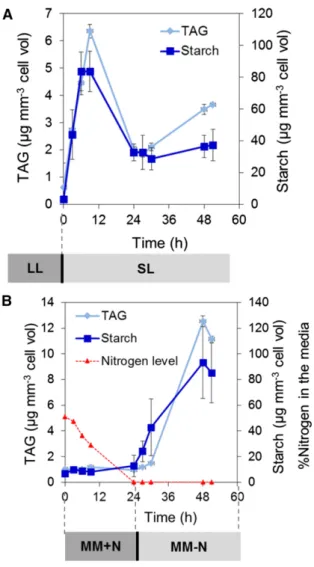
Exposure to SL Increases Intracellular Oil and Starch Contents
Quantification of intracellular oil and starch showed that SL-exposed cells accumulated both starch and TAGs in a parallel manner (Fig. 3A). Oil and starch accumu-lation also was observed in N-starved cells under pho-toautotrophic PBR conditions (Fig. 3B). Maximal oil accumulation measured in SL-exposed cells (approxi-mately 6 mg mm23 at 9 h) reached almost 50% of the level determined for N-starved cells (approximately 12 mg mm23 at 24 h after N depletion), and maxi-mal starch accumulation was similar (approximately 80mg mm23) under both conditions. A transient peak of TAG/starch accumulation was seen around 9 h upon SL exposure, followed by a drop and stabilization at 24 h. The stabilized level of reserves was still much higher than before SL exposure but lower than the maximal level observed under N depletion. Moreover, increases in total fatty acids and also in carbon/nitrogen (C/N) ratio (from 4.8 to 5.7) were observed in cells exposed to SL compared with those cultivated under LL (Supplemental Fig. S1), supporting the TAG quantification data (Fig. 3).
Oil and Starch Productivities Are Higher in SL-Exposed Cultures Than in N-Starved Cultures
Upon SL exposure, the specific growth rate of the C. reinhardtii culture grown in PBRs increased progres-sively from 0.05 h21to a new steady state, which was
reached at 0.12 h21(Fig. 4A). In sharp contrast, N de-pletion led to a progressive decrease in the growth rate until it halted completely 6 h after full N depletion (Fig. 4B). Calculation of oil and starch productivity using specific growth rates with cellular oil and starch con-tents revealed that, compared with N starvation, SL-exposed cells achieved a 15 times higher productivity in TAG (approximately 6 mg L21d21versus 0.4 mg L21d21) and a 7 times higher productivity in starch (approxi-mately 70 mg L21d21versus 10 mg L21d21; Fig. 4, C and D). Therefore, these results clearly show that sustained productivity of oil and starch could be achieved in PBRs under SL.
SL-Exposed Cells Accumulate Oil in LDs
Oil accumulation under SL exposure was found to form distinct LDs that were visible after Nile Red staining (Fig. 5, A and B). Interestingly, a significant portion of LDs in SL-exposed cells were smaller than LDs under N starvation. This contrasted to those Figure 2. Experimental setup for the comparison of N starvation and SL conditions. Strain CC-124 was maintained at a constant OD880of 0.4
(equivalent to approximately 2 million cells mL21). SL refers to a light intensity of 200 mmol m22 s21. N starvation was achieved through
progressive limitation, and culture N level was measured. MM, Minimal medium.
formed under N starvation, which were bigger and more abundant (Fig. 5C). It is known that N-starved C. reinhardtii wild-type cells accumulate LDs mostly at the junction of the ER and plastid envelopes (the so-called b-cytoplasm [cyto]-LDs; Goodson et al., 2011). Here, we thus focused only on the subcellular location of the LDs present in the SL-treated cells. This was achieved by obtaining confocal microscopy images of several focal planes. For example, when moving the focal plane from the top all the way to the bottom of the cell, we observed the presence or absence of LDs (Fig. 5, D–F). This con-trasted with the detection of chlorophyll auto-fluorescence. These observations suggested that at least some of the LDs formed were likely present inside the plastid (Fig. 5D; the white arrow points to one example of this LD type). LDs that appeared to be cytosolic or associated with plastid membranes in the same cell also could be seen. To confirm these observations, we
further examined the difference in the nature of LD populations under SL and N starvation by analyzing the protein and lipid composition of isolated LDs.
LDs in SL-Exposed Cells Contain TAGs and Polar Lipids of Mostly Plastidial Origin
To determine lipids and proteins present in LDs, we isolated LDs from both SL-exposed cells and N-starved cells cultivated in PBRs following 9 h of SL exposure or 24 h of N starvation, respectively. These time points were chosen because they correspond to the moment when the maximal cellular oil content was reached. After lipids were extracted from isolated LDs, polar and neutral fractions were separated by solid-phase ex-traction, and the proportion of each fraction was quantified after being converted to their fatty acid methyl esters. LDs of N-starved cells contained 97% neutral lipids and 3% polar lipids, whereas those of SL-exposed cells contained only 81% neutral lipids and 19% polar lipids (Fig. 6A). In a typical LD topology, neutral lipids are covered by a polar membrane shell (Jolivet et al., 2013). Since smaller LDs contain a higher proportion of polar membrane lipids than larger LDs, this suggests that the LDs in SL-exposed cells are
Figure 3. Exposure to SL triggers oil and starch accumulation. Cells were cultivated in PBRs in photoautotrophic conditions. Time zero in the SL and N-starvation experiments corresponds to LL and +N controls, respectively. Data are means of two biological replicates with two technical replicates. Error bars representSD. MM, Minimal medium.
Figure 4. Growth rates and oil and starch productivity under SL or N starvation. A, Growth rates under SL. B, Growth rates under N starva-tion. C, Productivity of oil and starch under SL. D, Productivity of oil and starch under N starvation. PBRs were first stabilized for 4 d and then exposed either to SL irradiance or N depletion. The growth rate was calculated based on the accumulated medium added to the PBR culture to maintain a constant optical density during cell culture. Red dotted lines indicate the moment SL is switched on, and green dotted lines indicate when N is completely depleted from the medium. Data are means of two biological replicates and two technical replicates. Error bars denoteSD.
smaller than those induced by N starvation, which was consistent with microscopic examinations (Fig. 5).
The polar lipids of LDs isolated from SL-exposed cells showed high contents of monogalactosyldiacylglycerol (MGDG) and sulfoquinovosyldiacylglycerol (SQDG), followed by phosphatidylglycerol and diacyl-glycerol N,N,N-trimethylhomoserine (DGTS), then digalactosyldiacylglycerol (DGDG), phosphatidylino-sitol, and phosphatidylethanolamine (PtdEtn; Fig. 6B). This composition clearly contrasts with the LDs of N-starved cells, where DGTS and SQDG are the major polar lipid species (Fig. 6B), which corroborates previ-ous observations (Wang et al., 2009). With the exception of phosphatidylinositol, molecular species within a particular lipid class also differed between these two LD types (Supplemental Fig. S2). LDs induced by SL contained a high proportion (approximately 70%) of lipids unique to photosynthetic membranes (i.e. MGDG, DGDG, and SQDG), whereas LDs of cells in the N-starvation condition contained approximately 60% extraplastidial lipids (DGTS and PtdEtn).
TAG molecular species present in the two LD types also were found to differ. Compared with TAG species present in cells under optimal growth conditions (i.e. LL and nutrient replete), SL-induced LDs contained sig-nificantly higher proportions of all TAG50 species, yet with significant reductions in TAG species rich in polyunsaturated fatty acids (TAG52:10 and TAG52:11; Fig. 6C). Interestingly, these polyunsaturated TAG species are present in higher proportions in LDs induced by SL than in those triggered by N starvation (Fig. 6C).
LDs of SL-Exposed Cells Contained Higher Proportions of Proteins of Plastidial Origin
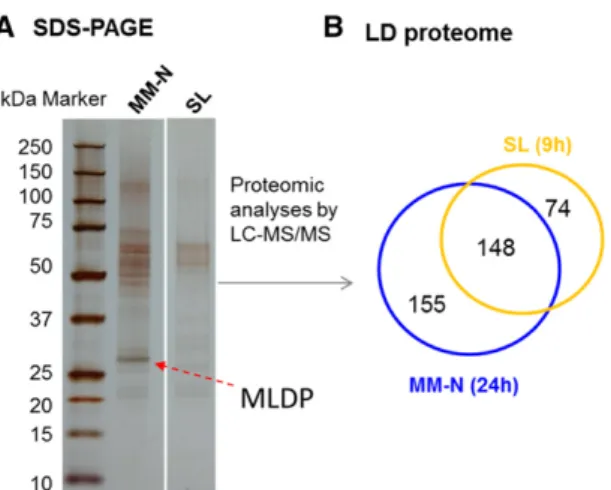
In order to gain further insights into LD formation under SL, we performed a proteomic analysis to com-pare the protein compositions of LDs accumulating in SL with those isolated from N-starvation conditions. Total proteins associated with LDs isolated under SL or N-starvation conditions were loaded and separated on an SDS-PAGE device. Protein extracts were loaded based on an equal amount of total lipids. LDs formed under SL showed a distinct protein composition com-pared with those of N-induced LDs (Fig. 7A). Proteomic analyses by LC-MS/MS identified 222 proteins associ-ated with LDs in SL-exposed cells and 303 proteins in LDs formed under N starvation (Fig. 7B; Supplemental Table S1, A and B). To be stringent, we kept only those proteins for which two or more unique peptides and two or more SSCs were identified. Proteins were ranked according to their estimated relative abundance within each LD biogenesis condition. Comparisons between the two proteomes showed that 148 proteins were identified in both proteomes (Supplemental Table S1C), whereas 74 unique proteins were identified in SL-induced LDs (Supplemental Table S1D), a large portion of which (31 of 74) were of plastidial origin based on a prediction using the green algae protein-adapted algo-rithm PredAlgo (Tardif et al., 2012). We detected sig-nificant amounts of plastidial proteins in both LD preparations, but we could not tell if these proteins are contaminations or are integral parts of the LD proteome. Figure 5. Visualization of LDs by Nile Red
staining and microscopy. A, C. reinhardtii cells cultivated under normal conditions (minimal medium [MM] + N/LL). B, C. reinhardtii cells after 9 h of SL (SL + N). C, C. reinhardtii cells after 24 h of N depletion (MM2 N/LL). D, The top focal plane of an image of a Nile Red-stained SL-exposed cell. E, The middle focal plane of an image of a Nile Red-stained SL-exposed cell. F, The bottom focal plane of an image of a Nile Red-stained SL-exposed cell.
These questions should be addressed in the future through studies of protein subcellular localizations.
The identities and annotations for the top 30 ranked proteins associated with LDs isolated from SL-exposed cells are listed in Table I. Proteins common to both LD isolates include the major lipid droplet protein (MLDP), the DGTS synthesis protein (BTA1), the cyclopropane-fatty acyl-phospholipid synthase (CFA2), an a/b-hydrolase, a glycosyl hydrolase (GHL1), a long-chain acyl-CoA synthetase (LCS2), a b-tubulin (TUB1), a lysophospholipid acyltransferase (LPLAT), and one of the components of the plastid lipid reimport machinery (TGD2; Table II; Supplemental Table S1C). These pro-teins were found to be present in all three previously reported LD proteomics studies (Moellering and Benning, 2010; Nguyen et al., 2011; Tsai et al., 2015). With the exception of TGD2, all of the above-mentioned top-ranked proteins in N-induced LDs are not the same major proteins in induced LDs (i.e. their ranks in SL-induced LDs are relatively inferior to those in N-SL-induced LDs; Table II). These rankings were calculated based on a computed calculation of the total number of SSCs and
emPAI values and can be used to evaluate the relative abundance of each protein in a sample.
Among the 74 proteins found only in LDs of SL ori-gin, of particular note is the presence of the relatively large proportion (approximately 45%) of proteins of plastidial origin, including Proton Gradient Regula-tion Like1 (PGRL1), Plastid Lipid Associated Protein8 (PLP8; Cre14.g611700), and a 2-methyl-6-phytyl-1,4-benzoquinone/2-methyl-6-solanyl-1,4-benzoquinone methyltransferase (VTE3; Supplemental Table S1D).
DISCUSSION
In this study, we showed that SL can increase cel-lular oil content while maintaining cell turnover and biomass growth, thus leading to a sustainable pro-duction of carbon reserves. This clearly contrasts with the well-characterized N starvation-induced oil accu-mulation, where oil productivity remained low de-spite achieving a higher cellular TAG content. We further showed that SL induces the formation of Figure 6. Lipid composition of LDs isolated from SL-exposed cells and N-starved cells. A, Proportion of membrane lipids versus
TAG in isolated LDs. Lipid amounts were determined by the quantification of total fatty acids in each lipid fraction. B, Proportion of major membrane lipid classes in isolated LDs. The content for each lipid class was determined by thin-layer chromatography (TLC). C, Distribution of TAG molecular species in isolated LDs. LDs were isolated from cells N starved for 24 h (corresponding to 48 h in Fig. 3) or from cells exposed to SL (200mmol m22s21) for 9 h. These time points were chosen because they represent the
peak of oil accumulation under either treatment. Data are means of two biological and two technical replicates, withSDshown.
FA, Fatty acid; MM-N, minimal medium under N starvation; PtdGro, phosphatidylglycerol; PtdIns, phosphatidylinositol.
smaller LDs than those formed under N starvation. The SL-induced LDs had a lipid and protein coat enriched in components of plastidial origin; thus, LDs formed under SL are distinct from those formed under N starvation. This serves as the first report on LD composition beyond the model of N starvation-induced LDs in C. reinhardtii.
Origin of TAGs under SL
An increase in total fatty acids was seen together with an increase in C/N ratio in cells exposed to SL (Supplemental Fig. S1). The positive correlation be-tween TAG levels and C/N ratio also was observed previously in the seeds of Arabidopsis (Arabidopsis thaliana) when the plant was grown under increasing irradiance (Li et al., 2006). Thus, after being exposed to SL, the cells readjust their metabolism to store the extra carbon and energy as energy-dense materials (i.e. starch and oil). These storage compounds provide a tempo-rary reservoir to accommodate the extrafluxes of ATP and reducing powers, thereby ensuring cell energetic homeostasis. This increased de novo fatty acid synthe-sis is further reflected in the changes in total fatty acid composition before and after SL exposure (Fig. 6C; Supplemental Fig. S1D; i.e. increased proportion of saturated C16 fatty acid and reduction of polyunsatu-rated fatty acid species). Increased carbonflow to TAG synthesis under high light was reported recently in the heterokont alga Nannochloropsis oculata, in which the activities of acetyl-CoA carboxylase and diacylglycerol acyltransferase are increased significantly following a transition from low-light to high-light cultivation con-ditions (Ma et al., 2016).
In addition to the increased carbonflow to fatty acid synthesis, the composition of total polar lipids was al-tered following exposure to SL. SL-treated cells con-tained a reduced proportion of MGDG and increased proportions of DGDG and DGTS, with the other major lipids remaining constant (Supplemental Fig. S1C). Taken together, these data suggest that, under SL, both de novo fatty acid synthesis and membrane lipid re-modeling contribute to TAG formation, a phenomenon similar to what occurs in cells starved for N.
Biogenesis and Physiological Functions of LDs under SL Most of our knowledge of LD biology in C. reinhardtii is gained from studies of LDs induced by N starvation. Three types of LDs (a-cyto-LDs, b-cyto-LDs, and chlo-roplast [cpst]-LDs) have been distinguished in C. rein-hardtii upon N starvation; the type and relative abundance of each LD population differs depending on the cultivation conditions and on the genotype (Fan et al., 2011; Goodson et al., 2011). For example, it has been observed that optimally growing cells contain a fewa-cyto-LDs (i.e. free cytosolic LDs), whereas upon N starvation, wild-type strains of C. reinhardtii store oil mostly in b-cyto-LDs (i.e. LDs formed at the junction between the ER and the plastid envelope), whereas the starchless mutant bafJ5 accumulates cpst-LDs (i.e. chloroplast-located LDs) in addition to b-cyto-LDs (Goodson et al., 2011). Here, we observed that SL also can trigger LD formation. Part of the LDs seem to be inside the plastids (cpst-LDs) and part of them outside the plastid, but in most cases they seem to be associ-ated with the plastid envelopes (b-cyto-LDs; Fig. 8). Lipidomics analyses showed that LDs formed under SL exposure are made of a mixture of saturated and polyunsaturated TAGs and covered by a protein and lipid coat rich in components of plastidial origin. The presence of a plastidial TAG biosynthesis pathway is not surprising; it has been observed previously in the N-starved starchless mutant bafJ5 (Fan et al., 2011; Goodson et al., 2011) and also can be deduced by the subcellular targeting of key TAG enzymes in the plastid (Li-Beisson et al., 2015).
The protein and lipid composition of the LD coat further demonstrated that SL-induced LDs consist of components of mostly plastidial origin. For example, besides common proteins, SL-induced LDs were found to contain a significant subset of plastid-resident pro-teins, including PGRL1, PLP8, and VTE3. PGRL1 is a major component of cyclic electronflow in C. reinhardtii and has been proposed to supply additional ATP for photosynthesis, particularly in conditions of high ATP demand (Tolleter et al., 2011; Dang et al., 2014). The PGRL1-deficient mutant (pgrl1) was reported recently to accumulate less neutral lipids under N starvation, and it was suggested that cyclic electronflow supplies ATP for lipid biosynthesis during N starvation (Chen et al., 2015). The association of PGRL1 with LDs of SL-exposed cells expands its role in supplying ATP for Figure 7. Comparison of the proteomic composition of LDs isolated
from cells subjected to SL or N starvation. A, Silver nitrate-stained SDS-PAGE gel of total proteins extracted from purified LDs. B, Venn diagram showing the total number of proteins associated with LDs under each condition. Only proteins with two or more peptides and two or more specific spectral counts (SSCs) were retained for analyses. LDs were purified from cultures after 24 h of N depletion or from cultures after being exposed to SL for 9 h. LC-MS/MS, Liquid chromatography-tandem mass spectrometry; MM-N, minimal medium under N starvation.
TAG synthesis under SL conditions. Interestingly, ho-mologs of the two other proteins (PLP8 and VTE3) in the model plant Arabidopsis have been found to be associated with plastoglobules, a type of LD specific to plant plastids (Kessler and Vidi, 2007). PLP8 is known to play a structural role, whereas VTE3 is required for
vitamin E synthesis and recycling (Martinis et al., 2013). Vitamin E synthesis is essential for photoadaptation to survive in higher irradiance. The presence of VTE3 in isolated SL-induced LDs supports the view that LDs play a photoprotective role via synthesizing oil-soluble vitamins.
Table II. Short list of key proteins consistently found in all three previously published proteomic studies of LDs isolated from C. reinhardtii These proteins have demonstrated roles related to LD biology, and the cited previous proteomics studies are Moellering and Benning (2010), Nguyen et al. (2011), and Tsai et al. (2015). MM-N, Minimal medium under N starvation. Score (Mascot score) and SSC are averages from two replicates.
Symbol Name LDs (MM-N) LDs (SL)
Peptides SSC Score Rank Peptides SSC Score Rank
BTA1 DGTS synthesis protein 41 94 2,120 1 24 41 1,198 2
MLDP Major LD protein 19 75 1,467 2 13 17 982 14
a/b-Hydrolase a/b-Hydrolase 28 63 1,832 3 13 21 970 7
LCS2 Long-chain acyl-CoA synthetase 32 54 1,646 4 7 7 323 59
GHL1 Glycosyl hydrolase 23 46 1,268 5 11 13 597 21
CFA2 Cyclopropane-fatty acyl-phospholipid synthase 19 34 1,147 6 10 16 597 16
LPLAT Lysophospholipid acyltransferase 20 33 966 7 4 4 213 129
TUB1 b-Tubulin1 15 16 673 23 6 6 272 85
TGD2 Permease-like component of an ATP-binding cassette transporter 3 3 152 252 5 5 270 98 Table I. Identity and abundance of the top 30 proteins found to be associated with LDs isolated from cells exposed to SL for 9 h
emPAI, Exponentially modified protein abundance index; \N, no annotation available. The rankings were calculated based on a computed calculation of the total number of SSCs and emPAI values and can be used to evaluate the relative abundance of each protein in a sample.
Identifier (Phytozome or Joint
Genome Institute) Symbol Name SSC emPAI Rank
Cre61.g792450.t1.2 \N \N 48.5 0.765 1
Cre07.g324200.t1.1 BTA1 DGTS synthesis protein 40.5 2.071 2
Cre01.g013700.t1.1 \N \N 24.5 7.566 3
gi|41179057|ref|NP_958414.1| \N ATP synthase CF1b-subunit (chloroplast encoded) 24 1.978 4 gi|41179032|ref|NP_958388.1| \N PSII 47-kD protein (chloroplast encoded) 24 1.452 5 Cre17.g698000.t1.1 ATP2 Mitochondrial F1F0 ATP synthase,b-subunit 21 1.683 6
Cre12.g540550.t1.2 a/b-hydrolase \N 21 1.523 7
Cre05.g241950.t1.1 \N \N 20.5 6.462 8
Cre41.g786600.t1.1 AAA1 Plastidic ADP/ATP translocase 20.5 1.239 9
gi|41179063|ref|NP_958420.1| \N PSII protein D2 (chloroplast encoded) 20 1.713 10
Cre04.g229300.t1.2 RCA1 Rubisco activase 19 2.027 11
Cre12.g498600.t1.1 \N Eukaryotic translation elongation factor 1a 18 1.612 12 gi|41179065|ref|NP_958422.1| \N PSII 44-kD protein (chloroplast encoded) 17.5 1.394 13
Cre09.g405500.t1.2 MLDP Major LD protein 17 4.425 14
gi|41179003|ref|NP_958358.1| \N Cytochrome f (chloroplast encoded) 16.5 2.316 15 Cre09.g398700.t1.1 CFA2 Cyclopropane-fatty acyl-phospholipid synthase 16 1.365 16 Cre09.g386650.t1.1 ANT1 ADP/ATP carrier protein, mitochondrial 14.5 2.047 17 Cre16.g672650.t1.1 \N Mitochondrial substrate carrier protein, possible
2-oxoglutarate/malate carrier
14 2.618 18
Cre02.g081050.t1.1 FAP24 Flagella-associated protein 14 0.965 19
Cre29.g778950.t1.1 FMG1-B Flagellar membrane glycoprotein, major form 14 0.104 20
Cre03.g171050.t1.2 GHL1 Glycosyl hydrolase 13 0.943 21
Cre02.g130650.t1.1 \N \N 13 0.583 22
Cre01.g002500.t1.1 COP2 Chlamyopsin, light-gated proton channel rhodopsin 12.5 2.709 23 Cre17.g738050.t1.1 AGG4 Flagellar membrane protein, paralog of AGG2 12 2.590 24
Cre17.g734300.t1.2 \N \N 12 0.411 25
Cre15.g638500.t1.1 CYC1 Ubiquinol:cytochrome c oxidoreductase cytochrome c1 11.5 1.561 26
Cre03.g172300.t1.1 \N Mitochondrial phosphate carrier protein 10.5 0.901 27
Cre01.g025350.t1.1 FAP235 Flagella-associated protein 10 2.777 28
Cre03.g196900.t1.1 \N \N 10 1.813 29
Cre23.g766250.t1.1 LHCBM1 Chlorophyll a/b-binding protein of LHCII 10 1.396 30
We conclude that a significant subpopulation of SL-induced LDs is associated with the chloroplast (cpst-LDs andb-cyto-LDs), consistent with our microscopic observations. Under SL exposure, wild-type strains of C. reinhardtii would mostly form cpst-LDs. The forma-tion of cpst-LDs was observed previously in the starchless mutant bafJ5 during N starvation (Goodson et al., 2011). Therefore, cpst-LDs are formed either in the absence of the starch (bafJ5 mutant) or under a high fluence rate, extra photosynthetic products being diverted to the formation of LDs inside the plastid. Both situations create an imbalance in the supply and de-mand of reduced carbon (discussed in the next section) and favor the formation of plastidial LDs, a conve-nient and local solution. However, in the absence of the protein/lipid composition data for cpst-LDs of the starchless mutant, we cannot assert that the two cpst-LDs are of the same nature, and this question should be investigated in the future.
One should bear in mind that LD isolates in each condition most likely represent a mixture of cpst-LDs
and cyto-LDs. The difference in protein relative abun-dance (i.e. as shown by rankings; Table II) could be be-cause these proteins are indeed present in much lower concentrations in all subpopulations of LDs induced by SL than in those triggered by N starvation; alternatively, it could be that these proteins were associated only with a specific subpopulation of LDs in the SL-exposed cells. This and other possibilities can be answered only once the subcellular localization information is available for these proteins under different culture conditions.
The Imbalance between Photosynthesis and Growth Governs Reserve Accumulation
Previous studies have shown that oil accumulation is triggered by conditions that impair cell growth (Merchant et al., 2012; Liu and Benning, 2013). In-creasing light intensity also has been reported as a means to increase oil content when combined with N starvation (Klok et al., 2013; Kandilian et al., 2014). The
Figure 9. Carbon reserve formation in C. reinhardtii in response to energy imbalance: a model. During normal growth (LL, nutrient-replete conditions), C. reinhardtii cells convert most of the solar energy they have captured through the photosystems and fixed as organic compounds to support biomass growth (cell division); only a small fraction is used to make temporary carbon reserves (starch and oil). Creating an energy imbalance either through an increased input of energy (SL with respect to biomass growth) or a decrease in energy use (through blocking growth via N starvation) results in reallocation of the excess energy to the synthesis of reserve compounds (oil and starch).
Figure 8. Model of LD biogenesis in cells ex-posed to SL or N starvation. Three types of LDs were drawn, partly based on observations made in this study and partly based on those of Goodson et al. (2011).
latter two studies have shown that, in conditions of N starvation, high light serves to increase the energy imbalance, resulting in higher TAG storage in the heterokont N. oculata and the green microalga Neo-chloris oleoabundans. Our study here provides a detailed report on the effect of light on reserve accumulation under optimal growth conditions for the model microalga C. reinhardtii. We found that SL-exposed cells accommodate an excess of light energy by storing re-duced carbon in the forms of starch and neutral lipids. The impact of high light on storage reserve accu-mulation is sometimes considered as a consequence of a light-stress effect. We observed a burst in oil/starch content following SL exposure. This suggests that cells respond to SL in two phases: an initial strong response, followed by an acclimated phase. This initial burst is most likely due to a combined stress response, with an increased carbonflux toward reserve formation at the beginning, followed by a metabolic adaptation to the increased irradiance. As cultivation under SL pro-ceeded, acclimated cells synthesized higher amounts of carbon reserves simultaneous to an increased growth rate. Thus, SL combined with a nonlimiting CO2supply induces significant oil accumulation in C. reinhardtii in conditions that support maximal growth. Therefore, we conclude that oil accumulation is not necessarily linked to a stress effect inducing growth impairment but may occur in conditions of maximal growth.
Upon steady-state SL exposure, the photosynthetic capacity may exceed the cell division and growth ca-pacity, thus creating an imbalance between the forma-tion of photosynthetic products and the capacity for their direct consumption. The cellular metabolism would thus be readjusted to store the extra energy as energy-dense materials (i.e. starch and oil). These stor-age compounds provide a temporary reservoir to ac-commodate the extra fluxes of ATP and reducing power, thereby ensuring cell energetic homeostasis. Based on these data, we propose a more general model in which starch and oil accumulations are triggered when an imbalance between photosynthetic CO2 fixa-tion and growth occurs (Fig. 9). Such an imbalance may occur in conditions where growth is primarily affected (such as nutrient starvation, heat, salinity, or chemical treatment) but also may occur in conditions of SL where photosynthetic CO2fixation exceeds the ability of algae to grow and replicate. The large increase in neutral lipid and starch productivity achieved under SL clearly points out the biotechnological advantage of increasing reserve accumulation under conditions not compro-mising growth in green microalgae.
MATERIALS AND METHODS C. reinhardtii Strains and Precultures
The wild-type Chlamydomonas reinhardtii strain CC-124 (mt2 nit1 nit2) was used throughout this study. Cells were usually maintained in Tris-acetate-phosphate medium (Harris, 2001) in Erlenmeyerflasks at 25°C with shaking at 120 rpm under constant illumination (150mmol photons m22s21). For pho-toautotrophic growth, cultures grown in minimal medium were kept under
identical conditions with additional supply of 1.8% CO2in air (Cagnon et al., 2013). Cell numbers were counted using a Beckman-Coulter multisizer. Cellular concentration was determined as the number of cells per milliliter of culture or total cellular volume (mm3) per milliliter of culture.
Cultivation in PBRs
PBR cultures were cultivated in minimal medium in automated Biostat A Plus PBR systems (Sartorius Stedium) as described previously (Dang et al., 2014). Cells were maintained at a constant OD880= 0.4 throughout experi-mentation. Specific growth rates were determined from the measurement of fresh medium added to the turbidostat to maintain a constant biomass con-centration. All PBRs were stirred at a constant 300 rpm.
Quantification of Starch
Starch was isolated and quantified based on the protocol described by Klein and Betz (1978). C. reinhardtii cells were harvested by centrifugation at 1,000g for 3 min. Cellular pellets were resuspended in 1 mL of methanol and centri-fuged again for 3 min at 1,000g to remove all chlorophyll. The methanol-washed pellet was air dried under a fume hood and subsequently resuspended in 400mL of distilled water; samples were then autoclaved for 20 min at 121°C. Amyloglucosidase (0.2 units; Roche) was added, and samples were incubated for 1 h at 60°C. Samples were then centrifuged to pellet particulate matter. Glc was measured with a YSI2700 select sugar analyzer (YSI Life Sciences) using commercial Glc as a standard.
Isolation of LDs
In order to isolate low-abundance LDs, a previously established C. reinhardtii LD isolation protocol (Nguyen et al., 2011) was used with the following minor changes. A desktop ultracentrifuge replaced the standard ultracentrifuge, and smaller 5-mL ultracentrifuge tubes were used to decrease the surface area of the lipid pad and increase the ease with which the lipid pad was completely re-covered. Additionally, to avoid the loss of material, the hexane wash was omitted, and during thefinal wash, a Suc-free buffer was used to replace the 0.4MSuc buffer. In thefinal step, the Suc-free buffer floats above all other buffers and allows for easier isolation of thefinal washed LDs.
Lipid Extraction, Quantification of Lipid Classes by TLC, and Lipid Molecular Species Analysis Using LC-MS/MS
A modified method of Bligh and Dyer (1959) was used to extract lipids. Samples were initially dissolved by vortexing in 1 mL of quenching solution (1 mMEDTA and 0.15Macetic acid) in an 8-mL glass tube with a Teflon screw cap. Three milliliters of methanol:chloroform (2:1, v/v) was added, and if samples were to be used for LC-MS/MS at this stage, internal standards TAG51:0 (composed of 17:0/17:0/17:0 fatty acids) and PtdEtn34:0 (composed of 17:0/17:0 fatty acids) were added. Samples were then vortexed for 10 min, 1 mL of chloroform and 0.8 mL of KCl (0.8%, w/v) were added, and samples were vortexed again for 10 min. Phases were separated by centrifugation at 1,000g for 2 min at 4°C. The lower phase was then isolated and transferred to a new clean glass tube. To the remaining phase, 1 mL of hexane was added to extract again the remaining lipids. Phases were separated by centrifugation at 1,000g for 2 min at 4°C. The upper phase containing lipids was then transferred to the chloroform extract using a glass Pasteur pipette. The combined chloro-form and hexane extracts were then dried under aflow of N and resuspended in a mixture of chloroform:methanol (2:1, v/v) for subsequent analyses.
To analyze TAG content in cells and major polar lipid species, total lipids extracted by the above protocol were processed using an automated high-performance TLC platform (CAMAG). The detailed TLC method has been described (Siaut et al., 2011). Lipid molecular species were analyzed by LC-MS/MS, and conditions were detailed by Légeret et al. (2016).
Generation of Fatty Acid Methyl Esters and Quantification by Gas Chromatography-Flame Ionization Detection
The conversion of total lipids to their fatty acid methyl esters was carried out as described previously (Siaut et al., 2011). A fraction of extract was mixed in an 8-mL glass tube with 1 mL of methanol containing 5% (v/v) H2SO4, to which
10 mL of butylated hydroxytoluene (1%, v/v) and 5 to 25 mg of TAG (17:0/17:0/17:0) standard were added. Each sample was vortexed for 30 s and heated to 85°C for 90 min. After cooling to room temperature, 1.5 mL of 0.9% (w/v) NaCl was added together with 1 mL of hexane. Samples were vortexed for 10 min and centrifuged at 1,000g for 2 min at 4°C. The upper (organic) phase was then isolated with a clean glass Pasteur pipette and evaporated to dryness under a stream of N. Samples werefinally resuspended in hexane. Fatty acid methyl ester species were separated by the use of a TRACE GC Ultra gas chromatograph (Thermo Fisher Scientific) using a polar TR-WAX column (Thermo Fisher Scientific; 30 m 3 0.25 mm). Detailed gas chromatography conditions have been described (Nguyen et al., 2013).
Protein Extraction, SDS-PAGE, and Proteomic Analysis
Proteins were extracted from isolated LDs by the addition of cold acetone (80%, v/v) and SDS (0.3%, v/v). Extracted proteins were separated by SDS-PAGE following standard protocols (Sambrook and Russell, 2001). Proteins were then stained with a silver nitrate solution for 30 min. For proteomics analysis, samples in biological duplicates were concentrated at the top of a NuPage precasted gel (Invitrogen; stacking migration). Bands were cut and submitted to LC-MS/MS analysis following the same procedure as reported previously (Nguyen et al., 2011) except for the following: the LC-MS/MS ex-periment was performed on an LTQ-Orbitrap Velos Pro (Thermo Fisher Sci-entific) device coupled to an Ultimate 3000 LC system. The C. reinhardtii protein database used for Mascot (version 2.4.4; Matrix Science) searches was consti-tuted of the models downloaded from Phytozome (release 169_v4.3; http:// phytozome.jgi.doe.gov/) plus mitochondrion and plastid-encoded proteins from the National Center for Biotechnology Information (a total of 17,191 en-tries). Acetyl (protein N-a-acetylation) and Met oxidation were set as varia-ble modifications and carbamidomethyl Cys as a fixed modification. Two miscleavages were allowed. Mascot search results were automaticallyfiltered as described previously (Nguyen et al., 2011) with the IRMa 1.31.1 version software (Dupierris et al., 2009).
Microscopy
Samples were stainedfirst with Nile Red (Sigma) at a final concentration of 1mg mL21(from a stock solution of 1 mg mL21in methanol) for 10 min in the dark and then imaged with a confocal microscope (TCS SP2) using a 633 oil-immersion objective (Leica). The Nile Red signal was captured using a laser excitation line at 488 nm, and emission was collected between 554 and 599 nm. Chlorophyll autofluorescence was captured between 650 and 714 nm. Pseudocolors for images were obtained using ZEN software (Carl Zeiss).
Supplemental Data
The following supplemental materials are available.
Supplemental Figure S1.Changes in total fatty acid, C/N ratio, propor-tion of lipid classes, and fatty acid composipropor-tion during normal growth in LL and under SL.
Supplemental Figure S2.Polar membrane lipid molecular species pre-sent in LDs isolated from SL-exposed cells compared with those from N-starved cells.
Supplemental Table S1.Proteomic analyses of LDs isolated from either SL-exposed cells or cells starved of N for 24 h.
Supplemental Materials and Methods.
ACKNOWLEDGMENTS
We thank Patrick Carrier for assistance in running and maintaining PBRs. Received May 9, 2016; accepted June 10, 2016; published June 13, 2016.
LITERATURE CITED
Abida H, Dolch LJ, Meï C, Villanova V, Conte M, Block MA, Finazzi G, Bastien O, Tirichine L, Bowler C, et al(2015) Membrane glycerolipid remodeling triggered by nitrogen and phosphorus starvation in Phaeo-dactylum tricornutum. Plant Physiol 167: 118–136
Austin JR II, Frost E, Vidi PA, Kessler F, Staehelin LA(2006) Plastoglobules are lipoprotein subcompartments of the chloroplast that are permanently coupled to thylakoid membranes and contain biosynthetic enzymes. Plant Cell 18: 1693–1703
Bligh EG, Dyer WJ(1959) A rapid method of total lipid extraction and purification. Can J Biochem Physiol 37: 911–917
Bonente G, Pippa S, Castellano S, Bassi R, Ballottari M(2012) Acclimation of Chlamydomonas reinhardtii to different growth irradiances. J Biol Chem 287:5833–5847
Cagnon C, Mirabella B, Nguyen HM, Beyly-Adriano A, Bouvet S, Cuiné S, Beisson F, Peltier G, Li-Beisson Y(2013) Development of a forward genetic screen to isolate oil mutants in the green microalga Chlamydo-monas reinhardtii. Biotechnol Biofuels 6: 178
Chapman KD, Dyer JM, Mullen RT(2012) Biogenesis and functions of lipid droplets in plants. J Lipid Res 53: 215–226
Chen H, Hu J, Qiao Y, Chen W, Rong J, Zhang Y, He C, Wang Q(2015) Ca2+ -regulated cyclic electronflow supplies ATP for nitrogen starvation-induced lipid biosynthesis in green alga. Sci Rep 5: 15117
Dang KV, Plet J, Tolleter D, Jokel M, Cuiné S, Carrier P, Auroy P, Richaud P, Johnson X, Alric J, et al(2014) Combined increases in mi-tochondrial cooperation and oxygen photoreduction compensate for deficiency in cyclic electron flow in Chlamydomonas reinhardtii. Plant Cell 26:3036–3050
Dupierris V, Masselon C, Court M, Kieffer-Jaquinod S, Bruley C(2009) A toolbox for validation of mass spectrometry peptides identification and generation of database: IRMa. Bioinformatics 25: 1980–1981
Erickson E, Wakao S, Niyogi KK(2015) Light stress and photoprotection in Chlamydomonas reinhardtii. Plant J 82: 449–465
Fan J, Andre C, Xu C(2011) A chloroplast pathway for the de novo bio-synthesis of triacylglycerol in Chlamydomonas reinhardtii. FEBS Lett 585: 1985–1991
Fan J, Yan C, Andre C, Shanklin J, Schwender J, Xu C(2012) Oil accu-mulation is controlled by carbon precursor supply for fatty acid syn-thesis in Chlamydomonas reinhardtii. Plant Cell Physiol 53: 1380–1390 Farese RV Jr, Walther TC(2009) Lipid dropletsfinally get a little
R-E-S-P-E-C-T. Cell 139: 855–860
Fischer BB, Wiesendanger M, Eggen RIL(2006) Growth condition-dependent sensitivity, photodamage and stress response of Chlamydomonas reinhardtii exposed to high light conditions. Plant Cell Physiol 47: 1135–1145 Förster B, Mathesius U, Pogson BJ(2006) Comparative proteomics of high
light stress in the model alga Chlamydomonas reinhardtii. Proteomics 6: 4309–4320
Goodman JM(2008) The gregarious lipid droplet. J Biol Chem 283: 28005– 28009
Goodson C, Roth R, Wang ZT, Goodenough U(2011) Structural correlates of cytoplasmic and chloroplast lipid body synthesis in Chlamydomonas reinhardtii and stimulation of lipid body production with acetate boost. Eukaryot Cell 10: 1592–1606
Goold H, Beisson F, Peltier G, Li-Beisson Y (2015) Microalgal lipid droplets: composition, diversity, biogenesis and functions. Plant Cell Rep 34: 545–555
Harris EH(2001) Chlamydomonas as a model organism. Annu Rev Plant Physiol Plant Mol Biol 52: 363–406
He Q, Yang H, Wu L, Hu C(2015) Effect of light intensity on physiological changes, carbon allocation and neutral lipid accumulation in oleaginous microalgae. Bioresour Technol 191: 219–228
Hu Q, Sommerfeld M, Jarvis E, Ghirardi M, Posewitz M, Seibert M, Darzins A(2008) Microalgal triacylglycerols as feedstocks for biofuel production: perspectives and advances. Plant J 54: 621–639
Huang AHC(1992) Oil bodies and oleosins in seeds. Annu Rev Plant Physiol Plant Mol Biol 43: 177–200
Huang AHC(1996) Oleosins and oil bodies in seeds and other organs. Plant Physiol 110: 1055–1061
Jolivet P, Acevedo F, Boulard C, d’Andréa S, Faure JD, Kohli A, Nesi N, Valot B, Chardot T (2013) Crop seed oil bodies: from challenges in protein identification to an emerging picture of the oil body proteome. Proteomics 13: 1836–1849
Kandilian R, Pruvost J, Legrand J, Pilon L(2014) Influence of light ab-sorption rate by Nannochloropsis oculata on triglyceride production during nitrogen starvation. Bioresour Technol 163: 308–319
Kato N, Dong T, Bailey M, Lum T, Ingram D(2013) Triacylglycerol mo-bilization is suppressed by brefeldin A in Chlamydomonas reinhardtii. Plant Cell Physiol 54: 1585–1599
Kessler F, Vidi PA(2007) Plastoglobule lipid bodies: their functions in chloroplasts and their potential for applications. In A Fiechter, C Sautter, eds, Green Gene Technology: Research in an Area of Social Conflict. Springer, Berlin, pp 153–172
Khotimchenko SV, Yakovleva IM(2005) Lipid composition of the red alga Tichocarpus crinitus exposed to different levels of photon irradiance. Phytochemistry 66: 73–79
Khozin-Goldberg I, Cohen Z(2011) Unraveling algal lipid metabolism: recent advances in gene identification. Biochimie 93: 91–100
Kim H, Jang S, Kim S, Yamaoka Y, Hong D, Song WY, Nishida I, Li-Beisson Y, Lee Y(2015) The small molecule fenpropimorph rapidly converts chloroplast membrane lipids to triacylglycerols in Chlamydo-monas reinhardtii. Front Microbiol 6: 54
Kim S, Kim H, Ko D, Yamaoka Y, Otsuru M, Kawai-Yamada M, Ishikawa T, Oh HM, Nishida I, Li-Beisson Y, et al(2013) Rapid induction of lipid droplets in Chlamydomonas reinhardtii and Chlorella vulgaris by brefeldin A. PLoS ONE 8: e81978
Klein U, Betz A(1978) Fermentative metabolism of hydrogen-evolving Chlamydomonas moewusii. Plant Physiol 61: 953–956
Klok AJ, Martens DE, Wijffels RH, Lamers PP (2013) Simultaneous growth and neutral lipid accumulation in microalgae. Bioresour Technol 134:233–243
Légeret B, Schulz-Raffelt M, Nguyen HM, Auroy P, Beisson F, Peltier G, Blanc G, Li-Beisson Y(2016) Lipidomic and transcriptomic analyses of Chlamydomonas reinhardtii under heat stress unveil a direct route for the conversion of membrane lipids into storage lipids. Plant Cell Environ 39: 834–847
Li Y, Beisson F, Pollard M, Ohlrogge J(2006) Oil content of Arabidopsis seeds: the influence of seed anatomy, light and plant-to-plant variation. Phytochemistry 67: 904–915
Li-Beisson Y, Beisson F, Riekhof W(2015) Metabolism of acyl-lipids in Chlamydomonas reinhardtii. Plant J 82: 504–522
Liu B, Benning C(2013) Lipid metabolism in microalgae distinguishes it-self. Curr Opin Biotechnol 24: 300–309
Ma X, Liu J, Liu B, Chen T, Yang B, Chen F(2016) Physiological and bio-chemical changes reveal stress-associated photosynthetic carbon partitioning into triacylglycerol in the oleaginous marine alga Nannochloropsis oculata. Algal Research 16: 28–35
Martinis J, Glauser G, Valimareanu S, Kessler F (2013) A chloroplast ABC1-like kinase regulates vitamin E metabolism in Arabidopsis. Plant Physiol 162: 652–662
Merchant SS, Kropat J, Liu B, Shaw J, Warakanont J(2012) TAG, you’re it! Chlamydomonas as a reference organism for understanding algal tri-acylglycerol accumulation. Curr Opin Biotechnol 23: 352–363 Mettler T, Mühlhaus T, Hemme D, Schöttler MA, Rupprecht J, Idoine A,
Veyel D, Pal SK, Yaneva-Roder L, Winck FV, et al(2014) Systems analysis of the response of photosynthesis, metabolism, and growth to an increase in irradiance in the photosynthetic model organism Chlamydomonas reinhardtii. Plant Cell 26: 2310–2350
Moellering ER, Benning C(2010) RNA interference silencing of a major lipid droplet protein affects lipid droplet size in Chlamydomonas rein-hardtii. Eukaryot Cell 9: 97–106
Nguyen HM, Baudet M, Cuiné S, Adriano JM, Barthe D, Billon E, Bruley C, Beisson F, Peltier G, Ferro M, et al(2011) Proteomic profiling of oil bodies isolated from the unicellular green microalga Chlamydomonas reinhardtii: with focus on proteins involved in lipid metabolism. Pro-teomics 11: 4266–4273
Nguyen HM, Cuiné S, Beyly-Adriano A, Légeret B, Billon E, Auroy P, Beisson F, Peltier G, Li-Beisson Y (2013) The green microalga
Chlamydomonas reinhardtii has a singlev-3 fatty acid desaturase that localizes to the chloroplast and impacts both plastidic and extraplastidic membrane lipids. Plant Physiol 163: 914–928
Pal D, Khozin-Goldberg I, Cohen Z, Boussiba S(2011) The effect of light, salinity, and nitrogen availability on lipid production by Nannochloropsis sp. Appl Microbiol Biotechnol 90: 1429–1441
Peers G, Truong TB, Ostendorf E, Busch A, Elrad D, Grossman AR, Hippler M, Niyogi KK (2009) An ancient light-harvesting protein is critical for the regulation of algal photosynthesis. Nature 462: 518–521 Rosenberg JN, Oyler GA, Wilkinson L, Betenbaugh MJ(2008) A green
light for engineered algae: redirecting metabolism to fuel a biotechnol-ogy revolution. Curr Opin Biotechnol 19: 430–436
Sambrook J, Russell DW(2001) Molecular Cloning: A Laboratory Manual. Cold Spring Harbor Laboratory Press, Cold Spring Harbor, NY Sato R, Ito H, Tanaka A(2015) Chlorophyll b degradation by chlorophyll b
reductase under high-light conditions. Photosynth Res 126: 249–259 Scott SA, Davey MP, Dennis JS, Horst I, Howe CJ, Lea-Smith DJ, Smith
AG(2010) Biodiesel from algae: challenges and prospects. Curr Opin Biotechnol 21: 277–286
Sheehan J, Dunahay T, Benemann J, Roessler PG(1998) A Look Back at the U.S. Department of Energy’s Aquatic Species Program: Biodiesel from Algae. National Renewable Energy Laboratory, Golden, CO Siaut M, Cuiné S, Cagnon C, Fessler B, Nguyen M, Carrier P, Beyly A,
Beisson F, Triantaphylidès C, Li-Beisson Y, et al(2011) Oil accumu-lation in the model green alga Chlamydomonas reinhardtii: characteriza-tion, variability between common laboratory strains and relationship with starch reserves. BMC Biotechnol 11: 7
Tardif M, Atteia A, Specht M, Cogne G, Rolland N, Brugière S, Hippler M, Ferro M, Bruley C, Peltier G, et al(2012) PredAlgo: a new subcel-lular localization prediction tool dedicated to green algae. Mol Biol Evol 29:3625–3639
Tolleter D, Ghysels B, Alric J, Petroutsos D, Tolstygina I, Krawietz D, Happe T, Auroy P, Adriano JM, Beyly A, et al(2011) Control of hy-drogen photoproduction by the proton gradient generated by cyclic electronflow in Chlamydomonas reinhardtii. Plant Cell 23: 2619–2630 Tsai CH, Warakanont J, Takeuchi T, Sears BB, Moellering ER, Benning C
(2014) The protein Compromised Hydrolysis of Triacylglycerols 7 (CHT7) acts as a repressor of cellular quiescence in Chlamydomonas. Proc Natl Acad Sci USA 111: 15833–15838
Tsai CH, Zienkiewicz K, Amstutz CL, Brink BG, Warakanont J, Roston R, Benning C (2015) Dynamics of protein and polar lipid recruitment during lipid droplet assembly in Chlamydomonas reinhardtii. Plant J 83: 650–660
Tzen JTC, Huang AHC(1992) Surface structure and properties of plant seed oil bodies. J Cell Biol 117: 327–335
Urzica EI, Vieler A, Hong-Hermesdorf A, Page MD, Casero D, Gallaher SD, Kropat J, Pellegrini M, Benning C, Merchant SS(2013) Remod-eling of membrane lipids in iron-starved Chlamydomonas. J Biol Chem 288:30246–30258
Wang ZT, Ullrich N, Joo S, Waffenschmidt S, Goodenough U(2009) Algal lipid bodies: stress induction, purification, and biochemical characteri-zation in wild-type and starchless Chlamydomonas reinhardtii. Eukaryot Cell 8: 1856–1868
Wijffels RH, Barbosa MJ(2010) An outlook on microalgal biofuels. Science 329:796–799
Zhekisheva M, Boussiba S, Khozin-Goldberg I, Zarka A, Cohen Z(2002) Accumulation of oleic acid in Haematococcus pluvialis (Chlorophyceae) under nitrogen starvation or high light is correlated with that of astaxanthin esters. J Phycol 38: 325–331