HAL Id: cea-02974095
https://hal-cea.archives-ouvertes.fr/cea-02974095
Submitted on 21 Oct 2020HAL is a multi-disciplinary open access archive for the deposit and dissemination of sci-entific research documents, whether they are pub-lished or not. The documents may come from teaching and research institutions in France or abroad, or from public or private research centers.
L’archive ouverte pluridisciplinaire HAL, est destinée au dépôt et à la diffusion de documents scientifiques de niveau recherche, publiés ou non, émanant des établissements d’enseignement et de recherche français ou étrangers, des laboratoires publics ou privés.
A criterion to classify void fraction profiles in bubbly
flows based on averaged flow quantities for use in
subchannel codes
R. Kommajosyula, G. Bois, Alan Burlot, M.-G. Rodio, B. Cariteau, E.
Baglietto
To cite this version:
R. Kommajosyula, G. Bois, Alan Burlot, M.-G. Rodio, B. Cariteau, et al.. A criterion to classify void fraction profiles in bubbly flows based on averaged flow quantities for use in subchannel codes. NURETH18 2019 - 18th International Topical Meeting on Nuclear Reactor Thermal Hydraulics, ANS, Aug 2019, Portland, United States. �cea-02974095�
A CRITERION TO CLASSIFY VOID FRACTION PROFILES IN BUBBLY
FLOWS BASED ON AVERAGED FLOW QUANTITIES FOR USE IN
SUBCHANNEL CODES
Ravikishore Kommajosyula*
1, Guillaume Bois
2, Alan Burlot
21
Department of Mechanical Engineering
Massachusetts Institute of Technology
77 Massachusetts Avenue, Cambridge, MA 02139, USA
[email protected];
[email protected]
; [email protected]
Maria-Giovanna Rodio
2, Benjamin Cariteau
22
Den-Service de thermo-hydraulique et de mécanique des fluides (STMF)
CEA, Université Paris-Saclay,
F-91191 Gif-sur-Yvette, France
[email protected]; [email protected]
Emilio Baglietto
33
Department of Nuclear Science & Engineering
Massachusetts Institute of Technology
77 Massachusetts Avenue, Cambridge, MA 02139, USA
[email protected]
ABSTRACT
Hydrodynamics of multiphase flows can have a large influence on the overall design and operation of nuclear reactors. Interfacial forces drive bubbles towards or away from the wall, resulting in wall-peaked or core-peaked void fraction profiles. This change has a dramatic effect on the averaged flow quantities such as wall shear stress, velocity profiles and turbulence levels. Subchannel codes lack information of the underlying flow profiles, and rely on closure models to impose the correct averaged flow quantities. In this work, we propose a criterion to classify bubbly flows as wall-peaked or core-peaked, based on the turbulence level, and the ratio of surface tension to buoyancy forces. The criterion has been developed leveraging a large set of adiabatic air-water bubbly flow experiments, and can be used in subchannel codes to identify the underlying void fraction profile and apply the appropriate closure model. The criterion shows low sensitivity when applied to different operating fluids, and thus can be extended into a generalized formulation that can be applied to all adiabatic bubbly flows. An experiment has also been proposed to confirm the classification criterion at reactor conditions, using water with additives at atmospheric pressure to mitigate the high cost of high-pressure experiments. The new criterion proposed in this work, along with the improved understanding from new experiments, will allow us to develop more physically consistent closure models for subchannel codes.
KEYWORDS Bubbly flow, interfacial forces, lateral migration, lift inversion
1. INTRODUCTION
Predicting the behavior of two-phase bubbly flows is of interest in a wide range of engineering
applications. It is particularly important for nuclear reactor safety analysis to develop simulation tools that accurately represent the physics of two-phase flows. Such simulation tools allow us to design and operate better nuclear reactors with higher efficiencies, while respecting the safety margins set by the regulator, thus making reactors more cost-effective.
There are several simulation methodologies available to perform Nuclear Reactor Safety analysis, which can be classified as shown in Figure 1. System codes that perform transient analysis at the level of the whole reactor are shown at the extreme right. To its left are Component (Subchannel) codes, that perform simulations at the level of individual components. The component being simulated is represented as a series of control volumes with averaged flow properties within each control volume (assembly or subchannel). To its left are Computational Multiphase Fluid Dynamics (CMFD) codes, that solve the averaged conservation equations in the two-fluid one-pressure Eulerian-Eulerian framework, to get the flow profiles within an element. Direct Numerical Simulation codes, that explicitly track individual bubbles and solve for the instantaneous flow profiles are shown on the extreme left. There is an increase in the computational power requirement as we traverse from right to left, thereby limiting the scale of problems that can be addressed at finer scales of resolution. On the other hand, there is an increased modeling effort as we go towards the right as we need more closure relations to account for the effect of the underlying physics. Finer resolution methods (on the left) are used to better understand the physics that need to be modeled as we go to more abstract representations of the system on the right, and this process is referred to as upscaling of information.
In this paper, we focus on simulating bubbly flow in component codes, which is a problem of great interest and occurs in a variety of nuclear reactor safety evaluations. In component scale codes, the flow domain is modeled as a series of control volumes along the flow that span the cross-section of the flow. Solution variables are generally averaged over the whole cross-section, consequently information
Figure 1. Classification of simulation methodologies used in nuclear reactor safety analysis. The computational power requirement increases as we go towards the left of the image as we resolve more physics. On the contrary, we model more physics as we go towards the right of the image, leading to increased
regarding the flow or void-fraction profiles are not available in component scale codes and the effect of the underlying flow profile must be modeled. For example, an additional closure models that imposes a wall friction coefficient is required to compute the correct pressure drop along the flow. In the case of bubbly flows, it has been observed experimentally [1, 2] that the interfacial forces acting on the bubbles drive them towards or away from the wall, resulting in wall-peaked or core-peaked void fraction profiles depending on the flow conditions. This transition in void fraction profiles has a dramatic effect on averaged flow quantities such as the wall shear stress, velocity profiles and turbulence levels. This presents us a problem in simulating bubbly flows in component codes due to the lack of:
i. information about the underlying void fraction profiles
ii. closure models for flow parameters that account for the void fraction profiles
In this work, we propose a criterion that can be used in component codes to classify bubbly flows based on their void fraction profile as wall-peaked or core-peaked. This criterion will form the basis for
developing closure models for flow parameters in component scale codes, that account for the underlying void fraction profile. The physics governing the lateral redistribution of voids in bubbly flow is discussed in Section 2. The methodology used to develop the criterion to classify bubbly flows is described in Section 3. An approach to extend the classification criterion to bubbly flows at reactor conditions is discussed in Section 4, and is followed by conclusions and directions for future work in Section 5.
2. LATERAL REDISTRIBUTION OF VOIDS IN BUBBLY FLOW
The phenomenon of lateral redistribution of void in bubbly flow due to turbulence and interfacial forces acting on the bubbles was introduced in Section 1. We require a better understanding of the physics governing the lateral redistribution of voids, to develop a criterion to classify bubbly flows based on their void fraction profile as wall-peaked or core-peaked. The required physical understanding and related work done by previous researchers is presented in this section.
The different forces acting on the bubble can be studied from the the conservation of momentum, written separately for each phase as below
𝜕(𝛼𝑘𝑈𝑘,𝑖) 𝜕𝑡 + 𝜕(𝛼𝑘𝑈𝑘,𝑖𝑈𝑘,𝑖) 𝜕𝑥𝑖 = 𝜕 𝜕𝑥𝑗 [𝛼𝑘(𝜈 + 𝝂𝒕) ( 𝜕𝑈𝑘,𝑖 𝜕𝑥𝑖 +𝜕𝑈𝑘,𝑗 𝜕𝑥𝑖 )] −𝛼𝑘 𝜌𝑘 𝜕𝑃 𝜕𝑥𝑖 + 𝛼𝑘𝑔 + 𝑀𝑘 (1)
where 𝛼𝑘 represents the void fraction of phase 𝑘, 𝑈𝑘,𝑖 denotes the velocity of phase 𝑘 in direction 𝑖,
𝜈 represents the viscosity of the fluid, and 𝑀𝑘 represents the interfacial forces acting on phase 𝑘. The
interfacial forces act on the boundary of the phase and can be expressed as a sum of forces corresponding to different physical effects.
𝑀 = 𝐹𝐷𝑟𝑎𝑔+ 𝐹𝐿𝑖𝑓𝑡+ 𝐹𝑇𝑢𝑟𝑏𝑢𝑙𝑒𝑛𝑡𝐷𝑖𝑠𝑝𝑒𝑟𝑠𝑖𝑜𝑛+ 𝐹𝑊𝑎𝑙𝑙𝐿𝑢𝑏𝑟𝑖𝑐𝑎𝑡𝑖𝑜𝑛 (2)
Amongst the interfacial forces listed above, the lift force is the only force that can lead to accumulation of voids at the wall, or away from the wall. The drag force acts against the direction of flow and thus does not cause a lateral migration of voids. The turbulent dispersion force acts in equal measure in the directions towards and away from the wall, resulting in smoothening the peaks in the void fraction profile (diffusive effect) - therefore, it does not lead to accumulation of voids at the wall or away from it. The wall lubrication force is a fictitious force that acts only at the wall to impose the correct void fraction behavior in the vicinity of the wall. The physics governing the lateral redistribution of voids in bubbly flows can thus be understood by studying the lift force acting on the bubble. The lift force is defined as positive when it pushes the bubble towards the wall and negative when it acts away from the wall. A
positive lift force results in a wall-peaked profile and a negative lift force leads to a core-peaked profile as shown in Figure 2.
One of the first understanding of the lift force acting on the bubbles comes from the work of Tomiyama et. al. [1] based on their experimental observations of injecting single bubbles in a shear driven laminar flow. It was observed that the deformability of the bubble influenced the lateral migration of the bubble as it rose up the channel. The deformability of the bubble was quantified using the Eötvös number (𝐸𝑜), which is defined as the ratio of the buoyancy to surface tension forces acting on the bubble, and has the following expression
𝐸𝑜 =Δ𝜌𝑔𝐷𝐵
2
𝜎 (3)
where Δ𝜌 is the difference between the liquid and gas densities, 𝑔 is the acceleration due to gravity, 𝐷𝐵 is
the diameter of the bubble, and 𝜎 is the surface tension of the liquid. The Eötvös number is a measure of the relative importance of buoyancy to surface tension forces. For higher Eötvös numbers, the buoyancy force dominates over the surface tension force, making the bubble interface more deformable. The results from the experiments were used to develop a correlation for the lift force, which is widely used in the current CMFD codes. The critical Eötvös number above which the lift coefficient transitions from positive to negative was defined as 𝐸𝑜𝑐= 4.59 in the correlation. This change in the sign of the lift
coefficient from positive to negative when the Eötvös number exceeds a critical value, is referred to as lift inversion. The void fraction profile experiences a transition from wall-peaked to core-peaked when the Eötvös number exceeds the critical Eötvös number.
Recent work from Sugrue [3] has focused on developing a closure model for the lift force acting on bubbles applicable to turbulent flow. Experimental results from Hibiki et. al. [2], and Direct Numerical Simulations (DNS) results from Lu et. al. [4] and Feng et. al. [5] were used in their work to gain an improved understanding of the lift force on a group of bubbles in turbulent flows. In comparison to shape induced transition applicable to laminar flow conditions, it has been observed that an increase in the level of turbulence in the flow enhances the surface mobility of the bubbles. This results in a transition to core-peaked void fraction profile at lower Eötvös numbers than that predicted by Tomiyama et. al. [1]. The effect of enhanced surface mobility resulting in a lift inversion at lower Eötvös numbers is quantified using a non-dimensional Wobble number as shown below
𝑊𝑜 = 𝐸𝑜. 𝑘
𝑢𝑟𝑒𝑙2 (4)
Figure 2. Illustration of wall-peaked (in red) and core-peaked (in blue) void fraction profiles in a bubbly flow. A positive lift force on the bubbles leads to a wall-peaked
where 𝑘 is the turbulent kinetic energy of the liquid and 𝑢𝑟𝑒𝑙 is the relative velocity between the two phases. This result suggests that the physics behind the transition of the void fraction profiles from wall-peaked to core-wall-peaked is governed by the deformability of the bubbles and the level of turbulence in the flow.
3. TRANSITION CRITERION FOR BUBBLY FLOWS CLASSIFICATION
In this section, we present the methodology used to develop the criterion to classify bubbly flows as wall-peaked or core-wall-peaked based on the void fraction profile. The first part of the section focuses on
developing the criterion using adiabatic air-water experiments. The second part focuses on testing the validity of the developed criterion to different operating fluids.
3.1. Transition Criterion derivation from Adiabatic Air-Water experiments
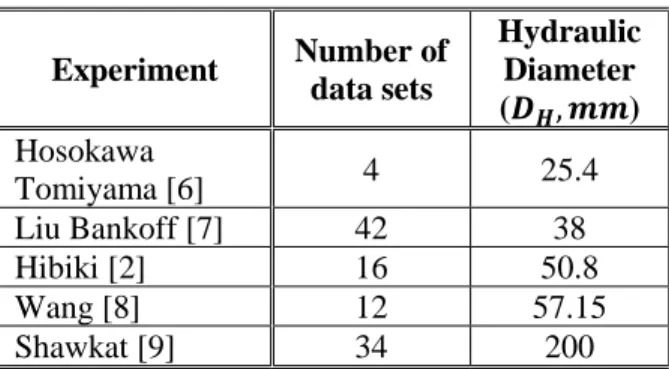
As discussed in Section 2, the interfacial forces on the bubble push the bubbles towards or away from the wall, resulting in wall-peaked or core-peaked void fraction profiles. In order to isolate the effect of interfacial forces on the bubbles, we use data from adiabatic experiments with air and water as working fluids. The list of adiabatic air-water experiments used to develop the criterion are listed in Table I. All the experiments listed were performed at atmospheric pressure by injecting air bubbles into the flow. The choice of experimental databases was restricted by the availability of data in open literature. The
hydraulic diameter varies by almost an order of magnitude between the different experiments, thereby spanning a wide range of flow conditions and liquid turbulence levels.
Experiment Number of data sets Hydraulic Diameter (𝑫𝑯, 𝒎𝒎) Hosokawa Tomiyama [6] 4 25.4 Liu Bankoff [7] 42 38 Hibiki [2] 16 50.8 Wang [8] 12 57.15 Shawkat [9] 34 200
Each experiment listed in Table I provides the inlet superficial velocities of water and air, bubble diameters and the void fraction profiles, in addition to other measured quantities such as the velocity profiles and in some cases the velocity fluctuations. Following the discussion in the previous section, we understand that the liquid turbulence level and bubble deformability are the main drivers for the lateral migration of void. We compute the non-dimensional numbers that quantify the liquid turbulence level and the bubble deformability, namely the liquid Reynolds number (𝑅𝑒𝑙), and the Eötvös number (𝐸𝑜). The
Eötvös number is computed using the expression from Equation 3, and the liquid Reynolds number is defined as
𝑅𝑒𝑙 =
𝜌𝑙𝑗𝑙𝐷𝐻
𝜇𝑙𝛼𝑙
(5) where 𝜌𝑙 is the liquid density, 𝑗𝑙 is the superficial velocity of the liquid, 𝐷𝐻 is the hydraulic diameter of
the pipe, 𝜇𝑙 is the viscosity of the liquid, and 𝛼𝑙 is the liquid fraction. The Reynolds number is the ratio of
Table I. Adiabatic Air-Water experimental data used to develop the classification criterion
the inertial to the viscous forces in the flow, and thus a larger Reynolds number is indicative of a higher turbulence level in the flow.
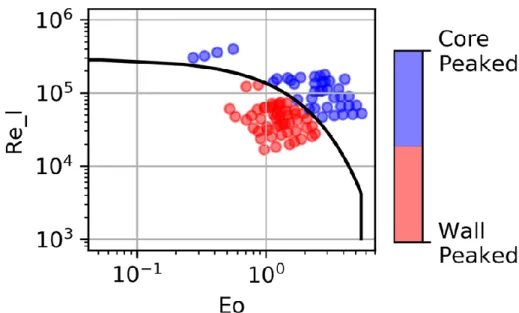
The measurements of void fraction profiles from the experimental data are used to classify each data set as wall-peaked or core-peaked by visual inspection. In addition, the liquid Reynolds number and the Eötvös number are computed for each set using the reported values of the liquid and gas superficial velocities and the measured values of the bubble diameter and void fraction. The different experimental sets are plotted in Figure 3 with the Eötvös number in the X-axis and the Reynolds number in the Y-axis. The different experimental sets are differentiated based on the void fraction profile, with the wall-peaked profiles plotted in red and the core-peaked profiles plotted in blue.
The experimental sets of adiabatic air-water experiments plotted in Figure 3 show a clear way to classify the wall-peaked and core-peaked void fraction profiles. We observe that the critical Eötvös number at which there is a transition from wall-peaked to core-peaked profiles, reduces as the Reynolds number increases. This is in agreement with the work from Sugrue [3] who proposes that the turbulence enhances the surface mobility of the bubble, leading to the transition to a core-peaked profile at lower Eötvös number. The classification boundary for the void fraction profile transition is characterized as a Critical Eötvös number (𝐸𝑜𝑐) using a least square fit shown in Equation 6. The void fraction profile of the flow is
wall-peaked when the Eötvös number is less than the Critical Eötvös number and transitions to a core-peaked profile when the Eötvös number exceeds the Critical Eötvös number.
𝐸𝑜𝑐 = 𝑚𝑎𝑥(0, 𝑚𝑖𝑛(4.59, 16.4 − 3 × log10𝑅𝑒𝑙)) (6)
The lower bound of the transition criterion is set to zero for the cases with very high liquid Reynolds number, to prevent the criterion from predicting unphysical negative Eötvös numbers. It indicates that the transition becomes independent of the Eötvös number (and therefore of the bubble deformability) when the background turbulence in the liquid is large enough. On the other hand, the upper bound of the transition criterion is set to 4.59 for the cases with low liquid Reynolds number where the observations
Figure 3. Level of Turbulence in the flow (measured as the liquid Reynolds number) plotted against bubble deformability (measured as the Eotvos number) for the experimental databases listed in Table I. The points
are colored as Red and Blue based on the void fraction profile being wall-peaked and core-peaked respectively. The transition boundary developed in this work to classify bubbly flows based on the void
from experiments of single bubbles rising in a shear driven laminar flow from Tomiyama et. al. [1] becomes relevant.
3.2. Testing the validity of the transition criterion for different operating fluids
A transition criterion to classify bubbly flows based on the void fraction profile as wall-peaked or core-peaked has been developed in Section 3.1. The criterion was developed based on adiabatic air-water experiments performed at atmospheric pressure. The choice of experimental databases was restricted by the availability of such data in open literature. In this section, we test the transition criterion with
experimental data involving different operating fluids and flow conditions, to evaluate its applicability to reactor conditions. The transition criterion is tested on the CHAPTAL [10] and TOPFLOW [11]
experiments, and the corresponding results are presented below. The choice of experiments was restricted by the availability of data in open literature.
3.2.1. CHAPTAL experiment
The CHAPTAL experiment [10] is a part of the NEPTUNE project. Adiabatic high-pressure bubbly flow experiments were performed in a 5 m long vertical pipe with an inside diameter of 38 mm. The
experiments were performed at an operating pressure of 9 bars with water as the working fluid and gas bubbles made of R116 refrigerant composing of the vapor phase. The R116 bubbles are injected at the wall and measurements of the liquid and gas void fractions, velocities, and liquid velocity fluctuation profiles are measured at three different planes along the pipe. The flow conditions were chosen to match the non-dimensional numbers that are representative of reactor operating conditions [10].
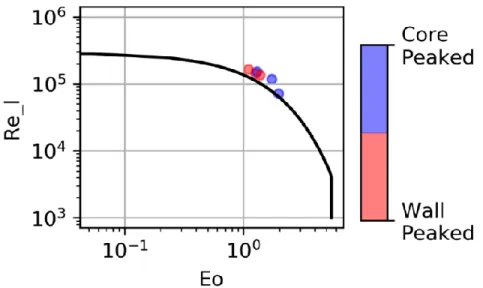
The applicability of the transition criterion to the CHAPTAL experiment is evaluated here. The measured void fraction profiles are used to classify the flow conditions in the experiment as wall-peaked or core-peaked. We observe that the measured void fraction profiles are not fully developed between the last two measuring planes. Moreover, some of the cases reported in the experiment exhibit transitory behavior with void fraction profiles that switch between wall-peaked and core-peaked at different measurement planes. This suggests that the flow conditions explored in the experimental campaign are close to the transition boundary. The liquid Reynolds number and Eötvös number for the different experimental cases are computed using the flow measurements and are used to plot the data along with the classification boundary, in Figure 4. The experimental cases which exhibit a change in behavior between different sections are categorized based on the measurements at the last measurement plane due to lack of additional information.
The transition criterion plotted in Figure 4 has been developed in Section 3.1 based on data from adiabatic air-water bubbly flow experiments. The cases considered in the CHAPTAL experiment are located very close to the transition boundary as shown in the figure. This suggests that the transition criterion proposed has a small sensitivity to fluid properties. This is also in agreement with our initial observations about the CHAPTAL experiments that the void fraction profiles are not fully developed and exhibit transitory behavior.
3.2.2. TOPFLOW experiment
TOPFLOW [11] is a multipurpose thermohydraulic test facility located in Helmholtz Zentrum Dresden Rossendorf (HZDR), Germany. The experiments comprise of a large range of flow conditions spanning several flow regimes and thermal hydraulic conditions. In this work, two experimental sets for adiabatic steam-water bubbly flow at 65 bars were used to test the transition criterion. The cases corresponding to a liquid superficial velocity of 𝑗𝑙 = 1 𝑚/𝑠 and gas superficial velocity of 𝑗𝑔= 0.22 𝑚/𝑠 in a pipe of
diameter 𝐷𝐻= 200 𝑚𝑚 were considered in this work. The measured void fraction and bubble diameter
profiles were used to classify the profiles and compute the Reynolds and Eötvös numbers. The non-dimensional numbers for the case with 𝑗𝑙 = 1 𝑚/𝑠 and 𝑗𝑔= 0.22 𝑚/𝑠 were computed as 𝑅𝑒𝑙 =
1.83 × 10⁶ and 𝐸𝑜 = 3.359. Comparing with the transition boundary characterized in Equation 6, we observe that the computed Eötvös number is greater than the critical Eötvös number, thus predicting a core-peaked void fraction profile. The measured void fraction profile [11] shows that the profile is indeed core-peaked. This observation supports the claim made in Section 3.2.1 that the transition criterion has a low sensitivity to fluid properties and can be safely applied to flow conditions that are far from the transition boundary.
4. EXTENDING THE VALIDITY OF THE TRANSITION CRITERION
A transition criterion for classifying bubbly flows based on the void fraction profile as wall-peaked or core-peaked has been developed in Section 3.1. The criterion was developed based on adiabatic air-water
Figure 4. Level of Turbulence in the flow (measured as the liquid Reynolds number) plotted against bubble deformability (measured as the Eotvos number) for
the CHAPTAL experiment. We can observe that all the flow conditions considered in the CHAPTAL experiment lie very close to the transition boundary
bubbly flow experiments performed at atmospheric pressure. To ascertain the applicability of the transition criterion to varying fluids and flow conditions, the method was applied to lower density ratio experimental databases in Section 3.2. The major finding of the evaluation was that the transition criterion has a small sensitivity to fluid properties and can be applied when the flow conditions are far from the transition boundary. However, due to lack of data in open literature, not much can be said about the applicability of the criterion when the flow conditions are in proximity of the transition boundary. In this section, we propose a methodology to extend the transition criterion to general fluids and flow conditions with applicability to Nuclear Reactor Safety evaluation in mind.
The transition criterion developed in Section 3.1 is based on adiabatic air-water experiments at atmospheric pressure and accounts for the level of turbulence in the flow and the deformability of the bubbles. In addition, the criterion should include a dependency on the properties of the fluid to ensure general applicability. Existing literature was reviewed to identify ways in which previous researchers approached the problem of characterizing bubbly flows. The Clift’s cartography [12] uses Morton number, which depends only on fluid properties to classify different bubble regimes. The Morton number was found to be the most promising candidate that can be added as a parameter to the transition criterion. The Morton number is defined as
𝑀𝑜 =𝑔𝜇𝑙Δ𝜌
𝜌𝑙2𝜎3 (7)
where 𝑔 is the acceleration due to gravity, 𝜇𝑙 is the viscosity of the liquid, Δ𝜌 is the difference between
the liquid and gas densities, 𝜌𝑙 is the liquid density, and 𝜎 is the surface tension of the liquid. With the
addition of the dependency on the Morton number, the classification criterion would be modified as shown below
𝐸𝑜𝑐 = 𝑓(𝑅𝑒𝑙, 𝑀𝑜) (8)
where 𝑓 is an arbitrary function that is yet to be defined. The exact functional form of 𝑓 can be defined based on data from experiments or simulations that characterize the transition boundary for different fluids spanning a range of flow conditions. A computational study to characterize the transition boundary is not possible at this time due to the lack of models that can accurately describe the lateral migration of void for general fluids. Therefore, we propose an experimental study to characterize the void fraction profile transition boundary for varying fluid properties.
4.1. Designing an experiment to characterize the Transition Criterion
In this section, we propose a set of experiments to characterize the transition criterion for varying fluid properties. The dependency of the transition criterion on fluid properties is assumed to be captured by variation in Morton number. The experiments are to be conducted with water as the working fluid and air bubbles are injected into the flow. The temperatures of the working fluid are controlled to maintain adiabatic conditions. The Morton number of the flow with air bubbles in water at atmospheric pressure at a temperature of 20° C is 𝑀𝑜 = 1.6 × 10⁻¹¹. The Morton number of water-steam flow at reactor
conditions is 𝑀𝑜 = 5 × 10⁻¹⁴. We wish to study the variation of the void fraction profile transition boundary for a range of Morton numbers. The variation in Morton number is achieved by raising the temperature of the water or adding glycerol, to reduce or increase the Morton number of the flow. This would allow us to perform the experiment at atmospheric pressure while exploring a broad range of Morton numbers close to the ones relevant at reactor conditions. The range of Morton numbers from 10−13< 𝑀𝑜 < 10−9 can be explored using the methodology proposed in this work. This should give us
a trend of the behavior with changing Morton numbers that can be used to study the effect of fluid properties on the transition boundary. The flow conditions and injector geometry should be controlled to
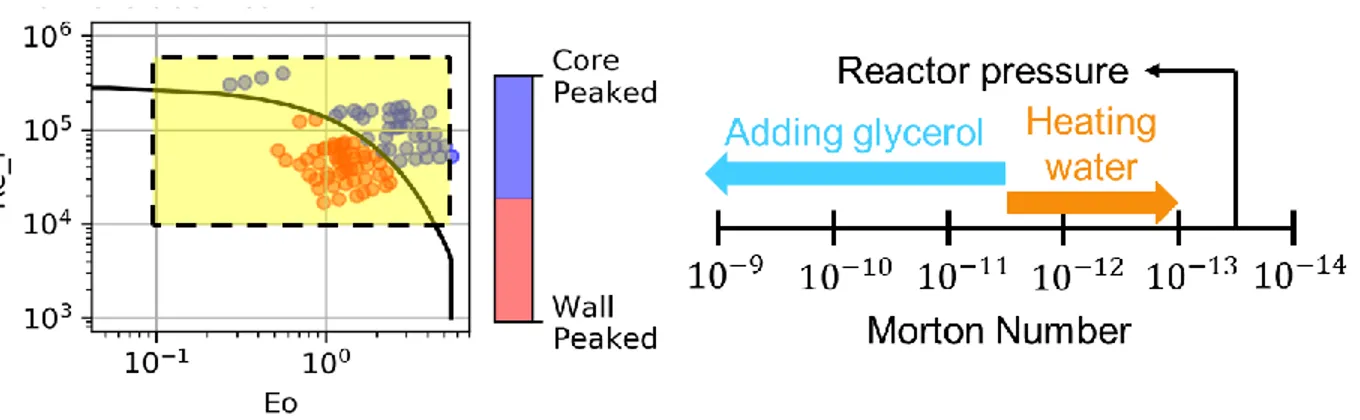
explore ranges of Reynolds and Eötvös numbers that are required to sufficiently characterize the Transition Boundary. The range of flow conditions and fluid properties that are meant to be explored in the experiment are shown in Figure 5.
To explore the range of flow conditions that will sufficiently characterize the Transition Boundary, we aim to explore a range of liquid Reynolds numbers spanning from 104< 𝑅𝑒
𝑙 < 106. The liquid Reynolds
number can be controlled by varying the superficial velocities of the liquid and the gas at the inlet. The Eötvös number cannot be directly controlled as it depends on the bubble diameter, which evolves with the flow. It is proposed to use several injector geometries and sizes to be able to inject bubbles of different sizes thus allowing us to explore different Eötvös numbers. The range of Reynolds and Eötvös numbers we wish to explore in the experiment are highlighted in Figure 5. The dependency on flow properties is characterized by performing the experiment at different Morton numbers. In addition, we propose to build test sections with circular and rectangular cross sections with several aspect ratios, to study the effect of flow geometry on the lateral distribution of voids in bubbly flow. A summary of the experimental parameters that are varied, and the effects that we intend to study in the experiment is presented in Table II.
Experimental parameter that is
varied Intended effect we wish to study Liquid and gas flow rate Level of turbulence in the flow
(Reynolds number) Gas flow rate and Injector geometry Void fraction, bubble size and
Eötvös number Adding Glycerol to water Increase the Morton number Increasing the temperature of water Reduce the Morton number Test sections with circular and
rectangular cross sections
Study the effect of geometry on lateral distribution of void
The experiments are currently being designed at Den-Service de thermo-hydraulique et de mécanique des fluides (STMF), CEA. These experiments will allow us to study the variation in the transition boundary for different fluid properties. The experimental data would allow us to develop an improved criterion that
Table II. Adiabatic Air-Water experimental data used to develop the classification criterion
Figure 5. Range of flow parameter and fluid parameters to be explored in the proposed experiment to characterize the transition boundary for varying fluid properties. The highlighted region on the left shows the
range of liquid Reynolds number and Eotvos number that need to be considered. The figure on the right shows how different Morton numbers can be explored using water as a working fluid at atmospheric pressure
accounts for the fluid properties, to classify adiabatic bubbly flows based on void fraction profiles or to confirm the validity of the current criterion for a large variety of fluids/Morton numbers. The data can also be used to inform model development for interfacial forces in CMFD.
5. CONCLUSIONS
Interfacial forces in bubbly flows drive the bubbles towards or away from the wall resulting in wall-peaked and core-wall-peaked void fraction profiles. In this work, we developed a criterion based on adiabatic air-water experimental data that can be used in subchannel codes to classify the void fraction profile as wall-peaked or core-peaked, based on the level of turbulence in the flow and the bubble deformability. The criterion forms a basis for developing closure models for subchannel codes to account for the underlying void fraction profiles to impose the correct averaged flow quantities. The developed criterion shows small sensitivity when applied to experimental data with different operating fluids and can be applied to flow conditions that are far from the transition boundary.
An approach to extend the applicability of the transition criterion to different fluids has been proposed by adding a dependency on the Morton number. An experimental campaign has been proposed to study the classification boundary for varying fluid properties, using water with additives at atmospheric pressure as the working fluid. We rely on adiabatic experiments to isolate the influence of interfacial forces and turbulence on the void fraction profile. Decoupling thermal aspects from flow dynamics is essential for improving the existing models and eliminate possible sources of error compensation. It also helps simplify the experimental conditions thus allowing us to explore a wide parametric range of interest. The new criterion proposed in this work along with the improved understanding from new experiments, will allow to develop more physically consistent closure models for subchannel codes.
REFERENCES
1. Tomiyama, A., Tamai, H., Zun, I., & Hosokawa, S. (2002). Transverse migration of single bubbles in simple shear flows. Chemical Engineering Science, 57(11), 1849-1858.
2. Hibiki, T., & Ishii, M. (1999). Experimental study on interfacial area transport in bubbly two-phase flows. International Journal of Heat and Mass Transfer, 42(16), 3019-3035.
3. Sugrue, R. M. (2017). A robust momentum closure approach for multiphase computational fluid
dynamics applications (Doctoral dissertation, Massachusetts Institute of Technology).
4. Lu, J., & Tryggvason, G. (2008). Effect of bubble deformability in turbulent bubbly upflow in a vertical channel. Physics of Fluids, 20(4), 040701.
5. Feng, J., & Bolotnov, I. A. (2017). Evaluation of bubble-induced turbulence using direct numerical simulation. International Journal of Multiphase Flow, 93, 92-107.
6. Hosokawa, S., Suzuki, T., & Tomiyama, A. (2010). Effects of bubbles on turbulence properties in a duct flow. Multiphase Science and Technology, 22(3).
7. Liu, T. J., & Bankoff, S. G. (1993). Structure of air-water bubbly flow in a vertical pipe—I. Liquid mean velocity and turbulence measurements. International Journal of Heat and Mass Transfer, 36(4), 1049-1060.
8. Wang, S. K., Lee, S. J., Jones Jr, O. C., & Lahey Jr, R. T. (1987). 3-D turbulence structure and phase distribution measurements in bubbly two-phase flows. International Journal of multiphase
flow, 13(3), 327-343.
9. Shawkat, M. E., Ching, C. Y., & Shoukri, M. (2008). Bubble and liquid turbulence characteristics of bubbly flow in a large diameter vertical pipe. International Journal of Multiphase Flow, 34(8), 767-785.
10. Mimouni, S., Guingo, M., Lavieville, J., & Mérigoux, N. (2017). Combined evaluation of bubble dynamics, polydispersion model and turbulence modeling for adiabatic two-phase flow. Nuclear
Engineering and Design, 321, 57-68.
11. H-M Prasser, Matthias Beyer, Helmar Carl, Annalisa Manera, Heiko Pietruske, Peter Schütz, and F-P Weiß. The multipurpose thermalhydraulic test facility topflow: an overview on experimental
capabilities, instrumentation and results. Kerntechnik, 71(4):163–173, 2006.