A Decision Making Framework for Cruise Ship Design
by George P. Katsoufis B.S. Architectural Engineering and B.S. Civil Engineering University of Miami (FL), 2000SUBMITTED TO THE DEPARTMENT OF MECHANICAL ENGINEERING IN FULFILLMENT OF THE REQUIREMENTS FOR THE DEGREE OF
PARTIAL
MASTER OF SCIENCE IN OCEAN SYSTEMS MANAGEMENT AND
MASTER OF SCIENCE IN NAVAL ARCHITECTURE AND MARINE ENGINEERING AT THE
MASSACHUSETTS INSTITUTE OF TECHNOLOGY JUNE 2006
C George P. Katsoufis. All rights reserved.
The author hereby grants to MIT permission to reproduce and to distribute publicly paper and electronic copies of this thesis document in whole or in part in any medium now known or
hereafter created.
Signature of A uthor: . ...
Department of Mechanical Engineering April 7, 2006 Certified by: .... Certified by: ... Accepted by: ... MASSACHUSETTS INSTI OF TECHNOLOGY
JUL 14 2006
... Dr. Clifford A. Whitcomb, Associate Professor of Systems EngineeringNaval Post Graduate School Monterey, California Thesis Supervisor
--- .... .... ..... ....... ...... .. ..... ......
Dr. Henry S. Marcus, Professor of Marine Systems Thesis Supervisor ...
Professor Lallit Anand
TUTEj Chairman, Committee for Graduate Students
1ARKER
I
A Decision Making Framework on Cruise Ship Design by
George P. Katsoufis
Submitted to the Department of Mechanical Engineering on April 7, 2006 in Partial Fulfillment of the Requirements for the Degree of Master of Science in
Ocean Systems Management and
Naval Architecture and Marine Engineering
ABSTRACT
This thesis develops a new decision making framework for initial cruise ship design. Through review of effectiveness analysis and multi-criteria decision making, a uniform philosophy is created to articulate a framework that would enable a designer to more accurately assess what design alternatives are more important than others and how their changes affect the overall system being designed. Through a brief historical account, top-level Measures of Merit are developed and used with the framework and then applied to a requirements and effectiveness case study on initial concept development of a cruise ship. This is performed using Response Surface Methods to enable the user to visualize the design space as well as interact with it; the results and methods to visualize the design space are discussed. Finally, a Unified Tradeoff Environment is discussed, a framework that pools the aforementioned requirements and effectiveness analysis with design and technology forecasting to enable the user to make better informed requirements derivation and design selection.
Thesis Supervisor: Dr. Clifford A. Whitcomb Title: Associate Professor of Systems Engineering Thesis Supervisor: Dr. Henry S. Marcus
ACKNOWLEDGEMENTS
This thesis would not have been possible were it not for the support and assistance of Dr. Cliff Whitcomb and Dr. Hank Marcus. Dr. Whitcomb graciously took me under his wing when no one else was willing, introduced me to this area of research, and through his academic advice over the last four years to the completion of my thesis. Dr. Hank Marcus introduced me to a world only MIT has to offer; one that I believe will resonate in my life for many years after I leave this institution. His efforts and guidance were instrumental in my graduate studies, the completion of this work, and the direction I have chosen in my life.
I owe special thanks to John Hootman, my friend and classmate, who was kind enough to allow me the use of his graduate work to lay down the foundation for my research for this thesis. Additional thanks also go out to my friends for their support, with special mention of Dr. Rick Rikoski (Jr.) who introduced me to his family when I had to return to Boston to complete my studies and had no where to stay. They were gracious enough to let me stay in their home, indefinitely, until this task was done.
Final Thanks go to my parents, whose love, understanding, and never-ending support saw me through this.
TABLE OF CONTENTS TABLE OF FIGURES ... 8 TABLE OFTABLES ... 9 TABLE OF EQUATIONS...9 N OM ENCLATURE...10 CHAPTER 1: INTRODUCTION ... 1 1 PURPOSE ... I SYSTEM S A PPROACH ... 12 O VERVIEW ... 14
CHAPTER 2: A BRIEF O VERVIEW OF THE CRUISE INDUSTRY ... 15
A H ISTORY ... 15
IF YOU BUILD IT, WILL THEY COME9 . . . 17
IT's A LL DOLLARS AND SENSE ... 20
BEING PULLED IN M ULTIPLE D IRECTIONS... 25
CHAPTER 3: CRUISE SHIP SYSTEMS APPROACH INVESTIGATION AND DEVELOPMENT ... 29
INTRODUCTION ... 29
SYSTEM S ENGINEERING FOR PRODUCT D EVELOPM ENT... 32
TECHNICAL M EASUREM ENT AND M EASURES OF M ERIT ... 34
MULTIPLE CRITERIA DECISION MAKING CONSIDERATIONS ... 44
W EIGHTED SUM M ETHOD ... 45
H IERARCHICAL W EIGHTED SUM ... 46
ANALYTIC HIERARCHY PROCESS ... 47
M ULTI-A TTRIBUTE U TILITY ANALYSIS...48
GENERAL M ETHOD CONSIDERATIONS... 48
PARETO O PTIM ALITY ... 51
TRADE-O FF M ETHODOLOGY ... 52
D ESIGN OF EXPERIM ENTS (D OE) ... 54
RESPONSE SURFACE M ETHOD ... 55
CHAPTER 4: CASE STUDY A PPLICATION TO CRUISE SHIP D ESIGN ... 59
CHAPTER 5: CONCLUSIONS ... 79
APPLICATIONS FOR IM PLEM ENTATION ... 79
U NIFIED TRADEOFF ENVIRONMENT ... 80
RATIONAL D ECISION M AKING AND G ROUPS ... 82
UNCERTAINTY CONSIDERATIONS ... 86
SUM M ARY OF APPLICATIONS ... 88
RECOMM ENDATIONS FOR FUTURE W ORK ... 88
W ORKS CITED ... 91
W ORKS CONSULTED...95
A PPENDICES...99
A PPENDIX 1: Synthesis M odel (Partial) ... 101
A PPENDIX 2: JM P Screening Experim ent Inputs ... 107
A PPENDIX 3: JM P Screening Experim ent R SM Report (Partial)...109
A PPENDIX 4: JM P Custom D esign Inputs ... 1 1 A PPENDIX 5: JM P Custom D esign R SM Report (Partial)... 1 13 A PPENDIX 6: JM P Central Com posite D esign Inputs ... 115
A PPENDIX 7: JM P Central D esign RSM Report (Partial) ... 117
TABLE OF FIGURES
Figure 1: Historical Demand & Supply in Lower Berths and Utilization as a Percentage ... 18
Figure 2: Projected Demand & Supply in Lower Berths (LB) and Utilization as a Percentage ... 18
Figure 3: Annual Passenger Growth in North American Cruise M arket ... 20
Figure 4: Various organizations involved in the management and/or owning of a cruise ship...25
Figure 5: Organizations involved in the ISPS code...26
Figure 6: Typical Design Spiral ... 30
Figure 7: Shipbuilding Cost by Ship Type ... 31
Figure 8: System Boundary Levels ... 36
Figure 9: M odel Development Process ... 37
Figure 10: Relation of M odels to M OM s...37
Figure 11: W hitcomb's Hierarchy Structure ... 47
Figure 12: M ustin's Dendritic ... 50
Figure 13: The Goal-Question-M etric Format ... 50
Figure 14: Example Pareto Plot...52
Figure 15: Three Variable Design M odels ... 56
Figure 16: Actual by Predicted Plot for Beam ... 67
Figure 17: Effects Tests Report on Beam Response ... 68
Figure 18: Pareto Plot of Beam Response ... 69
Figure 19: JM P Prediction Profiler for Top-Level M OM s ... 70
Figure 20: Prediction Profiler for Central Composite Design... 74
Figure 21: Contour Plot of Beam, Acquisition Cost, and Combined ... 75
Figure 22: Threshold and Goal Limits on Contour Plots ... 76
Figure 23: The Unified Tradeoff Environment ... 80
Figure 24: Systems of Systems Approach... 82
Figure 25: Prospect Theory Value Function ... 84
TABLE OF TABLES
Table 1: Typical Income Statement of a Cruise Line... 21
Table 2: Characteristics of MOMs... 39
Table 3: Analyzed Requirements ... 64
Table 4: Initial Set of V ariations... 65
Table 5: Initial Set of R esponses... 66
Table 6: Central Composite Design Factors ... 72
Table 7: Central Composite Responses... 73
TABLE OF EQUATIONS Equation 1: Green's Mission Success Formula... 43
Equation 2: Possible commercial alternative to Green's Mission Success Formula...43
Equation 3: Weighted Sum Method... 45
Equation 4 (Parts A, B, C): Hierarchical Weighted Sum Formulation... 46
Equation 5: Required Number of DOE Designs ... 55
NOMENCLATURE
A erospace System s Design Laboratory... A SDL
Analysis of A lternatives ... A oA Analytical H ierarchy Process ... A HP Cum ulative Prospect Theory ... CPT D esign of Experim ents ... D OE
D im ensional Param eters... DPs Figure of M erit ... FOM Freight Dem urrage & Defense ... FD & D Hierarchical W eighted Sum ... H W S Hull & M achinery ... H & M Insured V alue ... IV
International M aritim e Organization... IM O
International Safety M anagem ent Code ... ISM
M easures of Effectiveness... M OEs M easures of Force Effectiveness... M OFEs M easures of M erit ... M OM
M easures of Perform ance... M O Ps
M easures of System Effectiveness ... M O SEs M ission Tasks... M Ts M ulti-A ttribute Utility... M AU
M ulti-Criteria Decision M aking... M CDM Overall M easure of Effectiveness ... OM OE Protection & Indem nity... P& I
Rational Decision M aking ... RD M Response Surface M ethods ... RSM Safety O f Life At Sea... SOLA S Trade Disruption ... TDI Unified Tradeoff Environm ent... U TE
W ar Risk... W R W eighted Sum ... W S
CHAPTER 1: INTRODUCTION PURPOSE
Traditional cruise ship design can be characterized as a series of tradeoffs that are often made without thorough consideration as to their overall impact to the design as a system. With the exception of ship size or displacement, the most important parameters, such as initial or acquisition cost, profitability, operational cost, operational profile, and allocation of revenue generating space, are not included in the design decision making process. Listing these considerations are often not as difficult as measuring them. As Zink et al observes:
... [Measuring these factors] are dependent on the subjective opinion of the
customer/user, i.e. the requirements. These requirements are often ambiguous and
typically change over time. Therefore, understanding the simultaneous impact of
requirements, product design variables, and emerging technologies during the concept formulation and development stages is critically important and until now, elusive. [Zink
et al, 2000]
To design a modem ship, designers must be familiar with subjects normally beyond their basic discipline. They must be able to determine what, if any, external factors are critical to the design as well as understand their interactions within the super system and the design environment. They must then develop a framework to evaluate this system and come up with a viable design which meets all these requirements. This paper will, therefore, present the
following:
" To summarize the collection of literature on systems approaches to effectiveness analysis.
* To summarize the collection of literature on Multiple Criteria Decision Making (MCDM) models.
* To filter the theories presented into a framework based on a consistent philosophy
* To use this to address the existing limitations in requirements and effectiveness analyses of cruise ship design.
The investigation of the basis for a system-level design framework for cruise ships begins with a systems approach from the naval engineering field within naval architecture and marine engineering.
SYSTEMS APPROACH
It has only been during the last 30 years that naval engineers began looking beyond traditional aspects of naval architecture and marine engineering at how the sum a vessel's parts affected its overall design as a system. Prior to this, "ship level requirements, rather than the ship's contribution to the performance of the task force, drove the design process" [Rains, 1999]. The problem created with this tactic was that:
Organizations focused on the optimization of their products often lost sight of the overall system. Each organization perceived that their part must be optimal, using their own disciplinary criteria, and failed to recognize that all parts of a system do not have to be optimal for the system to perform optimally. [INCOSE, 2000]
To tackle this problem, systems engineering was applied to naval engineering to create, "a process which transforms an operational need into a description of system parameters and integrates those parameters to optimize the overall system effectiveness" [Tibbitts et al, 1993] Naval engineers have been tasked to rethink design of not just ship systems but a, "supersystem
... the system that is just big enough to include everything that must be taken into account in determining the optimal (most cost-effective) ship for the mission requirements" [Hockberger,
The metrics that are used to evaluate the supersystem are generally called measures of effectiveness and are "inherent in the mission and external to the ship." [Hockberger, 1996]
The ship's effectiveness has to do with the change in the [operational] situation that results from its involvement in [its operation], which is a matter of outcomes, and Measures of Effectiveness can thus be seen as outputs of an [action]... [thus] it is the synergism between the new ship or system and [its environment] that is at issue, and it is the [operational] effectiveness and ... Measures of Effectiveness that must be used as the basis for assessing and comparing the performance of each alternative. [Hockberger,
1996]
In cruise ship design it is a common practice to start with a set of vaguely defined owner's needs and desires and through the 'design spiral' synthesis process come up with a ship point design that more-or-less meets a set of requirements derived from the owner's needs and desires. This approach does not always necessarily produce the most cost-effective or revenue effective vessel. Individual systems might meet the set of requirements but no analysis has been made as to whether the ship as a whole is "optimized" to the owner's desires - as opposed to a set of feasible designs created as the naval architect interpreted them. "Further, it is often the case that the design requirements are not fixed but rather evolve through the development life of the vehicle." [Hollingsworth and Mavris, 2000] A shift in design philosophies would lead to:
an environment in which the effects of changes in the engineering parameters are analyzed to determine their impact on overall...effectiveness. This process is accomplished by linking a conceptual... design program with a [simulation] program. Thus the linkages between design variables and [operational performance] can be more thoroughly understood, and a vehicle with the greatest overall effectiveness can be
created. [Frits et al, 2002]
This simultaneous development of effectiveness models and engineering analysis based upon well-defined metrics would provide naval architects with a method to optimize a system, provide decision makers with appropriate information to develop appropriate requirements, and provide a traceable method between the two so that when requirements change, design impacts can be easily modeled and understood by both owner's and designers. [Hootman, 2003]
OVERVIEW
This thesis will start with a review of the cruise industry, and then survey the existing
literature which will serve as a background for the development of a framework for defining and developing systems metrics for use in effectiveness analysis. It will include a literature survey of multiple criteria decision making, taking into account mathematical and practical applications. The development of a methodology to perform requirements-based tradeoffs will then be
addressed. Next, a case study in cruise ship design will use what has been developed to
demonstrate how to develop appropriate systems measures, how to hierarchically aggregate them, how the process is applied, and, finally, the results will be presented, followed by a discussion of the conclusions and recommendations for future work.
CHAPTER 2:
A
BRIEF OVERVIEW OF THE CRUISE INDUSTRYHistory is a profound illustrator of how things come to be and a very useful tool to begin to understand a business. The passenger ship industry is no exception. In addition to a historical reference, a financial breakdown and a glimpse into past and current marketing philosophies will be discussed. Once these have been examined, the reader should have a better understanding of the consequent design challenges passenger ship designers and their prospective owners encounter when contemplating future new-builds and conversions; design challenges that can be resolved through a variety of newer as well as older technologies and design philosophies.
A HISTORY
The first vessels that carried passengers were designed to carry cargo. Regularly scheduled transatlantic passenger service was initiated in 1818 but ships exclusively catering to passengers did not appear until the 1840s. Early ocean going vessels were obviously not designed for passenger transport, but rather for the cargo they could carry. In 1818 the Black Ball Line in New York became the first shipping company to offer regular service for passengers from the United Stated to England onboard its freight ships, marking the beginning of the cruise industry in the sense that passenger comfort was addressed [Boyd, 1999]. It was not until the 1830's that steamships were introduced and quickly dominated the transatlantic market of passenger and mail transport; the most recognized being Samuel Cunard's British and North American Royal Mail Steam Packet Company which would later be renamed to Cunard Line. Ships did not exclusively cater to passengers until the 1850's and for the following century the foundation of the cruise industry was shaped through novel practices to lure new patrons as well as new procedures, born out of tragedy, to insure their safety while at sea [Boyd, 1999].
Cruising saw many changes in those 100 years. In addition to new steel processes, the introduction of the screw, and fabrication technologies evolving out of an American civil and two world wars, new global organizations were created to confront deficiencies in standards of construction and safety onboard ships. Born out of the now infamous tragedies of the Titanic and Lusitania disasters, organizations, such as the International Maritime Organization (IMO) and the International Convention for the Safety of Life at Sea (SOLAS) set the technical and procedural precedents that current shipping lines follow. Even pricing discrimination (in the form of classification of passenger fare) saw its inception and its eventual humane evolvement.
One constant in these past 150 years has been a transportation company's financial incentive to have those that could afford it, pay more for their fare. Passenger transport over land and sea was often brutal to those that could barely afford it. From the "steerage" class available in the 1880's where, "passengers were responsible for providing their own food and slept in whatever space was available in the hold," [Boyd, 1999] cruising's overall comfort gradually progressed due to the global enforcements of minimum safety standards onboard vessels. By the early 20th century, cruising was well on its way to becoming a staple for the affluent with ships that were increasingly being designed for comfort at sea rather than speed, resulting in larger, more stable liners. With the launch of Pan Am's trans-Atlantic flights in the late 1950's, however, came the decline of steamship transportation, paving the way for the modern-day cruise industry.
With the decrease in the role of ships for transporting people to a particular destination, companies began to create a new image for cruising; they began to emphasize the voyage itself. Instead of just going from one port to the other, multiple destinations were offered in a given period. Initially marketed for affluent customers, the idea of cruising as a mass-marketed
vacation was not popularized until the late '70s by the television series, "The Love Boat." [Boyd, 1999] This heralded the gradual improvement of the quality of the cruise product and marked the beginning of a steady increase in annual passengers limited only by ship capacity, the range of its destinations from home port, and the state of the global economy. In the last thirty years, cruise ships have evolved from 40,000 ton vessels to new-builds entering the market in excess of
160,000 Gross Registered Tons (GRT). In addition to size, cruise lines also increased their numbers by adding to their respective fleets, causing many to believe that the eventual supply will exceed demand. Cruise lines, however, saw things differently.
IF YOU BUILD IT, WILL THEY COME?
They saw the U.S. as part of a largely untapped market where only 5% of Americans had ever cruised in the early '80s and, compared to other leisure markets, the potential for growth was there. Skeptics and proponents turned out to be both correct. As capacity grew so did demand, but not always at the same rate. Cruise lines addressed the problem of overcapacity with aggressive pricing. This destructive pricing led to the eventual buy-outs, bankruptcies, and mergers of underfinanced companies that had entered the industry in the early '80s by purchasing older ships. This continued throughout the '90s until 1997 where due to a strong dollar, a robust economy, warm weather, lack of shipboard incidents, and in increased interest in cruising, the industry was catapulted into another growth spurt that has continued in-spite of September 11h , albeit not as vigorously. The industry is so robust that even while the rest of the world economy was reeling in the aftermath, cruise lines maintained their occupancy levels by applying the same methods they had used the last twenty years while continuing to place orders for newer and larger vessels for the next five years. The key thinking in all of this is in
understanding the marketing and money-making dynamics that differentiate the cruise industry from the rest of travel market.
Rax/datM ftiot 100 90 80 70 60 40 30 - 20-0 1992 1993 1994 1995 1996 1997 1998 1999 2000 2001
Figure 1: Historical Demand & Supply in Lower Berths and Utilization as a Percent [DVB, 2004] lower herth 400,000 -350,000 - 300,000-250,000 -200,000 - 150,000-100,000 -50.000 0 utilleation % 100% 80% 70% 60% 50% age utilisation % - 100% -90% -80% -70% 60% 50% 2002 2003 2004 2005 2006 2007
Figure 2: Projected Demand & Supply in Lower Berths (LB) and Utilization as a Percentage [DVB, 20041
Carnival's CFO, Jerry Cahill, explains certain key points of these differentiations that have spurred this increase in capacity: [Citigroup, 2003]
"Cruise companies collect all of the money for the cruise tickets at least 30 days before sailing. For Carnival, that is $700-$800 million in cash that the company is receiving (plus interest), rather than having to pay to borrow. Ships, unlike hotels, move, and thus this ... property can be sent to places to better match supply and demand. In addition, once the guest boards, the cruise ship holds that guest "captive" for the majority of the cruise. Thus, the cruise ship can capture every extra dollar spent at its bars, casinos, retail space, spas, and auctions. Hotels, on the other hand, cannot do nearly as much in this regard. This onboard spending is especially important in light of the growing contribution that onboard revenues make to the cruise ships, partially because price competition has kept cruise ticket prices down, but also because cruise companies have been focusing on this more, including more spas and retail space, and designing better layouts in order to entice passengers to stop into a store on the way back from dinner or the casino."
With the continual additions and the ability to reposition themselves to where their market has a need, cruise lines are becoming increasingly aggregated with respect to their target markets. From the days of segregating by class, price discrimination of the old days evolved to the Brand Positioning. Depending on which company you ask, brands can be broken down from three to five categories. The simplest breakdown contains four categories that starts with a Budget category (Day / Casino Cruises), continues to Contemporary (Carnival, Royal Caribbean, Norwegian, etc.), then to Premium (Celebrity, Holland America) and ends with a Luxury rating (Cunard, Crystal). A fifth rating, Ultra Luxury is only a recent entry and exceedingly small part of the overall market; approximately one percent of the leisure population, aged over 45 years and a gross income of $200,000. [DVB, 2004] All these brand ratings allow ships to be used to their fuller potential by providing destinations, amenities, cuisines, and services that match their target clientele so that onboard revenue can be maximized while providing incentive for those that can afford it to purchase the "superior" brand.
10000 8000 . * 6000 4000 2000 0 1970 1980 1990 2000 2002 2003 2004
Figure 3: Annual Passenger Growth in North American Cruise Market [CLIA, 2005b]
IT'S ALL DOLLARS AND SENSE
Prior to 9/11, the cruise industry was on its way to a record year. Between the terrorist attacks, the ensuing lackluster economy, and the bad publicity of the Norwalk virus that struck in the later half of 2002, demand has waned while supply has continued to increase. [BREA, 2004] Although this has reduced revenue per passenger per day, cruise lines have remained profitable because of size, benefits from the economies of scale of their fleets and from technical/operational benefits from current mergers. One recent example is the merger battle that Carnival and Royal Caribbean had over Princess Cruise Lines. They were not only fighting for Princess' fleet but also its global reservations system which is so sophisticated that it acts more like a revenue management program than a reservation system. Client's purchase histories are monitored from time of booking, saved and then compiled to better utilize their ship's revenue potential. This is only a small example of what companies are doing to counteract the negative effect of price competition. A brief analysis of a typical income statement is needed, however, to better explain a cruise line's potential for profitability.
Income statements vary from company to company but the following example will help explain some of the differences between net and gross revenues as well as some of the
generalized expenses associated with shipping. Table 1 breaks down a sample statement:
Table 1: Typical Income Statement of a Cruise Line [Citigroup, 2003]
Internal Income Statement External Income Statement
% Total Revenues Revenues 70% Ticket 20% Onboard 10% Airfare
100% Total Gross Revenues Total Gross Revenues
20-30% Less: Cost of Sales
7-11% Travel Agent Commissions
10% Airfares
NA Onboard (e.g. alcohol)
70-80% Equals: Net Revenues
30-35% Less: Operating Expenses Less: Cost of Sales & Op. Expenses
NA Payroll
NA Food
2-5% Fuel
NA Repairs & Maintenance
NA Insurance &
Classification
NA Other
12-15% Less: SG&A Expenses Less: SG&A Expenses
4-5% Advertising
NA Payroll & Related
NA Other
7-9% Less: Depreciation Less: Depreciation
19-21% Equals: Operating Income Equals: Operating Income
For a typical cruise line, 80% of costs are fixed while 20% are variable. A successful cruise line must find ways to reduce operational costs while increasing available revenue streams. In the example an internal and external income statement is shown, the difference being that the external income statement includes only information disclosed to the investing public
while the internal is used by management. Carnival Cruise Lines believes that best way to
This way, an entire ship's or fleet's profitability can be measured and compared to with the rest of the industry.
A quick glance at the sample statement shows three main sources of revenues: cruise tickets (70%), airfares (10%), and onboard spending (20%). Of the three revenue streams, cruise fares have been the most volatile since an empty berth is much worse than a heavily discounted one. The balance between discounting and obtaining the highest price for a cabin remains, to this date, a delicate undertaking and one that merits further discussion in this section. Thirty years ago a typical percentage for onboard revenue (compared to total income) was approximately 10%-15%. The current average has increased to roughly 20% as more amenities and opportunities to sell have been created with newer and bigger vessels. Airfares have also changed from what they once were. From a high of 60% of cruisers booking air through the cruise line 10 to 15 years ago, air bookings have declined to 15%-20% of bookings. [Citigroup, 2003] This reduction has been partially attributed to an increasing use of frequent flier miles, competition from budget airlines, and a current trend of passenger's reluctance to fly after the terrorist attacks. Today, air fare is generally a non-profit revenue source since most fares are sold at cost and are offered solely as a convenience to the consumer as a "one-stop" point of sale, leaving the cruise fares and onboard revenue as the only room to grow on.
Breakdowns of an expense report are closely guarded in this industry so there are not as many averages one can go by. As with all enterprises, costs can be split into operating and SG&A (Selling, General, & Administrative) expenses. For this thesis, operating costs will be addressed. Like many ships, operating costs are largely fixed, with the exception of food and
fuel being the two variables in the general equation.
The largest operating cost for cruise lines is labor. [Citigroup, 2003] A typical employee/guest ratio on a ship can vary from 1:2.5 on budget ships to as low a 1:1 on luxury ships [Levander, 2005]. Food is the second largest cost onboard a ship and is one reason why cruise lines put a heavy emphasis on ensuring their ships sail full year round. Cost is high for food because of many specialty dining options available onboard. As opposed to the single dining room arrangement that was available only a couple of decades ago, consumers can choose to dine al fresco, in specialty restaurants, or even order room service - all free of charge.
Next is Classification and Insurance. It is a general term that is used to talk about the many policies cruise lines need to have to safeguard themselves against this unusual market. Before being able to purchase any insurance policies, all shipping companies need to be classified. Classification enables insurance companies to know that the ship that they will insure meets a certain standard of safety. This standard is a fluid one that continually changes as events like 9/11 or the Exxon Valdez happen and as new procedures, such as the International Safety Management Code (ISM), are implemented globally so does the standard. Once a ship receives its classification, its owner can purchase many different policies, the most popular being Protection & Indemnity (P&I), Hull & Machinery (H&M), Trade Disruption (TDI), Freight Demurrage & Defense (FD&D), War Risk (WR), and Insured Value (IV). The P&I is a collection of ship owners, much like a co-op, that all pay a set amount per year. The P&I cover all damages related to a crew, passengers, and salvage expenses that are not covered under H&M. These primarily include loss of life, personal effects, medical expenses, repatriations, unemployment compensation, and the liabilities incurred from an accident (loss of contract, revenue, etc.). Additionally, any port and deviation costs incurred from an accident are also covered. The P&I reimburse up to a certain amount based on the club's contract with its
members and are dependent on what the claim covers (loss of life vs. repair to ship). Depending on the number of claims due to accidents, members either get a refund or a dividend at the end of their contract year. Understandably, if a member or group of members have a habitually poor record and continue to be members of a particular P&I, their fees increase dramatically. The P&I allows ship owners to mitigate expenses due to accidents by distributing the risk; allowing its members to stay active in the industry rather than going immediately bankrupt over a potentially costly accident. H&M covers exactly what its name says it does while TDI covers losses of expected profit from the interruption of a vessels business due to any casualty. FD&D covers costs and expenses from claims arising from accidents and contractual liability. Each year it becomes a little more difficult for older ships to meet the operational and maintenance requirements mandated by these insurance entities so it is an operational cost that gradually gets more expensive.
A final note on costs is on fuel. Fuel costs can vary from year to year but cost to a particular cruise line also vary. Companies have a choice of hedging fuel costs on the belief that it will be cheaper in the long run as well as flattening out its inherent volatility while others, mainly Carnival and its subsidiaries, choose not too. Their books state that their fuel expense ranges from 2%-4% of revenues even though in the first quarter of 2003 fuel hit the 6% mark.
BEING PULLED IN MULTIPLE DIRECTIONS
All these percentages between costs are what cruise lines today are continually attempting to manipulate to not only improve their profitability but to also acquire a bigger market share. They do this by improving their economies of scale by adding to their fleet and improving the cost per passenger to operate a typical vessel. In addition to their profit making endeavors cruise lines are also subject to safety and environmental standards placed by governments and various maritime governing bodies. Figure 4 illustrates only the higher level organizations that go into managing a ship.
Nation Stats
IMO ISM Code
Flag States 2010
ISPS Code
Classification Societies
U.S. Coast Guard
Insurance Underwriters Salvage Association Rating Agencies P&I Clubs Banks Port States
Sanitary & Health Inspection U.S. Certificate of financial responsibility U.S.
Figure 4: Various organizations involved in the management and/or owning of a cruise ship [DVB, 2004]
These safety measures and environmental restrictions encompass but are not limited to waste minimization, reuse, recycling, engine emissions, cataloguing all discharge from the vessel, and training requirements. Moreover, the industry is becoming subject to continually stricter enforcements of all these regulations, the newest being the International Ship & Port
Facility Security (ISPS) code. Following the events of 9/11, the ISPS code was developed to, "implement a ship security strategy commensurate with identified threats to security." [DVB, 2004] It brings together all security measures from every governing body to form a uniform response on all levels; whether at port, sea, dry-dock, or loading facility. Figure 5 illustrates just how many organizations are involved into creating this unified security plan. The ISPS code is still in its infancy and is bound to have a significant impact on the daily operations and costs of a cruise ship.
'MO
New cew Pil
fGovernment
W ' Flag Administ
oLI-
t
World Custom OrganizationLOI
Ship Cargo 'RSO'
CrewingOwners Canrs Recognized Security Organizations
Crewai & Ships Owners (Class Societies)
Companies
Securty Companies for Assessments and Training
Figure 5: Organizations involved in the ISPS code [DVB, 2004]
Like any travel and leisure group, bad publicity is avoided at all cost by ensuring as best as possible that material and environmental accidents occur at a minimum. For this and for preventative liability, most cruise lines incorporate procedures and guidelines that exceed the requirements mandated or even simply recommended by governing bodies. Between these
standards, the attempts of profitability by economies of scale, and physical requirements limited by waterways and ports of call, ship designers are constantly looking at the latest technology to provide prospective operators advantages over their competitors and older members of their fleet.
These design augmentations cover, but are not limited to, newer fabrication methods (to reduce cost or time of construction), propulsion alternatives (to improve speed, efficiency, maneuverability, redundancy, space limitations, etc.), and amenity alternatives (dining, shopping, exercise, individual balconies, etc.), and they don't come cheaply. On average a 2,000 berth ship can cost approximately $390 million while a 3000 berth ship goes for $500 to $650 million. [CLIA, 2005a] This correlates to an approximate 10% - 15% construction discount on a per
berth basis. In addition to the discount, the operating costs of a larger ship are reduced on a per berth basis due to economies of scale. The trade-off for this increased size is a decreased mobility and limited access to ports of call, making buying decisions for cruise lines a constant tradeoff analysis of ship placement (for market penetrations), route planning, target markets, and amenity allocations. To compound the issue even further, a typical timeline for a new build is three years from start of design to delivery while the typical lifespan of a vessel is 40 to 50 years; an issue that most financial analysts bring up when all they see is continual oversupply of ships in the North American market. [Citigroup, 2003]
Larger cruise lines deal with this issue by "repurposing" their older ships to less competitive markets or they outright sell the older vessels to smaller operators who would eventually sell them for scrap metal. A few recent developments have affected this business plan as well. SOLAS passed two regulations, "that by 2005 all cruise ships be fitted with a sprinkler system throughout the vessel and by 2010 ... that no part of the vessel be combustible." [DMV,
2004] Retrofitting older vessels to meet these requirements would not make any financial sense; the ship owner would not gain a newer, more marketable vessel but rather be throwing away money. Compounding the issue even further is the recent trend of scrapyards mandating the removal of asbestos and other hazardous material prior to the dismantling of the vessel, an issue that has not been mandated by the governing maritime bodies but that has been brought forth through environmentalist efforts.
Taking all these guidelines, regulations, and restrictions into consideration, a prospective ship owner is left with a quagmire of decisions that need to be made to create or maintain a successful cruise line. Marketing issues such as a ship's target demographics, areas of deployment, and brand quality all need to be addressed either through market research or awareness of the competition. Being abreast of all existing propulsion, powering, sewage treatment, water treatment, and safety technologies must also be in the purview of the owner. To add more to the mix, the owner must also bear in mind the true operational life of the vessel, taking into consideration of its marketable shelf life, the possibility of a cramped market place or poor economy, and any environmental and safety concerns that may appear in the future.
How to bring all these factors together and to make informed decisions on them is where the naval architect comes in. By developing a framework to tackle all these issues, the designer can provide the owner with a logical step-by-step breakdown of every decision in such a way that each effect can be quantified, thus affording the owner the resource of being able to quickly compare alternatives that would have not been readily available to him / her in the past. Once the process is explained in the ensuing chapter, the case study will demonstrate only the simplest of examples to show how such a myriad of factors can be broken down into quantifiable parts so that the owner can make an informed decision.
CHAPTER
3:
CRUISE SHIP SYSTEMS APPROACH INVESTIGATION AND DEVELOPMENTINTRODUCTION
A naval architect, as any designer of complex systems, today is faced by a multiplicity of
requirements, from owner's needs and desires, engineering feasibility, imperatives of technological advancement, environmental considerations, all the way to prescribed regulations. Maritime organization requirements dictate minimum levels of redundancy in propulsion, maneuvering, electrical, and mechanical systems while mandating appropriate fire retardant materials, fire suppression equipment, general life saving equipment, and standards for damage
prevention/deterrents for all classes of vessels. Additionally, markets change and the vessels that service them adapt to meet their needs. Throughout a lifecycle of a ship, its operational needs
will fluctuate to meet market demands. These needs may be anticipated, to an extent, but are
never able to be completely addressed in the earliest stages of design.
Introduced in 1959 by J.H. Evans ("Basic Design Concepts," ASNE Journal, November 1959), the design spiral is still used to characterize the ship design process. Since its inception there are many variations, but the concept remains the same, Figure 6 illustrates the cruise ship version of the typical design spiral process. Traditionally, total ship considerations such as life-cycle cost and revenue potential are often looked at in the third or fourth iteration of the design spiral process, the outcome of which is a single point design whose characteristics are not well
defined in relation to the needs of all the stakeholders involved. What is needed is a
comprehensive trade-off framework to consider a large and complex design efficiently so that determination of what parameters have greater impact on final design requirements than others can be accomplished in such a way as to focus the feasible design region, while simultaneously expanding the decision maker's horizons, as early on in the design process as possible.
-
Design Phase 5: Economics
Mission -Transport logistics -Route -Capacity -Speed Aker Finyads Na% ArdsledreAker nnyord
WO.
Performance -Hull Structure
-Machinery
Economics
-Outfitting'Building cost eakeeping 'Operating co t fety
'Required
freight rate FINAL
-Profitability DESIGN Function - Payload systems - Ship systems " DWT / A Fr -Geometric definition ' Space balance ' Weight balance
Crkeshp es g 53 Kai Lav~andw
Figure 6: Typical Design Spiral [Levander, 2005]
Systems thinking and engineering methods have been used to address these perspectives in various forms over the past 30-40 years. Successes at taking a systems approach resulted in some major program successes, such as the development of the nuclear submarine, Polaris missile, and AEGIS weapon systems. With respect to the incorporation of these successes to the application of systems approaches to ship design in general, in the early 1980's the U.S. Navy started to act on what was important, an understanding that when considering a "collective whole of how a vessel was assembled: optimized parts do not necessarily create an optimized whole." [Hootman, 2003] Understandably, a cruise ship is not a naval ship; their similarities lie in their complexities of design and customizability that most other ship types do not necessarily need
Shipbuilding Hierarchy
40 NAVY USD/kg 35 30 25 20 15 CRUISE SHIP 10 FERRY 5LNG RORO 0 0 W W) a.~ 0 ' 20 40 AkerFnnya t CONTAINER TANKERS 60 a Z80 (DL Z H U BARGE STEEL HULL 100 Volume 0 fyAker Finnyards Cruise Ship Design 56
Figure 7: Shipbuilding Cost by Ship Type [Levander, 2005
Although commercial ship design does not have the same missions as naval ships do, the same philosophies can be applied to address their design issues in a more comprehensive fashion. The main deterrent to transferring this to commercial ship design is in confronting the old adage of, "if it ain't broke, don't fix it." In many naval circles one would be hard pressed to find the need to re-analyze a ship's parameters from any perspective other than the original designer's interpretation of what was deemed best. However, systems engineering is useful, and that designers "could benefit from the use of analysis to understand what may end up driving the [design requirements] even within the vast uncertainties" of future markets and evolving
technology. [Builder, 1989] It is with this understanding that many solutions can be discarded
without having to analyze them first. Cruise ship designers have only recently began to address these issues; a case in point is in the development of the Queen Mary 2:
The genesis.. .was unconventional. Traditionally, when a naval architect is asked to design a newbuilding for an owner, he responds with three essential questions: How many passengers? How fast? How luxurious? But this was no conventional assignment; before providing capacity, speed, or lavishness, he needed informed guidance. Hard data would only emerge after some arduous new research. [The naval architect] was instructed to embark on an extensive study as to what form a viable and economically sound twenty-first-century ocean liner should take. ... formal research began in May 1998. [And would culminate in]... an exhaustive 2-year study. [Maxtone-Graham, 2004]
Although systems engineering can be generically defined (INCOSE Systems Engineering Handbook, INCOSE-TP-2003-016-02, Version 2a, 1 June 2004) most implementations are more domain specific. The development of cruise ships is better explained from a perspective of systems engineering with respect to product placement in the naval architecture domain. This thesis will primarily use literature based on Navy and Air Force methodologies and then will combine the most salient features with key aspects from the product placement and naval architecture domains to develop an approach for commercial cruise ship design application. The basic aspects of technical measurement, multiple criteria decision making, and experimental
design are the focus of the adaptation of the developed approach.
SYSTEMS ENGINEERING FOR PRODUCT DEVELOPMENT
Systems Engineering is based on, "iterative, top-down, hierarchical decomposition of
systems requirements, supported by ... studies that record the basis for significant decisions and
the options considered." [DRM, 2006] It begins by breaking down the system level requirements and continues with major subsystems, their respective subsystems, and so forth. At each level of decomposition, further "analysis, allocation, and synthesis" [DRM, 2006] is performed so that, with the assistance of other engineering disciplines, a baseline of system design is created. The end result being the allocation of systems requirements and their measure of effectiveness with respect to alternative designs; integrated within all the design disciplines and ensuring that the, "system developed meets all requirements defined in the system specification and for providing
the analysis which assures that all requirements will be met." [DRM, 2006] DRM Associates, a consulting firm for product development, breaks down systems engineering in the following manner [DRM, 2006]:
During system.. .requirements analysis, systems engineering analyzes and reviews the impact of operational characteristics, environmental factors, and minimum acceptable functional requirements, and develops measures suitable for ranking alternative designs in a consistent and objective manner. ...
During functional analysis, systems engineering uses the input of performance requirements developed during mission [or] operational analysis to progressively identify and analyze system functions and subfunctions in order to identify alternatives to meet system requirements. It is performed in conjunction with Allocation and Synthesis activities. Systems engineering considers all specified modes of operation and support. Systems engineering then establishes performance requirements for each function and sub-function identified. When time is critical to performance of a function, systems engineering also performs a timeline analysis.
During the allocation process, systems engineering allocates performance and design requirements to each system function and sub-function. These derived requirements are stated in sufficient detail to permit allocation to hardware, software, procedural data, or personnel. Systems engineering identifies any special personnel skills or peculiar design requirements. Allocation activities are performed in conjunction with Functional Analysis and Synthesis activities. Traceability of the allocated system requirements should be maintained.
During synthesis, systems engineering together with representatives of hardware, software, and other appropriate engineering specialties develops a system architecture design that is sufficient to specify the performance and design requirements which are allocated in the detailed design. Design of the system architecture occurs simultaneously with the allocation of requirements and analysis of system functions. The design is
documented with block and flow diagrams. ...
During final configuration item or subsystem requirements definition, systems engineering uses the specifications as a mechanism to transfer information from the systems requirements analysis, system architecture design, and system design tasks. Joint sign-off s of specifications by the specification author [the ship owner] and the detailed designer [the naval architect] pertaining to systems engineering and the design engineering disciplines assures understanding and buy-in. The specifications should assure that the requirements are testable and are stated at the appropriate specification level.
Specialty engineering functions participate in the systems engineering process in all phases. They are responsible for reliability, maintainability, testability, producibility, parts control, human factors, safety, and design-to-cost. Specialty engineering shall be involved in the issuing of design criteria, and the monitoring of the progress of the design and performance analysis to assure the design requirements are met.
During requirements verification, systems engineering and test engineering verify the completed system design to assure that all the requirements contained in the requirements specifications have been achieved. Tests conducted to verify requirements
The work of Crevely, Slutsky, and Antis in their book, Design for Six Sigma in Technology and Product Development, is a greater authority on the subject of product development. From a cruise line perspective, product development is what systems engineering is about. It is what occurs when a business starts with an idea usually conceived from an observed market opportunity, develops the idea, formulates a strategy to implement it, and delivers it to the marketplace. Analyzing the operational characteristics within the framework of an entire cruise fleet and breaking it down further to a ship's level analysis is what the naval architect attempts to do in order to enable the owner in making an informed decision as to what to build and, therefore, compete in the marketplace. The keystone of this process is in the development of appropriate metrics, using these developed criteria in such a way as to make the appropriate decisions, and applying them into a unified design space so that the owner can weigh all the possible alternatives before deciding on a solution that suits his / her needs.
TECHNICAL MEASUREMENT AND MEASURES OF MERIT
One of the foundations for implementing a systems engineering approach is to implement a structured method for technical measurement. Technical measurement "is the set of measurement activities used to provide the acquirer [and designer] insight into progress in the definition and development of the technical solution, ongoing assessment of the associated risks and issues, and the likelihood of meeting the critical objectives of the acquirer." [Technical Measurement, INCOSE, 2005]. The definition of a technical measurement approach for this thesis is based upon the US Department of Defense and defense industry implementations. To begin, the following definitions will serve as the baseline for this definition [Hootman, 2003]:
Effectiveness - "Effectiveness is the condition of achieving a requirement." [Hockberger, 1996]
System Effectiveness - The "ability of a system to accomplish a mission, and achieve a favorable [mission] outcome." [Brown, 1995]
Dimensional Parameters (DPs) - "the properties or characteristics of the physical entities whose values determine system behavior and the structure under consideration even when at rest." [Green and Johnson, 2002]
Measures of Performance (MOPs) - "are the measures that characterize physical or functional attributes relating to the system operation, measured or estimated under specified testing and/or operational environment conditions." [INCOSE, 2003] Measures of Effectiveness (MOEs) - "the 'operational' measures of success that are
closely related to the achievement of the mission or operational objective being evaluated, in the intended operational environment under a specified set of conditions; i.e. how well the solution achieves the intended purpose." [INCOSE, 2003]
Measures of Force Effectiveness (MOFEs) - are a "measure of how the system, and the force of which it is a part, performs its missions" [Green and Johnson, 2002]. MOFEs may also be referred to as Measures of System Effectiveness (MOSEs) or as an Overall Measure of Effectiveness (OMOE).
Measures of Merit (MOMs) - are a general term for all measures that characterize a system under analysis, they "subsume all measures that characterize a...system" [Green and Johnson, 2002]. In this study, MOMs will refer to MOPs, MOEs, and MOFEs.
As the definitions dictate, MOMs will refer to MOPs, MOEs, and MOFEs. In the process of developing MOMs it is important that the system being analyzed is first broken down in terms of internal and external attributes because "a change in the boundaries changes the parameter set and the resulting system behavior and performance." [Green, 2001a] To better illustrate this, think of MOMs in the sense of a set of subsystems, much in the way of concentric rings (Figure 8) illustrated below.
Figure 8: System Boundary Levels [Green and Johnson, 2002]
Green further clarifies that "MOEs and MOFEs are specified and measured external to the boundary" while DPs and MOPs are measured within the system (and its subsystems). Other authors similarly explain the same thinking but in a different terminology, where MOMs relate to "system performance as a function of its intended operational employment." [Leite and Mensh,
1999] This definition better explains commercial, non-mission oriented design applications, where parameters such as target acquisition effectiveness are not usually on a traditional ship
owner's design requirements. Once the parameters have been defined, the consensus for
developing a process model begins with four inputs: the mission, the expected threat, the environment, and potential system concepts. [Green, 200 1b]
Missions of the commercial sense can relate to travel time per leg or revenue generation
per leg and they should be defined in quantitative terms. [Rains, 1999] Furthermore, the
literature advocates that they should be developed in parallel with system requirements because, "they help formulate [them] and it helps make the design process more efficient." [Hockberger,
1996] Leite and Mensh go on to provide a step-by-step process for developing such a model
(Figure 9) where, once it is developed, the outcomes are used as inputs to metrics for representing the previously defined MOMs. (Figure 10) [Leite and Mensh, 1999]
Identify Requirements Establish Performance Criteria Identify System, Functions Define ' Model Measures Determine Test Points / , Data Extraction No Verify IMesrsProceed to Testability of TetaleModel Metal Y?
Figure 9: Model Development Process [Leite and Mensh, 1999]
Scenario Model Inputs Environment Inputs Dimensional Parameters Measures of Performance Measures of Effectiveness Measures of 0Force jEffectivenes~s Scenario Outputs Output Data
Green then continues by addressing what the literature calls the 'ilities'1 [Hootman, 2003] and their relationship with developing a MOM hierarchy. Each author develops their process structure depending on what their subsequent impact is on the ship design. For a naval combatant as an example, one author bases the hierarchy off of a 'Cycle of Mission Accomplishment' composed of Availability, Reliability, Survivability, and Capability and relates [Brown, 1995]. However, the literature advises that the expounded measures "must be independent at the level of analysis under evaluation" [Green, 2001 a]. The Air Force AoA adds that "MOEs should not be strongly correlated with one another (to avoid overemphasizing particular aspects of the alternatives)... [and that] MOEs must be independent of the nature of the alternatives, as all alternatives are evaluated using all MOEs." [OAS, 2000]
Green's solution to this approach is a balance "between those elements, both combat systems and ship systems, that are required for mission success [and that the] process model focuses on the mission goals rather than starting with a set of constraints that accept degradation in the performance of these goals as a process that must be paid." [Green, 2001b] Marud et al also provides a resolution through a four step process [Malerud et al, 2000], [Hootman, 2003]:
1. Define high-level properties through a qualitative, top-down approach.
2. Outline MOPs by first identifying DPs that characterize identified high-level properties.
3. Develop MOEs as metrics to judge system performance against user requirements.
4. MOFEs present a more unique challenge as they are often "more qualitative... [requiring] military and analyst judgment."
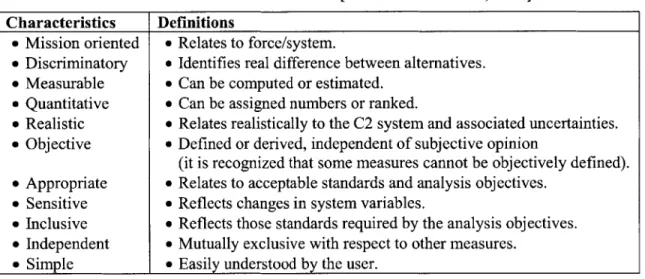
A good summary of characteristics of MOMs so far can be seen below on table X. Further into MOM development, the literature continues by stating that, "expressing MOPs, MOEs, and MOSEs as a probability allows us to determine if a parametric change is statistically
The 'ilities' include system performance characteristics such as affordability, performability, standardability, producibility, riskability, reliability, and maintainability. [Keane, et al, 1996], [Shupp, 2003], [Hootman, 2003]
significant" [Green, 2001 a] and that MOMs should be "efficient in the statistical sense (small variance/reasonable accuracy)" [Green and Johnson, 2002]. Green concludes that "if it can't be expressed as a probability it probably is not an effectiveness measure." [Green, 2001a] Further arguments can be read in Mason's citing of the work of Girard and Elele whose "definitions of MOEs are much more mathematically rigorous because they are expressed in probabilistic terms." [Hootman, 2003]
In Girard's terms, an MOE is the probability of the successful accomplishment of a function, where all probabilities are conditional, and are derived from MOPS and lower level (or prior) MOEs, and where a function is a process relating in an outcome. Thus 'an MOE defined by an objective function at an upper level is a dependent variable, and is a mathematical function of the MOEs defined by objective functions at a lower level.' Ultimately, an 'audit trail' equation is generated, linking the conditional upper level MOE to measurable MOPs. Elele uses Baye's Rule to develop a similar probability based MOE definition. [Mason, 1995]
Table 2: Characteristics of MOMs [Green and Johnson, 20021
Characteristics
I
Definitions Mission oriented Discriminatory Measurable Quantitative Realistic Objective Appropriate Sensitive Inclusive Independent SimpleThe final segment
Relates to force/system.
Identifies real difference between alternatives. Can be computed or estimated.
Can be assigned numbers or ranked.
Relates realistically to the C2 system and associated uncertainties. Defined or derived, independent of subjective opinion
(it is recognized that some measures cannot be objectively defined). Relates to acceptable standards and analysis objectives.
Reflects changes in system variables.
Reflects those standards required by the analysis objectives. Mutually exclusive with respect to other measures.
Easily understood by the user.
of MOM development is the issue of addressing cost. Although cost effectiveness is central to making tradeoffs and an integral part in the design process, the majority of literature recommends that cost should be excluded. A reasonable explanation can be found in the Air Force AoA guidebook which states that "because MTs are tasks, cost is never a MT or an MOE, and cost is never considered in the effectiveness analysis" [OAS, 2000] Furthering its belief for the need for MOM transparency it goes on to state:

![Figure 3: Annual Passenger Growth in North American Cruise Market [CLIA, 2005b]](https://thumb-eu.123doks.com/thumbv2/123doknet/14670112.556599/20.918.130.826.121.319/figure-annual-passenger-growth-north-american-cruise-market.webp)
![Table 1: Typical Income Statement of a Cruise Line [Citigroup, 2003]](https://thumb-eu.123doks.com/thumbv2/123doknet/14670112.556599/21.918.158.734.85.874/table-typical-income-statement-cruise-line-citigroup.webp)
![Figure 4: Various organizations involved in the management and/or owning of a cruise ship [DVB, 2004]](https://thumb-eu.123doks.com/thumbv2/123doknet/14670112.556599/25.918.107.801.457.866/figure-various-organizations-involved-management-owning-cruise-ship.webp)
![Figure 6: Typical Design Spiral [Levander, 2005]](https://thumb-eu.123doks.com/thumbv2/123doknet/14670112.556599/30.918.170.772.147.580/figure-typical-design-spiral-levander.webp)

![Figure 8: System Boundary Levels [Green and Johnson, 2002]](https://thumb-eu.123doks.com/thumbv2/123doknet/14670112.556599/36.918.310.628.123.438/figure-boundary-levels-green-johnson.webp)
![Figure 10: Relation of Models to MOMs [Leite and Mensh, 1999]](https://thumb-eu.123doks.com/thumbv2/123doknet/14670112.556599/37.918.230.686.681.1049/figure-relation-models-moms-leite-mensh.webp)
![Figure 11: Whitcomb's Hierarchy Structure [Whitcomb, 1998a]](https://thumb-eu.123doks.com/thumbv2/123doknet/14670112.556599/47.918.108.805.111.506/figure-whitcomb-s-hierarchy-structure-whitcomb-a.webp)
