HAL Id: hal-01225818
https://hal.archives-ouvertes.fr/hal-01225818
Submitted on 15 Nov 2015
HAL is a multi-disciplinary open access
archive for the deposit and dissemination of
sci-entific research documents, whether they are
pub-lished or not. The documents may come from
teaching and research institutions in France or
abroad, or from public or private research centers.
L’archive ouverte pluridisciplinaire HAL, est
destinée au dépôt et à la diffusion de documents
scientifiques de niveau recherche, publiés ou non,
émanant des établissements d’enseignement et de
recherche français ou étrangers, des laboratoires
publics ou privés.
Copyright
The Delaunay document layout descriptor
Sébastien Eskenazi, Petra Gomez-Krämer, Jean-Marc Ogier
To cite this version:
Sébastien Eskenazi, Petra Gomez-Krämer, Jean-Marc Ogier. The Delaunay document layout
de-scriptor.
2015 ACM Symposium on Document Engineering, Sep 2015, Lausanne, Switzerland.
�10.1145/2682571.2797059�. �hal-01225818�
The Delaunay document layout descriptor
Sébastien Eskenazi - Petra Gomez-Krämer - Jean-Marc Ogier
Laboratoire L3i Avenue Michel Crépeau 17042 La Rochelle Cedex 1 - France
{sebastien.eskenazi; petra.gomez; jean-marc.ogier}@univ-lr.fr
ABSTRACT
Security applications related to document authentication re-quire an exact match between an authentic copy and the original of a document. This implies that the documents analysis algorithms that are used to compare two documents (original and copy) should provide the same output. This kind of algorithm includes the computation of layout de-scriptors, as the layout of a document is a part of its seman-tic content. To this end, this paper presents a new layout descriptor that significantly improves the state of the art. The basic of this descriptor is the use of a Delaunay tri-angulation of the centroids of the document regions. This triangulation is seen as a graph and the adjacency matrix of the graph forms the descriptor. While most layout descrip-tors have a stability of 0% with regard to an exact match, our descriptor has a stability of 74% which can be brought up to 100% with the use of an appropriate matching algo-rithm. It also achieves 100% accuracy and retrieval in a document retrieval scheme on a database of 960 document images. Furthermore, this descriptor is extremely efficient as it performs a search in constant time with respect to the size of the document database and it reduces the size of the index of the database by a factor 400.
Keywords
layout, descriptor, Delaunay, stability, hashing, retrieval, classification
1.
INTRODUCTION
Many documents need to be secured, ideally by the means of an electronic signature. If two documents have the same signature, then they are authentic copies of each other and if their signatures are different, one of the two documents is fraudulent or at least different from the other one. This con-cept works well for naturally born digital documents. How-ever, nowadays a document, the so-called hybrid document, is often used in electronic or paper form according to the need. Hence, the hybrid document undergoes a lifecycle of
Permission to make digital or hard copies of all or part of this work for personal or classroom use is granted without fee provided that copies are not made or distributed for profit or commercial advantage and that copies bear this notice and the full citation on the first page. To copy otherwise, to republish, to post on servers or to redistribute to lists, requires prior specific permission and/or a fee.
DocEng ’15, Lausanne, Suisse
Copyright 20XX ACM X-XXXXX-XX-X/XX/XX ...$15.00.
printing and scanning and thus different degraded versions of the document exist as the printing and scanning process in-troduces specific degradations in the document such as print and scan noise [13]. Thus, the concept of electronic signa-ture can not be applied. For this reason, our work intends to develop an advanced electronic signature for the field of se-curing hybrid documents, the so-called hybrid security. Our idea is to extract the layout, the text and the images from the document to compute a stable signature that will be the same for all the authentic copies of the document.
To our knowledge, the closest work is a signature [18] based on pixelwise signal analysis techniques which is not satisfactory because of its large size. Other signatures such as the 2D-Doc [3] require the emitter of the document to precise the information used for signature computation, e.g. the name and the address of the beneficiary in the context of an invoice, and thus secures only partially the document (the provided information, but for instance not the layout). Thus, an ideal signature computation process is to auto-matically extract the content of the document (text, layout, graphics) and use it in the signature computation. A smaller signature than [18] will result as the amount of information to be secured is smaller since the image is not processed pix-elwise. Anyhow, this signature will still allow to secure the whole information of the document. In consequence, this requires document analysis techniques with an extreme sta-bility especially with regards to print and scan noise. The first step in a document analysis process is often the seg-mentation of the document. Hence we need to evaluate the stability of a segmentation algorithm.
Before going any further it is important to understand the difference between accuracy and stability. Accuracy re-quires a groundtruth to evaluate how close a result is to this ground truth. Accuracy can be evaluated with only one re-sult as long as there is also a ground truth. Stability does not require a ground truth. Stability requires at least two results with similar inputs to see how close these results are together compared to how close the inputs were. In our case, similar inputs are photocopies of the same document. A consequence of this is that an algorithm can be very sta-ble and yet not be accurate, For instance an algorithm that always makes the same mistakes, or namely in the case of a layout descriptor always describes only one region, would have an absolute stability and zero accuracy. The contrary is not true. An algorithm with an absolute accuracy will al-ways produce results that are identical to the ground truth and hence identical between each other. A perfect layout descriptor will also be perfectly stable.
Hence we do not need a ground truth to evaluate the sta-bility of a segmentation algorithm but we still need a proper metric or criteria to know when to outputs are similar or not. This also raises the question of defining what are simi-lar outputs of a segmentation algorithm. Our point of view is that two segmentation results are similar if they contain the same layout. This layout is also part of the semantic content of the document that will need to be secured.
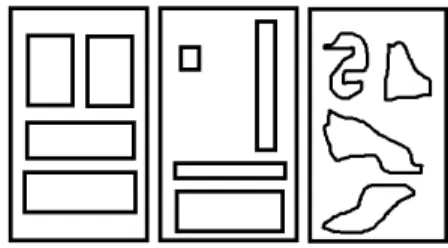
Since we make a difference between the segmentation and the layout of a document, it is necessary to define it clearly. According to [7], the physical layout of a document refers to the physical location and boundaries of various regions in the document image. The physical layout extraction typ-ically relies on a page segmentation algorithm. The page segmentation computes the boundaries of the various regions in the document image. Then, based on these boundaries, the layout extraction determines the spatial relationships between these regions. We simplify the above definition by only keeping the physical locations of the regions for the lay-out. We consider that the position of the region boundaries is the page segmentation. The region boundaries of page segmentation vary in case of noise and are thus very unsta-ble. Hence, we consider that the three segmentation results shown in Figure 1 have different segmentation results but identical layouts. This is of course a point of view which is not unique but it allows us to achieve the required level of stability.
Figure 1: Three layouts that we consider to be identical
Now we need a layout descriptor that is at least as stable as the best segmentation algorithms. We can never measure anything more stable than the descriptor, hence our quest for stability. The Delaunay Layout Descriptor is made to identify layouts with the highest level of stability. While its original use is the evaluation of segmentation algorithms, its performances allow many other uses.
It has been designed for document authentication. As-suming we have a copy of a layout and the descriptor of the original layout, the authentication process is as follows. First we compute the layout descriptor on the copy. Then we match it with the descriptor of the original layout.
It can also be used for document retrieval based on the document layout with unprecedented results. For a doc-ument retrieval scheme, we would have one layout and a database of hashes of layout descriptors. We would retrieve the layout by matching its descriptor with the database.
More generally, this descriptor can be efficiently used to describe the relative spatial relationship between a set of points as long as these points are not too numerous (below 30-40) and not too many of them are aligned.
We will now consider the state of the art under this new perspective in section 2. Then we will present the compu-tation and the matching algorithm for the Delaunay Layout
Descriptor (DLD) in sections 3 and 4. Section 5 presents the metrics and the dataset used for the evaluation of the descriptor. Finally, the last three sections 6, 7 and 8 de-tail our results, discuss the pertinence of our descriptor and conclude.
2.
STATE OF THE ART
As far as we know, only a few work has been presented on layout descriptors. For instance, the Description and MOd-ification of Segmentation DMOS with the EPF grammati-cal language [9] can be used to provide an original layout description. It extracts content from a document by iden-tifying its layout. The DMOS paradigm requires the user to a priori define the layout with EPF and is not based on the content of the document image to be processed. Hence the layout description is not adaptive to the layout of the document at hand.
´
Alvaro and Zanibbi [1] propose a layout descriptor for handwritten math expressions. They use a polar histogram and a support vector machine to classify the spatial rela-tionship between two elements. There are five classes: hor-izontal, superscript, subscript, below, and inside (e.g. in a square root).
The other layout descriptors are made for document clas-sification and retrieval. The MPEG-7 standard [14] includes a color layout descriptor. It divides an image into an 8 by 8 grid, takes the mean color value of the grid, converts it into the YCbCr color space and runs a discrete cosine tranform on it. Esposito et al. [11] use a set of 7 quantized position and size attributes (e.g. width, height, on top of) whose val-ues can make 171072 combinations. Cesarini et al. [6] modify the X-Y cut algorithm and use the cut sequence to encode the layout. This descriptor is tied to the segmentation al-gorithm and hence not very useful in a general case. There are also many graph-based layout descriptors [4, 12, 17] us-ing features such as distance, size, position, angles and other metrics.
While the above presented descriptors do not consider ro-bustness to noise, rotation and scale, Gordo and Valveny [12] present one which is meant to be invariant to scale and ro-tation. Unfortunately, by ’invariant’ the authors mean rea-sonably invariant. For instance, if we consider two copies of the same document, a small difference is accepted as long as the descriptors of the copies can be matched. This ’weak’ invariance is not enough for security application which re-quire an exact invariance, e.g. the values of the descriptor should remain the same.
There is one last descriptor that is not made for lay-out analysis but which presents some interesting features: LLAH [19]. Nakai et al. designed it to retrieve text docu-ments in a database with an image captured by a camera. It describes the local layout around each word in the document. It uses a set of affine invariants computed at the center of each word in the document. The descriptors reflect the spa-tial relationships between a word and its neighbors making a word neighborhood descriptor. Each word neighborhood descriptor is stored in a database with a hashing technique. This technique allows constant time retrieval which in prac-tice leads to real time retrieval. The matching is made with a voting algorithm counting how many word neighborhoods of the document can be matched in the database. It cannot be used for layout description because it requires more cen-troids than the number of regions that we would find in a
common document. Also it only retrieves one document per query and cannot cluster identical documents.
The main drawback of state-of-the art layout descriptors is the number of thresholds and parameters to adjust. The more thresholds and parameters are used in the computa-tion, the more unstable the descriptor will be. Thus, the ideal stable descriptor neither uses thresholds nor parame-ters.
3.
THE DELAUNAY LAYOUT DESCRIPTOR
Considering our last comment, one should ban the use of ”continuous” values such as distances or areas. If a length can vary between 1 and 100; then it has 99 thresholds. An in-teresting descriptor without any threshold would be a graph joining the centroids of the regions of the layout. One way to compute such a graph is to use the Delaunay triangulation of the centroids. There are three properties of a Delaunay triangulation that influence its practical use and stability.Property 1. Given a set of points, there always exists a
Delaunay triangulation except when all the points are aligned.
This property is of the highest interest as it proves that we will always be able to compute a Delaunay triangulation. Yet, it also highlights one case of instability: aligned points. While this will never occur for the whole page, it can occur locally and create local instabilities.
Property 2. The Delaunay triangulation tries to
maxi-mize the minimum value of the angles inside each triangle.
This leads to only few near flat triangles whose degenerated form could lead to an instability.
Property 3. When a subset of four or more points can
be placed on the same circle, the Delaunay triangulation of the points is not unique.
This means that in this case, the Delaunay triangulation is not stable.
This is why, our descriptor is based on the Delaunay tri-angulation of the centroids of the regions of the layout. This triangulation is represented as a graph whose root node is the top left centroid. From there we use a breadth first traversing algorithm to order the graph and to compute its adjacency matrix. The adjacency matrix is the descriptor which we call the Delaunay Layout Descriptor (DLD). It has no parameter and virtually no threshold.
The computation of the Delaunay Layout Descriptor is based on a preliminary step: we extract the centroids of the regions of the layout. Two steps follow: the triangulation of these centroids and the computation of the adjacency matrix of the triangulation which is seen as a graph.
3.1
Delaunay triangulation of the centroids
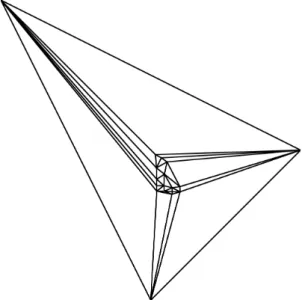
The algorithm adds three points outside of the document image in order to compute the triangulation. One is far in the top left direction and will be the root of the graph. These points are the furthest points from the center of Figure 2.The pseudo code algorithm of the triangulation is: D e l a u n a y ( v e r t i c e s set V )
v e r t e x li st Tv t r i a n g l e lis t Tt
c r e a t e 3 o u t e r v e r t i c e s v1 , v2 , v3
Figure 2: Example of a delaunay triangulation produced by opencv. The vertices in the center are the centroids of the regions of the layout.
Tv . add ( v1 ) Tv . add ( v2 ) Tv . add ( v3 ) Tt . add ([ v1 , v2 , v3 ]) for all v e r t i c e s a in V Tv . add ( a ) t r i a n g l e lis t R e m o v e d T r i for all t r i a n g l e s t in Tt if a is i n s i d e the c i r c u m c i r c l e of t Tt . r e m o v e ( t ) R e m o v e d T r i . add ( t ) end if end for u p d a t e ( Tv , Tt , R e m o v e d T r i ) d e l e t e R e m o v e d T r i end for
The update method updates the removed triangles to in-clude the new vertex a (the last vertex in Tv). This is done by adding the vertex a to these triangles. This makes quad-rangles that are split along one diagonal to make new tri-angles that will be added to Tt. The condition to choose along which diagonal to split the quadrangle is detailed in the next section.
3.2
Graph transformation of the Delaunay
tri-angulation
The Delaunay triangulation can easily be seen as a graph but this graph needs to be ordered in a stable manner. To this intend we use a variant of the breadth-first search (BFS) algorithm starting from the top left corner. Our algorithm is described below in pseudo-code.
D e l 2 G r a p h ( g r a p h G , s t a r t v e r t e x v ) v e r t e x lis t Vl Vl . pu sh ( v ) mark v as d one for i =0; i < G . n b V e r t i c e s -1 v e r t e x l ist C h i l d r e n
for all v e r t i c e s a in G . a d j a c e n t V t x ( Vl ( i )) if a is not don e C h i l d r e n . pus h ( a ) ma rk a as do ne end if end for o r d e r ( C h i l d r e n ) for all v e r t i c e s a in C h i l d r e n Vl . pu sh ( a ) end for d e l e t e C h i l d r e n end for r e t u r n Vl
The top left corner is a good starting point because the algorithm always generates it. Our algorithm differs from the BFS in the ordering of the children of a given node. Let us consider the situation of Figure 3 where A is a parent node and B and C are its children. x is the horizontal axis. B and C are ordered by increasing value of the angles \−→Ax,−→AC
and−→Ax,\−→AC in [−π; π]. Here, both angles are negative and
C comes before B.
Figure 3: One node with two children
Once the graph is ordered we compute its adjacency ma-trix to obtain the DLD. The DLD can be hashed with any hashing algorithm such as MD5 [20] or SHA-256 [5] in order to reduce its size to 128 or 256 bits respectively. MD5 is more compact than SHA-256 but cannot be used for secure applications. It should only be used in a document classifi-cation and retrieval scheme.
4.
DLD MATCHING
We have created a descriptor with no threshold or param-eter. However this is not sufficient for an absolute stabil-ity. We have seen that there are three cases of instability: aligned points, flat triangles and cocyclic points. Flat tri-angles and aligned points cover the same geometric situa-tion. There is also a fourth one related to the ordering of the graph. Thus, we propose an appropriate matching algo-rithm absorbing these possible sources of unstability of the descriptor. It creates the possible variations of the descrip-tor and finds the exact matches with the descripdescrip-tor(s) that we want to match. The way the matching algorithm handles the flipping of edges inside a quadrangle, the instability due to near aligned points and the instability due to the implicit threshold at−π/π in the ordering of the graph is explained in the following.
4.1
Edge flipping
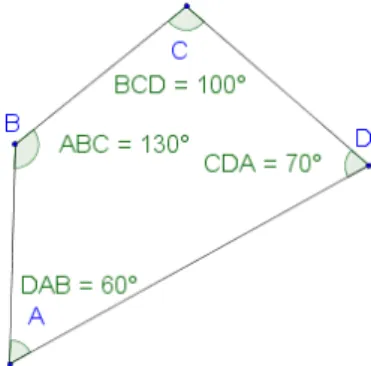
The Property 2 can be achieved by appropriately choosing the diagonal to split the quadrangles in the update function of the triangulation algorithm. If we consider the quadran-gle ABCD of Figure 4, it can be split along [AC] or along [BD] to make two triangles. To choose which edge must be created, the algorithm computes the sum of the opposing an-gles: \ABC + \CDA and \BCD + \DAB. One of them is bigger
than 180◦(this is a trivial mathematical property since their sum is equal to 360◦). To statisfy P2, the quadrangle must be split along the segment that joins the opposing angles whose sum is the biggest. Here it is \ABC + \CDA = 200◦
and the quadrangle will be split along [BD].
Figure 4: Example of a quadrangle that needs to be trian-gulated
One immediate source of instability comes when the sums are both equal to 180◦. This means that all four vertices are on the same (circum) circle and there are two possible triangulations of the quadrangle. This explains Property 3. The situation worsens in the digital world due to the dis-cretization of of the coordinates in the integer pixel values. This introduces an error on the angle measurements which needs to be taken into account. There exists an instability area when a couple of opposing angles forming a quadrangle have a sum within [180◦− ϵ; 180◦+ ϵ]. If this is the case, we will flip [AD] to [BC] and try to match both possibilities of splitting the quadrangle.
The parameter ϵ remains to be found and can be defined by the user. The value of ϵ will be discussed in the next section.
4.2
Aligned points
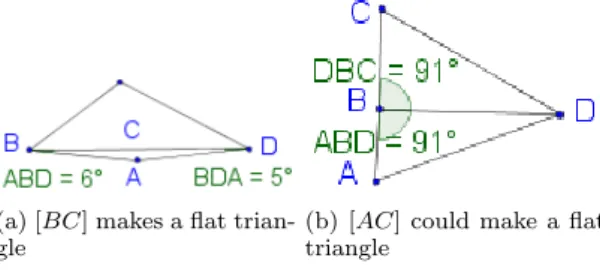
As stated in Property 1, for any number of aligned points there exists no triangulation. If a subset of our centroids is aligned, this will create a zone of instability as this subset will be difficult to triangulate. Furthermore, we just stated that there is an error margin on angle measurements. This increases the zone of instability due to aligned points. Let us consider the two situations of Figure 5, and the point of view of the edge [BD].
Situation 5a occurs when \ABD + \ADB < ϵ. In this case,
the edge makes a flat triangle with A. This should be trian-gulated the other way (with [AC] splitting the quadrangle). The situation 5b is a proper triangulation. However, it could very well have been triangulated the other way around with [AC] splitting the quadrangle. This situation occurs when
π + ϵ > \ABD + \DBC > π− ϵ.
We perform similar tests on both sides of the edge and with both vertices of the edge. This defines the zone of
(a) [BC] makes a flat trian-gle
(b) [AC] could make a flat triangle
Figure 5: Two situations with nearly aligned points
instability related to the alignment of points. If this situa-tion occurs for an edge, we flip the edge/diagonal inside the quadrangle and try to match both splitting configurations.
To prevent this situation from occuring too often, one should try to segment text columns rather than text para-graphs or text lines. Text lines and parapara-graphs are usually aligned in the same column.
4.3
Ordering implicit threshold
The algorithm to transform the Delaunay triangulation into a graph contains a step when the children of a node are ordered. This step contains an implicit threshold. With the notations of Figure 3, let us consider that \−→Ax,−→AC <−π +δ.
If we make an angle measurment error of ϵ > δ then we can have−→Ax,\−→AC <−π. This angle will be congrued back
inside [−π; π] to become \−→Ax,−→AC + 2π < π. This changes
the ordering of C from being the first to being the last child. To deal with this, we define an instability zone equal to [−π; −π+ϵ]∪[π−ϵ; π]. If one or more children are within this zone of instability, we change the ordering of the children of the current node by performing a circular permutation. We then try to match all the possible orderings of the graph.
4.4
Matching
Now that we have identified all the sources of instability, we can test all their combinations to match the layout L.
When combining several instabilities we recompute them. By instance, we apply one instability. Then we recompute the instabilities and only after that do we apply a second instability. This is motivated by the fact that applying one instability in a quadrangle can create new instabitilities for the edges of the quadrangle.
The number of instabilities due to the Delaunay triangula-tion can be rather big (up to 28 in our experiments). As the combinatorial of their combinations will grow exponentially, we limit the number of simultaneous instabilities to a value
n. By instance, if n = 2, we will only consider the cases
when a maximum of two instabilities occur in the layout. The ordering instabilities are quite rare as we start from the top left corner and they occur for the children on the left of the current node. Hence we will test all the ordering instabilities. The matching procedure becomes:
M a t c h ( l a y o u t L , d a t a b a s e S , a n g l e ϵ, n b I n s t a b i l i t i e s n ) li st of i n d e x e s M a t c h e s M a t c h e s . add ( fi nd L in S ) for all d e l a u n a y I n s t a b i l i t i e s (ϵ, n ) m o d i f y L for all o r d e r i n g I n s t a b i l i t i e s (ϵ) m o d i f y L M a t c h e s . add ( fin d L in S ) end for end for r e t u r n M a t c h e s
As the instabilities can be different from one layout to an-other, the matching algorithm is not symmetric e.g. match-ing a layout L1 with a layout L2may not produce the same
results as matching L2with L1.
5.
EVALUATION
This section presents the metrics and the dataset we used for the evaluation of the Delaunay Layout Descirptor.
5.1
Metrics
We chose to evaluate the Delaunay Layout Descriptor with three criteria. The stability is the prime criteria for security applications. It is usually quantified with the probability of false positives. We studied a second scenario based on document classification and retrieval. This scenario contains two metrics: precision and recall. Finally, we also took into account the computational complexity of the descriptor.
5.1.1
Probability of false positives
The probability of false positives (PFP) is the probability that two identical layouts cannot be matched together. They will be considered different and potentially fraudulent. If this probability is too high, too many documents will have to be manually verified and the system will be too expensive and useless. The PFP of the layout descriptor will also be a lower boundary for the PFP of the segmentation algorithms that we could want to evaluate. The PFP should be as low as possible. It is equal to 1− stability.
We consider a set of k copies of the same layout. We want to match one against all. This produces k−1 matches. We consider that a copy of a layout will not occur twice -scanning a document twice never produces the exact same image. Hence we should not match a layout copy with itself and we substract one match.
Assuming t matches fail, the probability of false positives is equal to:
P F P = t
k− 1 (1)
We then take the average of the PFPs for all the copies of all the layouts.
5.1.2
Classification and retrieval scheme
In this scenario we compute the descriptors for a database of layout copies to obtain a set of m descriptors S. Some layout copies can of course have the same descriptor. Then we match each layout copy with this set of descriptors.
For a given query (layout copy), we are supposed to re-trieve k layouts copies. Here we include matching the query with itself as this is a classification task. Out of these only
q = k− t are retrieved and an extra p wrong results are
retrieved.
The precision and recall are given for one query by:
P recision = q q + p (2) Recall = q k− 1= 1− P F P × k− 1 k (3)
A precision of 1 means that no wrong results are returned and a recall of 1 means that all the right results are returned. We will also use the classification accuracy which can be computed for the whole dataset (m layouts and m queries):
CAccuracy = 1 m m ∑ i=1 qi (4)
Where qiis q for the ithquery.
5.1.3
Computational complexity
The computational complexity is of interest for both the computation of the descriptor and the matching of the de-scriptor. They are usually dependant on the number of re-gions in the layout and the number of documents in the database respectively.
We will also look at the size of the descriptors. This pa-rameter is important as it affects the size of the signature and it also affects the size of the index if we want to index a database.
5.2
Testing dataset
Figure 6: Three layouts produced by PAL, JSEG and Voronoi from left to right.
To test our algorithm we created a database of 15 lay-outs similar to the ones in Figure 6. These laylay-outs are the results obtained by three segmentation algorithms PAL [8], JSEG [10] and Voronoi [15] on the documents of the PRiMA dataset [2]. Among these 15 layouts two of them are iden-tical but obtained with a different segmentation algorithm: they have the same number of regions with approximately the same size and the same positions. The layouts contain between 6 and 28 regions. For PAL we only used the block information as we have already stated that text line segmen-tation will create too much instability.
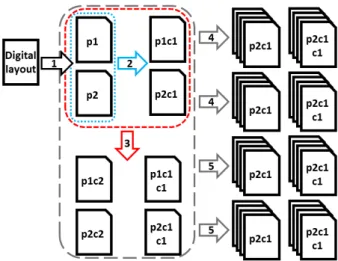
Figure 7 represents the creation process of the dataset. We printed each layout twice on one printer (arrow number 1). Then we photocopied the prints (arrow 2) making 4 pages (2 prints + 2 copies). We photocopied these four pages again (arrow 3) making 8 pages (2 prints, 4 copies, 2 double copies). We then scanned in black and white these pages twice on two scanners (arrows 4 for first scanner and 5 for the second) making 32 layout images. We repeated this process with an other printer making a total of 64 images of the same layout. The total size of the dataset is then 15× 64 = 960 images. The scanners added salt and pepper noise which created many regions made of one or two pixels. Such noise would not be produced by a segmentation algorithm and we removed it from the dataset.
The dataset contains scale variations as the printers add margins around the layout images and hence change their
scale. We also used batch scanners that have introduced a surprisingly significant amount of skew (about 5− 10◦).
Figure 7: The creation process of our dataset.
This dataset will allow us to test the robustness and stabil-ity of our descriptor to real print and scan noise. It is avail-able on http://navidomass.univ-lr.fr/LayoutCopies/.
6.
RESULTS
We compare the results of our descriptor with three other methods: the one of Gordo and Valveny (G & V) [12], the one of Bagdanov and Worring (B & W) [4] and the one of Nakai et al. (LLAH) [19]. Table 1 summarizes all the results except for precision and recall. The symbol↓ indicates that the metrics should be as low as possible to be good and ↑ means the contrary.
6.1
Probability of false positives
6.1.1
Intrinsic PFP
If we try to find an exact match for the descriptors without any matching algorithm we obtain what we call the intrinsic probability of false positives (iPFP).
As there has not been any previous evaluation of the sta-bility of a layout descriptor we implemented the descriptor of Gordo and Valveny [12] and tested it for comparison with-out any matching algorithm. The descriptor contains four informations:
• The angle between the edge joining the centroid of
a region and the centroid of all the regions and the horizontal x axis
• The length of this edge • The area of the region
• The type of the region (text or non text)
We only used the first three informations and set the fourth one to text all the time as it was not available. This will only increase the stability of the descriptor as there will be one less variable per region.
Gordo and Valeveny’s descriptor has an iPFP of 1 while the Delaunay Layout Descriptor has an iPFP of 0.26. The result for Gordo and Valveny’s descriptor is expected as they
Table 1: Summary of the results
Metric DLD G & V B & W LLAH
iPFP↓ 0.26 1.00 NA NA
PFP↓ 0.00 NA NA NA
Classification accuracy↑ 1.00 0.66 0.99 0.98 Computational cost of descriptor↓ O(n log log n) O(n log n) O(n log log n) O(n) Size of the descriptor↓ O(1) O(n) O(n) O(n) Computational cost of matching↓ O(1) O(m) O(m) O(1) Matching time↓ 0.1-23.9s 5s 0.05-0.3s 0.05s Memory use↓ 284(96)Mo 4.7(3.9)Go NA 120(16.1)Go Required number of regions <30-40 Any Any >100
Can be used in secure applications yes no no no
Figure 8: The values of the PFP for different situations and sets of parameters.
use numeric values. Changing any angle/length/area by one pixel will change the descriptor and make it unstable. This would be the same for any other descriptor based on voting or distance computation.
We did not implement Bagdanov and Worring’s algorithm or LLAH as we are very confident they would produce the same results. They both use ”continuous” values which will lead to a very high level of instability.
6.1.2
PFP
The matching algorithm has two parameters: the error on the angle measurment that we accept and the maximum number of instabilities that can occur at the same time. The angle error related to the digitization of the images can be estimated to be below ϵ = 5◦. We found experimentally that the angle variation introduced by the use of a second seg-mentation algorithm for the same layout is 10◦ ≤ ϵ ≤ 15◦. We tested the algorithm with n = 1, n = 2 and n = 3 insta-bilities. We did not try to have more combinations as the results were already perfect up to the fifth decimal. Figure 8 summarizes the results. The lines are named PFP5◦ or PFP15◦ according to the value of ϵ. The adjunction of an s (PFPs) means that each layout is the result of only one segmentation algorithm and we removed the duplicate lay-out that was the results of a second segmentation algorithm. The vertical scale is logarithmic.
Having two instabilities at the same time is enough to have a PFP below 1%. One can also notice that a 5◦angle error is sufficient if we use one segmentation algorithm per lay-out. Two different layouts can be segmented with different
Figure 9: The values of the recall for different situations and sets of parameters.
algorithms. This situation is usually the case in a digitiza-tion framework. These values are (almost) perfect and don’t need to be improved any further. Since there is no point in achieving a PFP lower than the one we achieve we do not find it necessary to compare it with the other algorithms.
6.2
Classification and retrieval
6.2.1
Precision and recall
Similarily to what we did for the probability of false posi-tives, we can compute the precision and recall of our system. The precision is always 100%. The recall is shown in Figure 9 for the same cases as the PFP.
Once again these results are nearly perfect and don’t need to be improved.
6.2.2
Classification accuracy
As the other authors do not provide any probability of false positive, precision or recall for their method, we also use the one they provide. Gordo and Valveny [12] achieved 0.66 classification accuracy on a dataset of 823 documents. Bagdanov and Worring [4] achieved 0.99 classification accu-racy on 857 documents. LLAH [19] achieved 0.98 retrieval accuracy on 1000 images. LLAH is not originally made for classification purposes as it only and always retrieves one result per query hence the authors do not provide any clas-sification accuracy. The accuracy used by LLAh is defined by RAccuracy = 1 m m ∑ i=1 ti (5)
Where ti is a binary value equal to 1 when the result is
correct. This is the limit case of a classification accuracy in the case where only one result is retrieved and each class is a singleton. Thus, we can use it.
For the Delaunay Layout Descriptor (DLD), the classifi-cation accuracy is always 1 except if we try to classify the whole dataset with an angle tolerance of 5◦. If we consider the scheme of LLAH, our accuracy is 1. We always retrieve at least one identical layout.
6.3
Computational cost
We consider that n is the number of regions in a document and m is the number of layouts in the database.
6.3.1
Descriptor computation
The worst case computational cost of the Delaunay tri-angulation is O(n2) as implemented in opencv 2.4.91 but
it can brought down toO(n log n) with the sweep line algo-rithm [16]. For most cases, it will actually beO(n log log n). The transformation of the Delaunay triangulation into an or-dered graph costsO(n) as each centroids is processed once. The total computational cost of the descriptor is thenO(n2) in its current implementation and it can be optimized to
O(n log n) and to O(n log log n) in the general case.
Gordo and Valveny’s descriptor can be computed inO(n log n) because of the sorting algorithm required to sort the fea-tures by ascending order of their first value. Bagdanov and Worring’s can be computed inO(n log log n) in the general case as they also make use of the Delauny triangulation to compute the Voronoi diagram of the layout. LLAH can be computed inO(n) as each region is only processed once in-dependantly from the other regions.
6.3.2
Size of the descriptor
The DLD has a constant size, hence its memory size is
O(1) with respect to n. The other descriptors are computed
region wise and hence, use a memory size ofO(n).
6.3.3
Matching computation
Regarding the matching of one layout with the database, for the DLD it can be achieved in O(1) with respect to
m. This is due to the use of cryptographic hashing (we are
looking for an exact match) and is similar to LLAH. The two other descriptors requireO(m) computations as the query needs to be matched on a one by one basis with all the layouts in the database.
6.4
Experimental results
In a practical case, there are two main criteria to compare algorithms: how much time do they take to execute and how much memory do they require.
6.4.1
Matching time
Computing the descriptor on an Intel Core i7 3740QM with 8 cores at 2.7GHz takes on average 12 milliseconds. Matching a layout with the whole database with an angle error of 5◦an a maximum of 2 simultaneous erros takes on average 0.1 seconds and 1.5 seconds with 3 simultaneous instabilities. If we use an angle error of 15◦, these values go up to 0.8 and 23.9 seconds respectively. It should be noted that this matching time is independant from the size of the database and could be improved as the computation
1
opencv.org
of the instabilities and of their combinations has not been optimized at all.
Gordo and Valveny’s algorithm takes 5s to match a query. Bagdanov and Worring’s algorithm and LLAH take respec-tively 0.05 to 0.3s and 0.05s.
6.4.2
Memory usage
While the memory usage should be directly related to the size of the descriptor, its practical implementation and im-plementation constraints can change it significantly. One should keep in mind that two descriptors using respectively
n bits and 1000× n bits scale up with O(n). Yet one uses a
thousand times more memory than the other.
To compute this metrics for all descriptors, we assume a database of one million layouts and 20 documents/images per layout. This makes a database of 20 million documents. We also consider that each document contains 12 regions on average and that an integer is stored on 32 bits (or 4 octets) of memory. The values in brackets in Table 1 indi-cate theoretical values while the other values are obtained experimentally.
The memory space taken by the DLD can be 128 bits for non secure applications and 256 bits for secure applications. Each layout will then require (128 + 20× 32)/8 = 96 octets. 128 bits for the descriptors and 20× 32 bits for the 20 num-bers of the associated documents. The whole database will then require 96Mo. This value does not take into account implementation constraints such as memory alignment and storage structure (unordered map in our case). We created an index for a virtual database and it uses 284Mo of memory. Gordo and Valveny’s descriptor contains 4 values per re-gion plus one value to identify the document. Hence the the-oretical size of the databse would be (4×12+1)×4×20e6 = 3.9Go. Experimentally we obtained a size of 4.7Go.
The descriptor of Bagdanov and Worring uses 6 integers per region. It also creates a graph for each document. The database is made of prototype graphs that represent each class of layout. We would need to have an estimate of the number of graphs per class and of edges per graph to esti-mate the memory requirement to index the database. We have none of these value and thus prefer not to make an estimate.
LLAH stores one hash (one integer) per word in the doc-ument. In Takeda et al.’s paper they consider a normal number of words to be 200 words. Each word is associated to a document which means that there are two integer values per word: the hash and the number of the document.Hence the theoretical size of the index is 2×4×200×20e6 = 32Go. This value neglects the possible collisions e.g. the words that have the same hash. For each collision, there is one hash/in-teger less to store. Experimentally, Takeda et al. obtained a size of 120Go.
6.5
Domain of application
When using or choosing an algorithm it is important to know what are the constraints for its use and what it can be used for.
The number of possible simultaneous instabilities increases with the number of edges and in consequence with the num-ber of regions. Raising the numnum-ber of simultaneous insta-bilities increases exponentially the number of combinations to test. It would then be computationnaly prohibitive to match the Delaunay Layout Descriptor for documents that
contain more than 30 or 40 regions.
As we have seen LLAH works best with at least 200 or so words. We can safely assume that it does not work properly if there are less than 100 regions. There would not be enough points to properly describe the document.
The other descriptors do not seem to have any specific limitations with respect ot the number of regions.
Since the Delaunay Layout Descriptor is the only one that can be used with any cryptographic hashing, it is also the only one that can be used for secure applications.
7.
DISCUSSION
One could wonder about how much the adjacency matrix of the delaunay triangulation of the layout is representa-tive of this layout. The performance of the DLD proves this representativeness. The DLD does not use the size of the re-gions, neither does it use the distance between the centroids of these regions. But, for a mostly convex region, the bigger the region, the further its centroid will be from the other centroids. Hence the area of a region is reflected by the dis-tance between the centroids. The Delaunay triangulation is directly dependent on these distances between the centroids and their relative positions. Hence, the DLD indirectly con-tains both informations. It is invariant to scale and to a certain extent to rotation. This is expected as rotating a layout too much can change this layout.
8.
CONCLUSION
In this paper we present a stable document layout de-scriptor (Delaunay Layout Dede-scriptor) based on a Delaunay triangulation of region centroids. It comes with a matching algorithm to obtain outstanding performances.
We have shown that it improves the state of the art in every aspect except for the matching time which could be improved. Its stability, precision, recall and accuracy reach 100%. It also reduces by a factor 400 the memory required to index a document database and can match a document against a database of any size in less than a second up to 28 seconds depending on the required level of performance.
When using the Delaunay Layout Descriptor, one should have in mind one tip to leverage all its power. The seg-mentation algorithm should not produce too many aligned regions. Hence, it should not segment text lines but rather text paragraphs or even better: text columns. Our test dataset contains layouts with as little as 6 regions and as much as 28 regions which proves that the descriptor should work in most cases.
Finally, the Delaunay Layout Descriptor is fast, stable, robust, precise and concise beyond all expectations. From our point of view, it solves the issue of describing a layout. Its implementation could probably be improved as it has not been extensively optimized especially regarding the combi-nation of the instabilities. The next challenge is to have a segmentation algorithm with the same level of performance as it is no use to match a layout if the layout is wrong or unstable. We could have attempted to create such a segmen-tation algorithm before but the analysis of the stability of a segmentation algorithm requires an extremely stable tool to compare the layouts it produces. This is why we created the Delaunay Layout Descriptor before trying to design a stable segmentation algorithm.
9.
REFERENCES
[1] F. ´Alvaro. A shape-based layout descriptor for classifying spatial relationships in handwritten math. In Proc. of the 2013 symposium on Document
engineering, pages 123–126. ACM, 2013.
[2] A. Antonacopoulos, D. Bridson, C. Papadopoulos, and S. Pletschacher. A realistic dataset for performance evaluation of document layout analysis. In Proc. of
10th International Conference on Document Analysis and Recognition (ICDAR), pages 296–300. IEEE, 2009.
[3] ANTS. Sp´ecifications techniques des Codes `a Barres 2D-Doc. Technical report, ANTS, 2013.
[4] A. D. Bagdanov and M. Worring. First order Gaussian graphs for efficient structure classification. Pattern
Recognition, 36:1311–1324, 2003.
[5] J. Bryson and P. Gallagher. Secure Hash Standard (SHS), 2012.
[6] F. Cesarini, M. Lastri, S. Marinai, and G. Soda. Encoding of modified X-Y trees for document
classification. Proc. of 6th International Conference on
Document Analysis and Recognition (ICDAR), 2001.
[7] B. B. Chaudhuri. Digital document processing. major
directions and recent advances. Springer, 2007.
[8] K. Chen, F. Yin, and C.-l. Liu. Hybrid page segmentation with efficient whitespace rectangles extraction and grouping. In Proc. of 12th International
Conference on Document Analysis and Recognition (ICDAR), pages 958–962. IEEE, Aug. 2013.
[9] B. Co¨uasnon. DMOS, a generic document recognition method: application to table structure analysis in a general and in a specific way. In International Journal
on Document Analysis and Recognition (IJDAR),
volume 8, pages 111–122. Springer-Verlag, 2006. [10] Y. Deng and B. S. Manjunath. Unsupervised
segmentation of color-texture regions in images and video. Pattern Analysis and Machine Intelligence
(PAMI), 23(8):800–810, 2001.
[11] F. Esposito, D. Malerba, and G. Semeraro. Multistrategy learning for document recognition.
Applied Artificial Intelligence an International Journal, 8(1):33–84, 1994.
[12] A. Gordo and E. Valveny. A rotation invariant page layout descriptor for document classification and retrieval. In Proc. of the 10th International Conference
on Document Analysis and Recognition (ICDAR),
pages 481–485. IEEE, 2009.
[13] T. Kanungo, R. M. Haralick, and I. Phillips. Global and local document degradation models. In Proc. of
2nd International Conference on Document Analysis and Recognition (ICDAR), pages 730–734. IEEE, 1993.
[14] E. Kasutani and A. Yamada. The MPEG-7 color layout descriptor: a compact image feature description for high-speed image/video segment retrieval. In Proc.
of 2001 International Conference on Image Processing (ICIP), volume 1. IEEE, 2001.
[15] K. Kise, A. Sato, and M. Iwata. Segmentation of page images using the area voronoi diagram. Computer
Vision and Image Understanding, 70(3):370–382, June
1998.
[16] G. Leach and G. Leach. Improving worst-case optimal Delaunay triangulation algorithms. In Proc. of 4th
pages 340–346, 1992.
[17] J. L. J. Liang, D. Doermann, M. Ma, and J. Guo. Page classification through logical labelling. In Proc. of 16th
International Conference on Pattern Recognition (ICPR), volume 3, pages 477–480. IEEE, 2002.
[18] A. Malvido Garci`a. Secure Imprint Generated for Paper Documents (SIGNED). Technical Report December 2010, Bit Oceans, 2013.
[19] T. Nakai, K. Kise, and M. Iwamura. Use of affine invariants in locally likely arrangement hashing for camera-based document image retrieval. Lecture Notes
in Computer Science (LNCS), 3872:541–552, 2006.
[20] R. Rivest. The MD5 message-digest algorithm. Technical report, Internet activities board, 1992.