Publisher’s version / Version de l'éditeur: Proceedings IAHR’04, 2, pp. 208-216, 2004-06
READ THESE TERMS AND CONDITIONS CAREFULLY BEFORE USING THIS WEBSITE. https://nrc-publications.canada.ca/eng/copyright
Vous avez des questions? Nous pouvons vous aider. Pour communiquer directement avec un auteur, consultez la première page de la revue dans laquelle son article a été publié afin de trouver ses coordonnées. Si vous n’arrivez pas à les repérer, communiquez avec nous à PublicationsArchive-ArchivesPublications@nrc-cnrc.gc.ca.
Questions? Contact the NRC Publications Archive team at
PublicationsArchive-ArchivesPublications@nrc-cnrc.gc.ca. If you wish to email the authors directly, please see the first page of the publication for their contact information.
NRC Publications Archive
Archives des publications du CNRC
This publication could be one of several versions: author’s original, accepted manuscript or the publisher’s version. / La version de cette publication peut être l’une des suivantes : la version prépublication de l’auteur, la version acceptée du manuscrit ou la version de l’éditeur.
Access and use of this website and the material on it are subject to the Terms and Conditions set forth at
Sliding resistance of grounded spray ice islands
Barker, A.; Timco, G. W.
https://publications-cnrc.canada.ca/fra/droits
L’accès à ce site Web et l’utilisation de son contenu sont assujettis aux conditions présentées dans le site LISEZ CES CONDITIONS ATTENTIVEMENT AVANT D’UTILISER CE SITE WEB.
NRC Publications Record / Notice d'Archives des publications de CNRC:
https://nrc-publications.canada.ca/eng/view/object/?id=31e2357b-9dca-407e-8781-838155129ebb https://publications-cnrc.canada.ca/fra/voir/objet/?id=31e2357b-9dca-407e-8781-838155129ebb
17th International Symposium on Ice Saint Petersburg, Russia, 21-25 June 2004
International Association of Hydraulic Engineering and Research Proceedings IAHR’04, Vol.2, pp 208-216, 2004.
SLIDING RESISTANCE OF GROUNDED SPRAY ICE ISLANDS
A. Barker1 and G.W. Timco1
ABSTRACT
In the 1970’s and 1980’s, a number of grounded ice islands were used as drilling platforms in the Beaufort Sea. These islands were constructed by spraying sea water into the air to form ice, gradually building up a large platform area that eventually grounded on the seabed. One important factor in the feasibility of using ice in such a manner concerns the sliding resistance of the grounded spray ice. Reports and papers from four sites (Mars, Angasak, Karluk and Nipterk ice islands) were studied in detail. This study provides both qualitative and quantitative knowledge on the sliding resistance of ice pads. It illustrates that these structures were very stable with respect to seabed sliding.
INTRODUCTION
During the exploration drilling for oil and gas in the Canadian and US Beaufort Seas in the 1970s and 1980s, several different types of structures were used to support the drilling activities. These structures included artificial islands, drill ships, gravity caisson structures, and spray ice islands. Different structures were used depending upon the ice conditions and water depth. Initially, gravel islands were constructed in shallow waters (up to 12 m). For these islands, the ice surrounding them was landfast, first-year ice and had little movement during the winter months. The cost of this type of construction was quite high. For many years, ice has been used as a construction material to construct bridges, roads and aircraft runways, and it was used in the form of thickened ice platforms to support drilling activities in the high Arctic. The first spray ice structure to be constructed was the Sohio test island (Goff and Masterson, 1986). This structure was built as a grounded, sprayed test island. In the mid-1980s, innovative technology was developed to use spray ice to construct a drilling platform. Four spray ice islands were successfully constructed and used as drilling platforms – two in the Canadian Beaufort Sea and two in the US Beaufort Sea. These types of islands are formed by spraying sea water into the cold air which would then freeze the water into spray ice. Eventually, the ice is of sufficient thickness and weight that it grounds on the sea bottom. Further spraying yields a higher-freeboard ice pad that is used to support the rig and the attendant equipment used for exploration drilling.
1
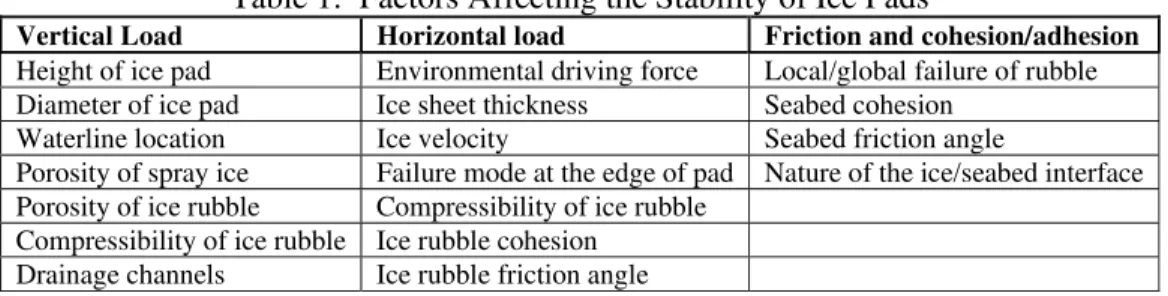
One of the key factors for using this type of technology is the stability of the ice pad. It is essential that the ice pad not move by any appreciable amount due to loading by the surrounding ice sheet. That is, the ice pad should have sufficiently high sliding resistance to withstand the imposed ice loads. At first glance, the sliding resistance of a spray ice pad appears to be quite a simple physics problem to solve. The design engineer must design the size and shape of the ice pad to resist the advancing ice sheet. The ice pad should remain stationary if the ice pad is large enough to overcome the environmental driving forces. There are, however, a large number of issues and uncertainties faced by the design engineer that must be addressed, as summarized in Table 1. These make the task of determining the stability of an ice island a difficult exercise. With this large number of uncertainties, an ice pad cannot be designed in the traditional manner of designing a structure or building. The first ice pads were developed conceptually and field trials were performed to test the design. Subsequent ice pads were built using information gained from each previous ice pad. In this paper, the salient features of four Beaufort Sea ice islands are summarized, and a sliding stability analysis is carried out to provide both qualitative and quantitative knowledge of their sliding resistance.
Table 1: Factors Affecting the Stability of Ice Pads
Vertical Load Horizontal load Friction and cohesion/adhesion
Height of ice pad Environmental driving force Local/global failure of rubble Diameter of ice pad Ice sheet thickness Seabed cohesion
Waterline location Ice velocity Seabed friction angle
Porosity of spray ice Failure mode at the edge of pad Nature of the ice/seabed interface Porosity of ice rubble Compressibility of ice rubble
Compressibility of ice rubble Ice rubble cohesion Drainage channels Ice rubble friction angle
ICE ISLAND DETAILS
Mars Ice Island
The Mars ice island was the first use of grounded spray ice as a drilling platform. It was constructed in western Harrison Bay in Alaska in early 1986. Amoco was the operator of the well. Most of the information on the Mars Island was found in Funegard et al. (1987). The seabed was clay with an undrained shear strength of 48 kPa (Masterson, personal communication). The water depth was 8 m. The total logged pumping hours for the construction were 892 hours over a 46 day period with over 1 million m³ of water pumped. The as-built island consisted of a 215 m diameter drill rig area with a waterline width of 290 m, and a freeboard of +8 m. Figure 1 shows a photograph of the completed ice island.
The monitoring of movement was done in a real time environment to provide immediate warning if the stability of the island was threatened. Details of the results of the monitoring are confidential and are not publicly available. However, Funegard et al (1987) indicated that there were no large scale movements of the ice island during its use as a drilling platform. Details of the local ice conditions were not provided, so it was only possible to calculate an estimate of the grounding stability of this ice pad.
Angasak Ice Island
The Angasak spray ice island was located in the Canadian Beaufort Sea near Cape Dalhousie and it was constructed in 1986. Esso Resources Canada Limited was the operator of the well. Information for the Angasak Ice Island was found in Weaver and Gregor (1988), Weaver (1987), Golder and Associates (1986) and Weaver and Foster (1986). Angasak Ice Island was constructed in 5.5 m of water, approximately 1 km from shore. The seabed consisted of a silty sand, with an internal angle of friction of 30° and an undrained shear strength of 18 kPa at the island-seabed interface. As a result of unusually warm weather, the spray ice density was higher, creating a stronger pad. In total, 398 000 m³ of water was pumped, over a period of 58 days.
The design normal force for the Angasak spray ice island was 912 MN, with a design global load of 300 MN. The final grounded diameter was 203 m. The island top diameter was 157 m, while the waterline diameter was 214 m. The freeboard was 6.1 m. The projected design ice thickness for the beginning of May was 2.0 m. A factor of safety of 1.5 and a maximum ice load of 1.5 MN/m were the minimum requirements for horizontal shear failure at the seabed. However, the maximum observed ice load was less than 0.2 MN/m. The minimum spray ice strength appeared to be greater than 23 kPa. The performance monitoring program at Angasak for monitoring horizontal island movement used three slope indicators, three in-place inclinometers and trigonometric surveys. The data was collected in real time in order to evaluate island stability as part of an alert program. Global shear failures in the order of 0.15 m were determined to be unacceptable. No horizontal movement was mentioned in the reports or papers.
Karluk Ice Island
Karluk Ice Island, located in the American Beaufort Sea near Prudhoe Bay, Alaska, was constructed in 1988. The well operator was Chevron U.S.A. Inc., with Mobil Exploration & Production Inc. as a joint venture partner. Details for the Karluk Ice Island were found in Bungo et al. (1990). The seabed where the island was constructed was silty sand, with a friction angle of 36°. The island was located in 7.3 m of water. Construction of the ice island began on December 13, 1988 and was completed on January 20, 1989 (39 days). The average rate of spray ice build-up was 0.9 m/day once the island had grounded. Approximately 613 hours of spraying were required to achieve the required volume of ice. The freeboard of the island was approximately 6.7 m, while the average core thickness was 14.3 m with a diameter of 270 m. The final ice volume of the island was approximately 697 000 m³. The maximum horizontal design load for the Karluk Ice Island was 367 MN, with a load factor of 1.5 for lateral stability. The average measured spray ice density after construction was completed was 614 kg/m³. Five in-place inclinometers at three locations and six manual inclinometer stations were used to monitor horizontal movement of the island. The in-place inclinometers measured maximum movements of 17.5 mm, 52.5 mm and 57.5 mm around the perimeter of the island. These movements occurred radially,
moving away from the island centre and were attributed to settlement of the island under self-weight. It was concluded that movement was minimal and did not impose constraints on or limitations to the drilling. This was the maximum drilling area movement reported of the four ice islands.
Nipterk Ice Island
Nipterk spray ice island was constructed in the Canadian Beaufort Sea in 1988. The well operator was Esso Resources Canada Limited, in partnership with Chevron Canada, Petro Canada, Home Oil, AT&S and Gulf Canada. Details for the Nipterk Ice Island were obtained from Poplin and Weaver (1991); Weaver et al. (1991); Poplin (1989); and Weaver (1988). The Nipterk Ice Island was located near the Mackenzie River delta, approximately 6 km from Pelly Island. This location was more exposed that either the Mars or Angasak Ice Islands, the seabed soils were weaker and as a result of its proximity to the Mackenzie River delta, the water was less saline (and warmer). The island was located in approximately 6.5 m of water. The water column, in mid-November, 1988, was freshwater to a depth of 4 m below the water surface, and 15 ppt saline water below that. The seabed was a stiff overconsolidated silt, with a thin overlayer of very soft silty clay. The average minimum soil strength was 12 kPa and the soil was cohesive. The effective adhesion between the soil and the ice was estimated to be between 0.85 and 0.95 of the basic soil strength. Construction began on November 28, 1988, and was completed on January 20, 1989 (53 days). Layers were applied in thicknesses ranging from 1.0 m to 3.0 m. The island grounded unevenly, due to the roughness of the first year ice sheet.
The average freeboard over the working surface of the island was 4.15 m, with a freeboard of 3.7 m elsewhere. The final spray ice volume was approximately 825 000 m³. The design island diameter was 320 m, while the working surface diameter was 150 m. The average density in the ice island freeboard was 580 kg/m³. The surrounding consolidated level ice thickness was approximately 1.3 m on January 20. The design ice thickness, for May 1, was 2.0 m. The design ice load was calculated to be 600 MN, with a design sliding resistance of 970 MN. Three in-place inclinometers and five manual inclinometers were used to monitor horizontal movement of the ice island. All data was collected in real time. There was no significant horizontal movement during the early stages of the monitoring period. From Julian Day 86 to Julian Day 110, movement was detected; approximately 25 mm within the working area and a maximum amount of 100 mm in the outer perimeter. By the end of the season in April, the total movement recorded was 200 mm along the seabed. The design limit was 150 mm/event. The major ice loading events were considered to be thermal events.
SLIDING STABILITY ANALYSIS Basic concepts
It is important to identify and define the key parameters for the sliding resistance of the spray ice. The simplest concept for the sliding of the ice pad is to assume that the ice pad fails globally and is pushed off site by the advancing ice sheet. There are three different potential modes for this to occur:
1. Failure along the ice-seabed interface 2. Failure through the seabed.
3. Failure in the ice
Local failure and failure through the spray ice are not addressed here. In this paper, only failure along the ice-seabed interface or through the seabed is considered. The sliding
resistance corresponds to the scenario that produces the lowest force. In this paper, failure is defined as gross movement of the ice island. Here, an ice island is considered to be essentially a deformable body. The movement may further be considered to occur in two stages, where stress deformation occurs with the commencement of the driving force, followed by the initiation of sliding movement along the seabed (see Figure 2). It may be possible to differentiate between the two types of movement, where the former occurs primarily in the surface of the spray ice, by examining detailed movement records. Where such records were not available, and it was unclear if sliding occurred along the seabed, movement was assumed to be purely stress deformation (that is, no failure along or through the seabed, nor through the ice).
B) Stress deformation A) Original form C) Initiation of sliding Driving Force
Horizontal Sliding Resistance Weight of Ice on
Seabed
Figure 2: Schematic illustration of the mechanism of global sliding along the seabed. Deformation and movement are greatly exaggerated for clarity.
The horizontal sliding resistance, FH, can be related to the normal force, N, (i.e the weight of the ice) on the sea bottom as follows:
β
tan N Ac
FH = + (1)
where A is the horizontal surface area of the structure, c is a constant and β is a friction angle. Weaver and Poplin (1997) used a similar formula, and indicated that c may be considered as an adhesion factor. Equation 1 is analogous to the expression of shear resistance along a plane within soils. In that case, c and β become the cohesion and angle of internal friction of the soil, respectively. It should be emphasized that in the present work, it is assumed that slip could take place at the interface between the ice and the soil or through the seabed. Therefore the friction parameters, c and β, are necessarily equal to the above mentioned soil parameters. The cohesion and angle of internal friction of the soil give upper bounds for the values of c and β.
The mechanics of sliding and friction resistance at the interface is not as well understood as the failure of soils. It is possible, however, to consider two extreme cases that are analogous to soil failure. In the one case, the shear resistance is linearly proportional to the normal force, and Equation 1 would be reduced to
N f N
FH = tanβ = (2)
where f is a friction coefficient. This case is similar to failure in sand. The stability is directly related to the weight of the ice island. In the other case, shear resistance would have a constant value, independent of the normal force, as
Ac
This case corresponds to failure of clay. Note that in this case, the stability is not directly related to the weight of the island, but is dictated by the area of the ice island. In this paper, the stability of the ice islands will be examined in terms of these two extreme cases. Movement was recorded for two of the islands – Karluk and Nipterk. Karluk was built on a sandy seabed so Equation 2 is used to quantify the stability. Nipterk was built on a clay seabed so Equation 3 is used for this case. To do the analysis, information on the horizontal driving force, the normal force (weight of the ice island for Equation 2) and the area of the ice island (for Equation 3) is required in order to solve for β or c.
The normal force on the seabed is a function of the ice thickness and aerial extent, ice density and water depth. Stevens et al. (1984) derived the following equation to calculate the normal force for an ice pad constructed using spray ice:
A g Z g d e Ns =[(1− s)(ρi−ρw) +ρs s ] (4)
where Ns is the normal force due to spray ice, es is the sprayed ice void ratio, ρw is the water density, ρi is the density of ice either in rubble blocks or in spray ice granules (kg/m3), d is the water depth (m), ρs is the bulk average density of spray ice above water (kg/m3), Zs is the sprayed ice thickness (m) and A is the surface area (m2). The values that were used for the parameters in the equations (i.e. porosity, density, etc.) were taken from the original source whenever possible. If a value was not known, a reasonable value was assumed.
To estimate the possible horizontal driving force on the ice island, recent analysis of full-scale ice loads was used. Timco and Johnston (2004) analyzed the global loads on all of the caisson structures that were used in the Beaufort Sea. They found that the load was a function of the ice thickness, ice macrostructure and the failure mode of the ice. They produced a predictive equation for the average global load as
h w T
FH = fm (5)
where the FH is the driving force (in MN) on the structure, w is the width of the structure, h is the ice thickness and Tfm is a failure-mode parameter. In the present case, where the ice pads were usually surrounded by landfast ice, long-term creep loads would predominate so a value of 0.83 MN/m2 was used for the failure mode parameter. Note that this value for the driving force represents a realistic value of the load that would be lower than the design value for the island.
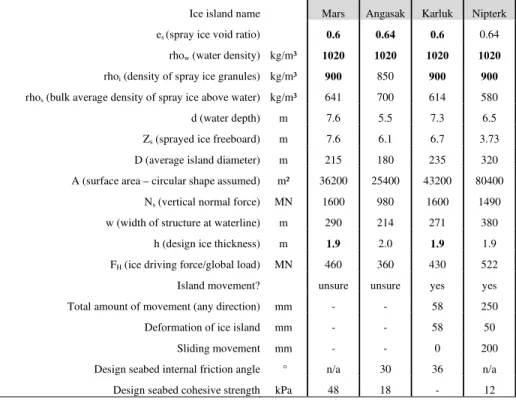
Table 2 provides a summary of the ice properties and analysis results for each of the spray ice structures. Most values were gleaned from the published reports and papers, listed in the reference section of this report, although some values were assumed for each site. The calculated values of the normal force and driving force for each ice structure are shown in Table 2. The calculated average ice driving force on the ice islands ranged from 360 to 522 MN, while the normal loads varied between 980 and 1600 MN. Any reported values concerning either the cohesion or the angle of internal friction of the seabed are also noted.
Table 2: Summary of ice island parameters (Values in bold were assumed) Ice island name Mars Angasak Karluk Nipterk es (spray ice void ratio) 0.6 0.64 0.6 0.64
rhow(water density) kg/m³ 1020 1020 1020 1020
rhoi (density of spray ice granules) kg/m³ 900 850 900 900
rhos (bulk average density of spray ice above water) kg/m³ 641 700 614 580
d (water depth) m 7.6 5.5 7.3 6.5 Zs (sprayed ice freeboard) m 7.6 6.1 6.7 3.73
D (average island diameter) m 215 180 235 320 A (surface area – circular shape assumed) m² 36200 25400 43200 80400
Ns (vertical normal force) MN 1600 980 1600 1490
w (width of structure at waterline) m 290 214 271 380 h (design ice thickness) m 1.9 2.0 1.9 1.9 FH (ice driving force/global load) MN 460 360 430 522
Island movement? unsure unsure yes yes Total amount of movement (any direction) mm - - 58 250 Deformation of ice island mm - - 58 50
Sliding movement mm - - 0 200 Design seabed internal friction angle ° n/a 30 36 n/a
Design seabed cohesive strength kPa 48 18 - 12
Movement of Karluk
Bungo et al. (1990) reported that there was movement of the Karluk Ice Island. As shown in Figure 3, however, the movement appeared to occur radially away from the centre of the island. As a result, it is likely that this radial deformation was due to settlement of the island, rather than deformation from the surrounding ice sheet (i.e. island sliding). Thus, the Karluk Ice Island was stable with respect to the horizontal driving force. Since the island was stable, a friction coefficient cannot be determined from Equation 2. However, it is interesting to note that the ratio of the horizontal-to-vertical loads (i.e. the driving force / island weight) ratio is estimated to be 0.27. Since the island didn’t slide, the friction coefficient had to be higher than this value.
Movement of Nipterk
At Nipterk, a maximum amount of movement of 25 mm was detected within the working surface perimeter, along the seabed. At the outer edge, the maximum movement recorded by the end of the season was 250 mm. For this island, the report by Poplin and Weaver (1991) provides plots that detail the data obtained from the onsite slope indicators and inclinometers. An example from one outer edge station is shown in Figure 4. This plot illustrates that the movement of the ice island is a combination of sliding and shear deformation. Of the 250 mm of movement recorded at the outer edge of the ice pad, approximately 50 mm corresponds to a simple shear deformation of the pad, and the remaining 200 mm appears to result from sliding along the seabed. The deformation is considered in terms of both of the movement mechanisms shown in Figure 3c. A simple analysis of the shear deformation suggests that the effective shear modulus for the ice pad for long-term loading (months) is on the order of 2 MPa. With regard to overall sliding of the ice island, Nipterk was built on a clay seabed so Equation 3 can be used to estimate on overall cohesive strength. Using the as-built area of 80 400 m2 and a horizontal driving force of 522 MN (from Equation 5), a large-scale cohesive strength of 7 kPa is determined.
Since the average minimum strength of the seabed was 12 kPa, this suggests that failure took place along the ice-seabed interface.
Figure 3: Recorded ice island movements for Karluk (from Bungo et al., 1990)
Figure 4: Movement of Nipterk Ice Island, showing movement variations with depth. Movement at the seabed is approximately 200 mm (from Poplin and Weaver, 1991).
SUMMARY
A review has been presented of four ice islands that were built in the Beaufort Sea. An examination of the stability of the islands indicates that these structures can be quite stable with respect to sliding movements if they are designed properly. An analysis was presented to attempt to quantify the stability. The movement that was detected at Karluk and Nipterk was not catastrophic in nature. Rather, it was generally a creeping process that resulted in cumulative displacement over the season of use. In the instances where larger movements occurred over a short period of time (a few days), this movement was still considered to be within acceptable tolerances. Although the concepts used here are quite simple and straightforward, they provide some insight into the stability of the islands on a large scale. The work described here is part of a report (Barker and Timco, 2004) that examines the stability of these four ice islands, as well as three relief well ice pads, three ice barriers and a field study of grounded spray ice.
ACKNOWLEDGMENTS
The authors would like to acknowledge funding for this work from the Program of Energy Research and Development (PERD), Northern POL activity and Devon Canada Corporation. The technical assistance of Anne Collins and helpful comments from Dan Masterson, Brian Wright and Mohamed Sayed are gratefully appreciated.
REFERENCES
Barker, A. and Timco, G. (2004) Sliding Resistance of Grounded Spray Ice Structures. PERD/CHC Report CHC-TR-017. Ottawa, Canada.
Bungo, W., Masterson, D.M., Kenny, J. and Gamble, R. (1990) Karluk Ice Island.
Proceedings of the 9th International Offshore Mechanics and Arctic Engineering
Symposium (OMAE’90), Houston, U.S.A. Vol. IV, pp. 9-17.
Funegard, E.G., Nagel, R.H. and Olson, G.G. (1987) Design and Construction of the Mars Ice Island. Proceedings of the 6th International Offshore Mechanics and Arctic Engineering Symposium (OMAE’87), Houston, U.S.A. Vol IV, pp 25-32.
Goff, R.D. and Masterson, D. M. (1986) "Construction of a Sprayed Ice Island for Exploration", Proceedings of the 5th International Offshore Mechanics and Arctic Engineering Symposium (OMAE’86), Tokyo, Japan. Vol IV, pp 105-112.
Golder Associates (1986) Esso Resources Canada Limited Design Review Angasaak L-03 Spray Ice Island, Cape Dalhousie, N.W.T. Golder Associates Confidential Report 862-2056. Calgary, Canada.
Golder Associates (1984) Report to Esso Resources Canada Limited On Geotechnical Analysis of Kadluk Spray Ice Island. Golder Associates Confidential Report 842-2039. Calgary, Canada.
Kemp, T.S. (1984) Grounded Ice Pads as Drilling Bases in the Beaufort Sea. Proceedings
of the 7th International Symposium on Ice (IAHR’84), Hamburg, Germany. Vol. III,
p.175-186.
Mellor, M., 1983. Mechanical Behavior of Sea Ice. US Army CRREL Monograph 83-1, Hanover, N.H., USA.
Poplin, J.P. (1991) Nipterk P-32 Spray Ice Island Ablation Protection Experiment. Esso Resources Canada Confidential Report ERCL.RS.89.24. Calgary, Canada.
Poplin, J.P. and Weaver, J.S. (1991) Nipterk P-32 Spray Ice Island Analysis of Island Performance. Esso Resources Canada Ltd. Confidential Report ERCL.RS.91.27. Calgary, Canada.
Stevens, G.S., Kemp, T.S., and Foster, R.J. (1984) An Engineering Assessment of the Kadluk O-07 Relief Well Ice Pad. Esso Resources Canada Confidential Report ERCL.RS.84.23. Calgary, Canada.
Timco, G.W. and Johnston, M. (2004) Ice Loads on the Caisson Structures in the Canadian Beaufort Sea. Cold Regions Science and Technology (in press).
Weaver, J.S. (1988) Nipterk P-32 Spray Ice Island Design Report. Esso Resources Canada Ltd. Confidential Report ERCL.RS.88.17. Calgary, Canada.
Weaver, J.S. (1987) Angasak L-03 Spray Ice Island Stability Verification Report. Esso Resources Canada Ltd. Confidential Report ERCL.RS.87.04. Calgary, Canada. Weaver, J.S. and Foster, R.J. (1986) Design of Angasak L-03 Spray Ice Island. Esso
Resources Canada Ltd. Confidential Report ERCL.RS.86.15. Calgary, Canada. Weaver, J.S. and Gregor, L.C. (1988) The Design, Construction and Verification of the
Angasak Spray Ice Exploration Island. Proceedings of the 7th International Offshore Mechanics and Arctic Engineering Symposium (OMAE’88), Houston, U.S.A. pp. 177-183.
Weaver, J.S. and Poplin, J.P. (1997) A case history of the Nipterk P-32 spray ice island. Canadian Geotechnical Journal. Vol.34, p.1-16, NRC Research Press, Ottawa. Weaver, J.S., Poplin, J.P. and Croasdale, K.R. (1991) Spray Ice Islands for Exploration in
the Canadian Beaufort Sea. Proceedings of the 10th International Offshore Mechanics and Arctic Engineering Symposium (OMAE’91), Stavangor, Norway. Vol. IV, pp. 17-22.