HAL Id: hal-00304227
https://hal.archives-ouvertes.fr/hal-00304227
Submitted on 3 Jun 2008HAL is a multi-disciplinary open access
archive for the deposit and dissemination of sci-entific research documents, whether they are pub-lished or not. The documents may come from teaching and research institutions in France or abroad, or from public or private research centers.
L’archive ouverte pluridisciplinaire HAL, est destinée au dépôt et à la diffusion de documents scientifiques de niveau recherche, publiés ou non, émanant des établissements d’enseignement et de recherche français ou étrangers, des laboratoires publics ou privés.
Investigation of the hygroscopic properties of Ca(NO3)2
and internally mixed Ca(NO3)2/CaCO3 particles by
micro-Raman spectrometry
Y. J. Liu, T. Zhu, D. F. Zhao, Z. F. Zhang
To cite this version:
Y. J. Liu, T. Zhu, D. F. Zhao, Z. F. Zhang. Investigation of the hygroscopic properties of Ca(NO3)2 and internally mixed Ca(NO3)2/CaCO3 particles by micro-Raman spectrometry. Atmospheric Chem-istry and Physics Discussions, European Geosciences Union, 2008, 8 (3), pp.10597-10625. �hal-00304227�
ACPD
8, 10597–10625, 2008 Hygroscopic properties of Ca(NO3)2particles by Raman spectra Y. J. Liu et al. Title Page Abstract Introduction Conclusions References Tables Figures ◭ ◮ ◭ ◮ Back CloseFull Screen / Esc
Printer-friendly Version Interactive Discussion
Atmos. Chem. Phys. Discuss., 8, 10597–10625, 2008 www.atmos-chem-phys-discuss.net/8/10597/2008/ © Author(s) 2008. This work is distributed under the Creative Commons Attribution 3.0 License.
Atmospheric Chemistry and Physics Discussions
Investigation of the hygroscopic
properties of Ca(NO
3
)
2
and internally
mixed Ca(NO
3
)
2
/CaCO
3
particles by
micro-Raman spectrometry
Y. J. Liu, T. Zhu, D. F. Zhao, and Z. F. Zhang
State Key Joint Laboratory of Environmental Simulation and Pollution Control, School of Environmental Science and Engineering, Peking University, Beijing 100871, China Received: 9 April 2008 – Accepted: 28 April 2008 – Published: 3 June 2008 Correspondence to: T. Zhu (tzhu@pku.edu.cn)
ACPD
8, 10597–10625, 2008 Hygroscopic properties of Ca(NO3)2particles by Raman spectra Y. J. Liu et al. Title Page Abstract Introduction Conclusions References Tables Figures ◭ ◮ ◭ ◮ Back CloseFull Screen / Esc
Printer-friendly Version Interactive Discussion
Abstract
To understand and predict the role of mineral aerosol particles processed by reactive nitrogen species in the atmosphere, the hygroscopic properties of both Ca(NO3)2and
Ca(NO3)2-containing mineral particles must be well understood. Using a micro-Raman system, the dehydration and hydration processes of micro-sized individual Ca(NO3)2
5
and internally mixed Ca(NO3)2/CaCO3 particles were investigated systematically. In
addition to accurate quantification of the dependence of water content on relative hu-midity (RH), significant new spectroscopic evidence related to chemical structure was also obtained to confirm the occurrence of amorphous solid state and to better under-stand the phase transition process. The Ca(NO3)2particles exhibit reversible behavior 10
in the dehydration and hydration processes; they are in the state of solution droplets above 10% RH and amorphous hydrates below 7% RH, and phase transition occurs at 7–10% RH. The hygroscopic behavior of Ca(NO3)2/CaCO3 particles is identical to
that of pure Ca(NO3)2particles, suggesting a negligible effect of the inclusion of slightly soluble CaCO3.
15
1 Introduction
Large quantities of mineral dust particles are emitted from desert and arid regions on the earth every year (Tegen et al., 1996) and transported over long distances, in-fluencing the climate and atmospheric chemistry on both regional and global scales (Dentener et al., 1996; Seinfeld et al., 2004; Tang et al., 2004). When transported 20
through a polluted atmosphere, reactive components of mineral aerosols such as cal-cite and dolomite can react readily with reactive nitrogen species to yield nitrate salt products (Song and Carmichael, 2001; Krueger et al., 2003, 2004). The presence of Ca(NO3)2 in aged mineral aerosols has been verified by single-particle analysis in
different areas of the world (Lee et al., 2002; Mamane and Gottlieb, 1992; Ro et al., 25
ACPD
8, 10597–10625, 2008 Hygroscopic properties of Ca(NO3)2particles by Raman spectra Y. J. Liu et al. Title Page Abstract Introduction Conclusions References Tables Figures ◭ ◮ ◭ ◮ Back CloseFull Screen / Esc
Printer-friendly Version Interactive Discussion
can be converted completely to Ca(NO3)2(Laskin et al., 2005a; Sullivan et al., 2007). In comparison to carbonate minerals, the Ca(NO3)2product is very soluble and should
have very different hygroscopic behavior. Because phase and water content govern the shape, size, refractive index, and reactivity of aerosol particles, the hygroscopic prop-erties of both Ca(NO3)2particles and Ca(NO3)2-containing mineral particles should be
5
investigated in detail before evaluating the effect of mineral dust particles on climate and atmospheric chemistry.
The hygroscopic behavior of Ca(NO3)2particles has been investigated in laboratory
studies using the electrodynamic balance (EDB; Tang and Fung, 1997), environmental scanning electron microscope (ESEM; Laskin et al., 2005b), and tandem differential 10
mobility analyzer (TDMA; Gibson et al., 2006). Whereas the EDB measurements cov-ered both dehydration and hydration processes, the other two studies focused only on the hydration process. Although all three studies agreed that deliquescence transition of Ca(NO3)2 particles occurred between solution phase and amorphous solid phase that has not been observed previously in bulk samples, only Tang and Fung attempted 15
to describe the amorphous phase in terms of water content and morphological fea-tures. Moreover, the deliquescence transition process did not show good agreement among the three studies. EDB measurements indicated that the particle water content increased from 10% relative humidity (RH) and reached that of the corresponding su-persaturated droplets at 15% RH. Using ESEM, Laskin et al. (2005b) observed initial 20
morphological changes at 8% RH, a further volume increase at 9–10% RH, and fully developed droplet formation at 11% RH. Because only a very small change in size was measured, the TDMA study concluded that the transition occurred close to 10% RH.
The investigation of the hygroscopic properties of Ca(NO3)2-containing mineral
parti-cles has been limited to ESEM observations. Laksin et al. (2005b) reported that individ-25
ual Ca(NO3)2 particles and internally mixed Ca(NO3)2/CaCO3 particles showed iden-tical morphological changes from 7 to 11% RH, suggesting similar deliquescence pro-cesses. Shi et al. (2008) observed Ca(NO3)2-containing dust particles in the aqueous
ACPD
8, 10597–10625, 2008 Hygroscopic properties of Ca(NO3)2particles by Raman spectra Y. J. Liu et al. Title Page Abstract Introduction Conclusions References Tables Figures ◭ ◮ ◭ ◮ Back CloseFull Screen / Esc
Printer-friendly Version Interactive Discussion
no more systematic investigations of the hygroscopic behavior of Ca(NO3)2-containing mineral dust particles, including both deliquescence and efflorescence transition and the RH dependence of the water content.
Micro-Raman spectroscopy allows in situ analyses of the dynamic processes of micro-sized individual aerosol particles and has unexplored potential in characterizing 5
aerosol hygroscopic behavior. The concentration dependence of spontaneous Raman scattering allows the quantitative analysis of the water content of liquid droplets (Reid et al., 2007), at the same time, peak position of the anion Raman band is a sensitive indicator of the chemical structure of particles and hence phase transition (Widmann et al., 1998; Musick et al., 2000). Moreover, morphological changes can also be ob-10
served with microscope equipped to Raman spectrometer. It should be noted that micro-Raman spectrometry was combined with EDB in Tang and Fung’s (1997) study of Ca(NO3)2particles, but has been used mainly to study ion associations and
hydro-gen bonds in concentrated solution, rather than to characterize phase transition and hygroscopic growth.
15
We used micro-Raman spectrometry as a standalone technique to investigate the hy-groscopic behavior of micro-sized particles deposited on fluorinated ethylene propylene (FEP) substrate. Both pure Ca(NO3)2particles and internally mixed Ca(NO3)2/CaCO3
particles were studied. The particle water content was quantified using the intensity ratio of the water band to the solute band, and new spectroscopic evidences related 20
to structural changes were provided for phase transition and phase determination. We present the hygroscopic behavior measurements and compare them with those of pre-vious studies and bulk thermodynamic predictions.
ACPD
8, 10597–10625, 2008 Hygroscopic properties of Ca(NO3)2particles by Raman spectra Y. J. Liu et al. Title Page Abstract Introduction Conclusions References Tables Figures ◭ ◮ ◭ ◮ Back CloseFull Screen / Esc
Printer-friendly Version Interactive Discussion
2 Experimental
2.1 Apparatus and procedures
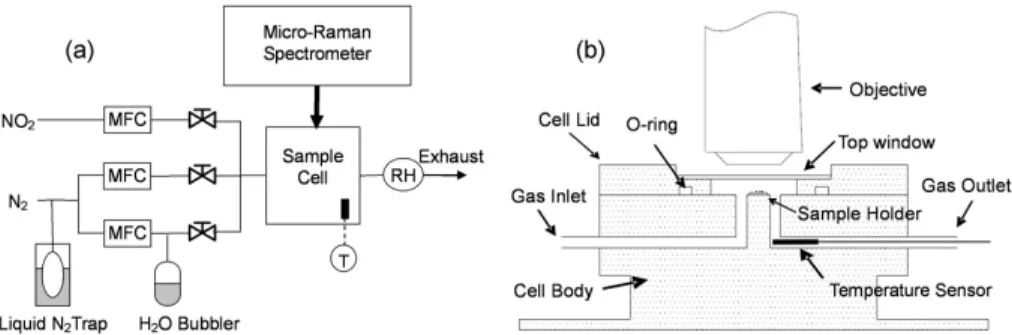
The experimental setup and sample cell are illustrated in Fig. 1. The sample cell was designed with reference to the reaction cell used to study the heterogeneous reactions of individual particles by Raman spectrometry (Chen et al., 2005) and the flow cell used 5
to study the deliquescence of organic acid particles by optical microscopy (Parsons et al., 2004). The lid and body of the cell were constructed of stainless steel. A piece of round cover glass (25 mm in diameter, 0.15 mm thick) was used as the top window and was sealed to the cell lid with high vacuum grease. The cell lid was sealed to the cell body using a fluororubber O-ring. Substrate carrying individual particles was fixed on 10
the sample holder.
An ideal substrate for the characterization of individual aerosol particles by micro-Raman spectrometry was considered to have a flat stable surface, lack of micro-Raman re-sponse, tolerance for high laser densities, and ease of particle recognition (Godoi et al., 2006). For the investigation of particle hygroscopic behavior, the substrate should 15
also be strongly hydrophobic so that heterogeneous nucleation of the droplets on the substrate can be suppressed. Thus, we used 0.1 mm thick Teflon® FEP film (DuPont) as the substrate. Its strengths include: (1) high chemical inertness and stability to laser radiation; (2) strong hydrophobic properties and a very flat surface after anneal-ing; (3) relatively low Raman signals, no overlap with the strong v1-NO−3 band and the
20
OH stretching vibration envelope; (4) many sharp Raman lines providing good inter-nal standards for the spectra calibration of aerosol particles; and (5) high contrast to particles on it as a substrate, thus facilitating microscopic observation. Of course, the FEP film has some limitations: its v1(CF2) band at 734 cm−1 overlaps with some weak bands of salts of interest such as v4-NO−3, which is sensitive to contact ion pairs in
25
supersaturated droplets.
ACPD
8, 10597–10625, 2008 Hygroscopic properties of Ca(NO3)2particles by Raman spectra Y. J. Liu et al. Title Page Abstract Introduction Conclusions References Tables Figures ◭ ◮ ◭ ◮ Back CloseFull Screen / Esc
Printer-friendly Version Interactive Discussion
with reference to the method of Parsons et al. (2004). The annealing process can significantly reduce the number of defects on the surface of the FEP film.
The relative humidity in the cell was regulated by the continuous flow of a mixture of dry and humidified N2. Ultra-high-purity nitrogen (99.999%, Beijing Huilong Changhai)
was first passed through a liquid N2 trap to remove impurities such as hydrocarbons 5
and water vapor and was then split into two streams; one stream was humidified by bubbling through deionized water (18.2 MΩ·cm, Milli-Q, Millipore) and was then mixed with the other stream. The relative humidity in the sample cell was varied by adjusting the ratio of the flow rates of dry and humidified N2 using mass flow controllers while
maintaining a total flow rate of 200 ml/min. Internally mixed Ca(NO3)2/CaCO3particles
10
was prepared by exposing individual CaCO3 particles to NO2/H2O/N2 mixture, which was generated by adding the third stream of NO2(2000 ppm; Messer) at a controlled
flow rate. The relative humidity and temperature of the outflow from the sample cell were measured using a hygrometer (HMT 100; Vaisala) that had a measurement accu-racy of ±1.7% RH and ±0.2◦C. Because a temperature difference between the humidity 15
sensor and the zone of interest will cause considerable error in RH measurement, the sample cell was equipped with another small temperature sensor (Pt 100, 1/3 DIN B; Heraeus) that had an accuracy of ±0.2◦C. The distance from the temperature sensor to the substrate was <10 mm; thus, it was safe to take the measured value as the local temperature over the substrate. Because the absolute humidity of the gas stream was 20
constant at equilibrium, the local RH over the substrate could be calculated using the known local temperature, outflow RH, and outflow temperature.
A commercially available micro-Raman spectrometer (LabRam HR 800; Horiba Jobin Yvon) was used. This spectrometer is equipped with a microscope (Olympus BX40), a motorized x, y-stage, and a charge-coupled device (CCD) detector. The sam-25
ple cell was mounted on the x, y-stage. The excitation source was an argon ion laser (Spectra Physics) operating at 514.5 nm with an output power of 25 mW. A 50×NA0.5 long working distance objective was used. The excitation laser was focused through the top window of the sample cell onto the particle of interest. The backscattering
sig-ACPD
8, 10597–10625, 2008 Hygroscopic properties of Ca(NO3)2particles by Raman spectra Y. J. Liu et al. Title Page Abstract Introduction Conclusions References Tables Figures ◭ ◮ ◭ ◮ Back CloseFull Screen / Esc
Printer-friendly Version Interactive Discussion
nal, after passing through 600 g/mm grating, was detected by the CCD. Raman spectra in the range of 100–4000 cm−1 were obtained using an exposure time of 10 s. The microscopic images of the particle of interest were also recorded to observe phase transition and morphological change. For NO2-treated CaCO3particles, Raman spec-trum were collected over a 12 µm×12 µm area using a step of 2 µm and an exposure 5
time of 5 s. The intensity of Raman bands at ∼1050 cm−1 (v1-NO−3) and ∼1085 cm −1
(v1-CO2−3 ) were mapped to investigate the relative amount of each component.
The (NH4)2SO4(99.999%; Alfa Aesar), Ca(NO3)2·4H2O (ACS, 99–103%; Riedel-de
Ha ¨en), and CaCO3 (99.999%; Alfa Aesar) were used without further purification. All
of the salts were ground and then dispersed on the substrate. Three to six individual 10
particles with diameters of 5–10 µm were selected for investigation in each experi-ment. During a typical experiment, the relative humidity was increased or decreased in steps of 1–20% RH. Smaller steps were used around phase transition points. Pre-experiments with different equilibrium times were performed to ensure that the particles could achieve the equilibrium state at each RH. All of the measurements were made at 15
ambient temperatures of 25±0.5◦C.
2.2 Quantification of particle water content
The concentration dependence of spontaneous Raman scattering allows the quanti-tative analysis of the water content of liquid droplets (Reid et al., 2007). Jordanov and Zellner (2006) attempted to quantify the RH dependence of water content in levi-20
tated (NH4)2SO4 particles with Raman spectroscopy, but were unsuccessful because of strong band distortion of NH+4 and H2O caused by the morphology-dependent
res-onances of spherical droplets. In contrast, the disturbance of morphology-dependent resonances was successfully excluded from our experiment by depositing particles on the substrate, rather than levitating them.
25
We quantified the water content of Ca(NO3)2 droplets using the ratio of the
inte-grated intensity of the H2O stretching envelope (2900–3800 cm−1) to that of v 1-NO−3
ACPD
8, 10597–10625, 2008 Hygroscopic properties of Ca(NO3)2particles by Raman spectra Y. J. Liu et al. Title Page Abstract Introduction Conclusions References Tables Figures ◭ ◮ ◭ ◮ Back CloseFull Screen / Esc
Printer-friendly Version Interactive Discussion
over 1010–1090 cm−1. For (NH4)2SO4 droplets, the stretching envelope of NH+4
over-lapped with that of H2O; hence, the total intensities of these two envelopes were
inte-grated at first, then the water content of (NH4)2SO4droplets can be calculated accord-ing to: INH,OH ISulfate = A · nH2O+ B · nNH+4 C · nSO2− 4 = A C· nH 2O nSO2− 4 +2B C (1) 5
where INH,OH is the integrated intensity of the NH and OH stretching envelope over 2680–3780 cm−1; ISulfate is the integrated intensity of v1-SO2−4 over 940–1020 cm
−1; nH
2O, nNH+4, and nSO2−4 are the molecular numbers of H2O, NH +
4, and SO2−4 in the
solu-tion, respectively; and A, B, and C are constants.
A series of bulk solutions reaching the saturation point of each salt were prepared for 10
calibration. Because the Ca(NO3)2 solution can readily supersaturate even in the bulk
phase (Stokes and Robinson, 1948), a supersaturated Ca(NO3)2 bulk solution with a 4:1 molar ratio of H2O: solute was prepared by cooling the melted Ca(NO3)2·4H2O
crystals. The calibration curves of Ca(NO3)2and (NH4)2SO4were extrapolated linearly
to supersaturated concentrations (Appendix A). 15
2.3 Raman spectra treatment
The obtained Raman spectra were analyzed using Labspec 5 software. The v1
-SO2−4 Raman band centered at ∼978 cm−1 and the v1-NO−3 Raman band centered at
∼1055 cm−1were fit to the Gaussian-Lorentz function to obtain precise values of peak position and full width at half-maximum (FWHM). CF2 bend vibration of the FEP sub-20
strate at 383 cm−1(Hannon et al., 1969) was also fit and taken as an internal calibrator of peak position.
ACPD
8, 10597–10625, 2008 Hygroscopic properties of Ca(NO3)2particles by Raman spectra Y. J. Liu et al. Title Page Abstract Introduction Conclusions References Tables Figures ◭ ◮ ◭ ◮ Back CloseFull Screen / Esc
Printer-friendly Version Interactive Discussion
3 Results
3.1 Hygroscopic properties of (NH4)2SO4particles
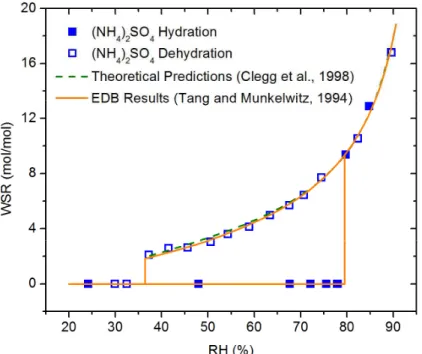
The hygroscopic properties of (NH4)2SO4have been studied extensively and are well understood. To evaluate the performance of our experimental apparatus and approach, we first studied (NH4)2SO4particles. Figure 2 shows the RH dependence of the water
5
content of (NH4)2SO4 in hydration and dehydration processes. The quantified water-to-solute molar ratio (WSR) of (NH4)2SO4 droplets showed excellent agreement with
that measured by Tang and Munkelwitz (1994) using EDB and that predicted from thermodynamics (Clegg et al., 1998). Deliquescence and efflorescence transitions were observed at 80% RH and 37–41% RH, respectively, in good agreement with 10
previous studies (Martin, 2000).
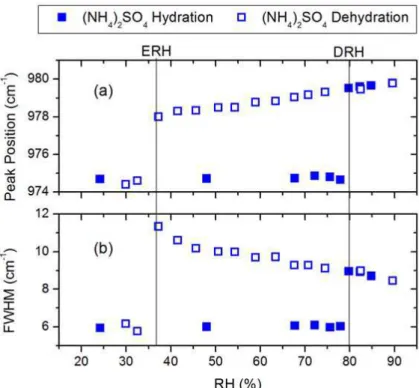
Figure 3 shows the changes in (a) peak position and (b) FWHM of v1-SO2−4 band in dehydration and hydration processes. In the dehydration process, there was only a slight red shift and broadening of v1-SO2−4 until 37% RH, at which point v1-SO2−4 shifted
sharply from 978 cm−1 to 975 cm−1, and its FWHM suddenly decreased from 11 cm−1 15
to 6 cm−1, corresponding to the efflorescence transition. In the hydrating process, an abrupt blue shift and broadening of the v1-SO2−4 band were evident at 80% RH, cor-responding to the deliquescence transition. The concurrence of phase transitions and distinct changes in the peak position and FWHM of v1-SO2−4 at the same RH indicate
that the phase transition can also be identified from the sharp shift of peak position 20
and FWHM of the anion band using Raman spectra. Apparently, the sharp shift of peak position and the sudden change in FWHM of Raman spectra provide a very clear identification of the phase transition.
3.2 The hygroscopic properties of Ca(NO3)2particles
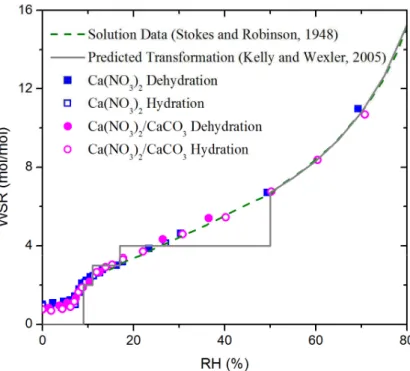
Figure 4 shows the WSR of Ca(NO3)2 particles and Ca(NO3)2/CaCO3 particles as
25
ACPD
8, 10597–10625, 2008 Hygroscopic properties of Ca(NO3)2particles by Raman spectra Y. J. Liu et al. Title Page Abstract Introduction Conclusions References Tables Figures ◭ ◮ ◭ ◮ Back CloseFull Screen / Esc
Printer-friendly Version Interactive Discussion
the Ca(NO3)2droplets evaporated following the predicted curve derived from isopiestic measurements with bulk solution (Stokes and Robinson, 1948) above 11% RH. Greater decreases in WSR were observed when RH was decreased from 11% to 7%. Below 7% RH, the WSR was stable at ∼1 without further significant changes. It indicated that efflorescence occurred at 11–7% RH. Nevertheless, calcium nitrate particles have 5
very low water content under conditions of low humidity and hence low signal-to-noise ratio of the water envelope in Raman spectra. In addition, the calibration curve is extrapolated to high concentration. Thus, the sensitivity and accuracy of the calculated WSR under conditions of low humidity are limited. Therefore, it is not possible to conclude whether a phase transition occurs based solely on changes in water content. 10
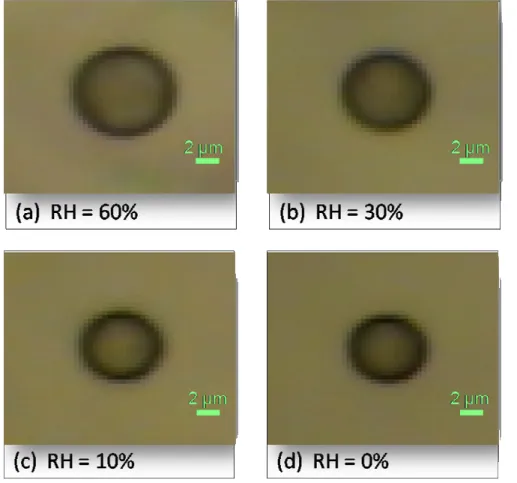
Figure 5 presents microscopic images of a typical calcium nitrate particle in dehy-dration process. As shown in Fig. 5, the Ca(NO3)2droplets changed in size with
de-creasing RH, but kept spherical shape during the whole dehydration process, even at a RH near to zero. No crystallization was observed, this could be due to the reason that efflorescence was not occurred and Ca(NO3)2 particles were in a state of highly
15
supersaturated solutions at RH lower than 7%; or a phase transition occurs, e.g. the Ca(NO3)2droplets had transformed to amorphous solid particles, which have a spher-ical shape as the supersaturated Ca(NO3)2droplets.
To find out what happened to Ca(NO3)2droplets during the dehydration process,
es-pecially at RH lower that of the likely efflorescence point, we investigated the changes 20
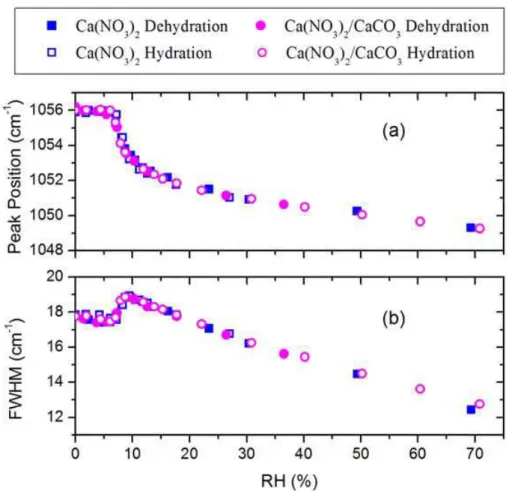
in position and FWHM of the v1-NO−3 band in the dehydration process (Fig. 6), because
the symmetric stretching vibration band v1-NO−3 is sensitive to structural changes in
ni-trate solution (Frost and James, 1982; James et al., 1982; Koussinsa and Bertin, 1991). As shown in Fig. 6, there are two transition points in both the curves of peak position vs. RH and that of FWHM vs. RH, i.e. 10% RH and 7% RH. Above 10% RH, v1-NO−3
25
gradually became broader with decreasing RH and shifted to a higher frequency, from 1049 cm−1 at 70% RH to 1053 cm−1 at 10% RH. From 10% RH to 7% RH, v1-NO−3
showed a much more marked shift to a higher frequency, from 1053 cm−1to 1056 cm−1. At the same time, its FWHM showed a slight reduction instead of increasing further.
ACPD
8, 10597–10625, 2008 Hygroscopic properties of Ca(NO3)2particles by Raman spectra Y. J. Liu et al. Title Page Abstract Introduction Conclusions References Tables Figures ◭ ◮ ◭ ◮ Back CloseFull Screen / Esc
Printer-friendly Version Interactive Discussion
Below 7% RH, both the position and FWHM of the v1-NO−3 band remained unchanged.
Concomitant with WSR evolution in the dehydration process, the jump in the v1-NO− 3
band position and FWHM at 10–7% RH and lack of further changes below 7% RH provided strong evidence that a different phase occurred below 7% RH and that the transition from solution to this phase occurred at 10–7% RH.
5
According to band component analysis (Koussinsa and Bertin, 1991), four solvated species were resolved in the v1-NO−3 of Ca(NO3)2 solution and assigned as free
aquated ions NO−3(aq) at 1047.6 cm−1, solvent-separated ion pairs NO−3·H2O·Ca2+ at
1050 cm−1, contact ion pairs NO− 3·Ca
2+at 1053 cm−1, and ion aggregates (NO− 3·Ca
2+) x
at 1055 cm−1. The gradual blue shift of v1-NO−3 from 1049 cm
−1 at 70% RH to
10
1053 cm−1 at 10% RH (Fig. 6a) corresponds to an increasing proportion of more or-dered species such as contact ion pairs and ion aggregates in supersaturated solu-tions. Because the most ordered species (NO−
3·Ca 2+ )
xin calcium nitrate solution
ap-peared at 1055 cm−1, whereas that of anhydrate nitrate appeared at 1067 cm−1 (Tang and Fung, 1997), the band maximized at 1056 cm−1 below 7% RH is indicative of a 15
phase between these species. In addition, the narrower band width below 10% RH is an indication of nitrate ions with more fixed orientations in microenvironments than in corresponding supersaturated solution (Zhang et al., 2004). Based on the Raman spectroscopic analysis and the microscopic observation of morphology, we are confi-dent that during the dehydration process, Ca(NO3)2droplets had transformed to
amor-20
phous hydrate particles at 10–7% RH.
In the hydration process, the amorphous Ca(NO3)2remained unchanged until ∼7% RH, at which point its water content began to increase and the v1-NO−3 shifted to a
lower frequency with increasing FWHM. Above 10% RH, both the growth of the WSR and the red shift of thev1-NO−
3 slowed down, and remarkably, the FWHM of the v1
-25
NO−3 begin to decrease. These observations indicate that deliquescence of amorphous Ca(NO3)2 began at ∼7% RH and transformed to solution droplets above 10% RH.
ACPD
8, 10597–10625, 2008 Hygroscopic properties of Ca(NO3)2particles by Raman spectra Y. J. Liu et al. Title Page Abstract Introduction Conclusions References Tables Figures ◭ ◮ ◭ ◮ Back CloseFull Screen / Esc
Printer-friendly Version Interactive Discussion
of v1-NO−3 vs. RH (Fig. 6) in the hydration process showed excellent agreement to
those in the dehydration process, indicating that the deliquescence and efflorescence of amorphous calcium nitrate are reversible processes.
3.3 Hygroscopic properties of internally mixed Ca(NO3)2/CaCO3particles
Although field results of completely processed CaCO3 particles have been reported,
5
Ca(NO3)2and carbonate mineral components are internally mixed in most cases (Ma-mane and Gottlieb, 1992; Ro et al., 2002, 2005; Shi et al., 2008). To understand the hygroscopic properties of Ca(NO3)2-containing mineral dust particles, internally mixed
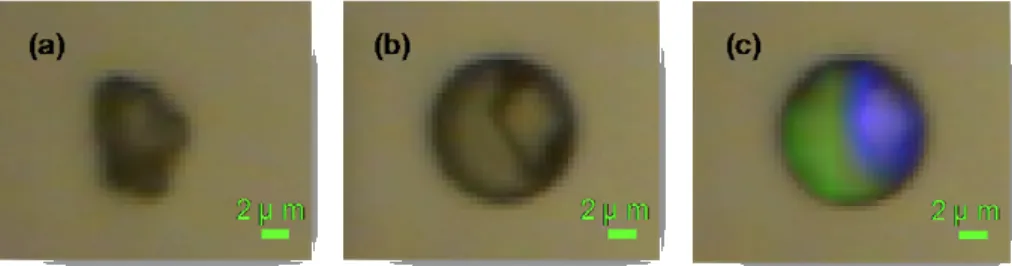
Ca(NO3)2/CaCO3 particles were prepared by exposing individual CaCO3 particles to the NO2/H2O/N2 mixture, and their hygroscopic behavior was studied. The CaCO3
10
particle was present in irregular crystalline form before the exposure to NO2/H2O/N2
mixture (Fig. 7a). The reacted CaCO3 particle clearly increased in size and become round, with two distinctly different parts (Fig. 7b). Raman mapping results further con-firmed that this was a Ca(NO3)2 solution shell surrounding a CaCO3 crystalline core
(Fig. 7c). 15
Changes in the water content of the internally mixed Ca(NO3)2/CaCO3 particles in
hydration and dehydration processes are presented in Fig. 4. The particle water con-tent was quantified using a method identical to that used for pure Ca(NO3)2particles, denoted as the water-to-Ca(NO3)2molar ratio. The corresponding evolution of v1-NO−3
band position and FWHM is also illustrated in Fig. 6a and b. From Figs. 4 and 6, we 20
can easily see that the internally mixed Ca(NO3)2/CaCO3particles exhibit hygroscopic behavior identical to that of pure Ca(NO3)2particles in both hydration and dehydration
processes. Their Ca(NO3)2shell is in the amorphous hydrate state below 7% RH, and
both deliquescence and efflorescence transition occur at 7–10% RH. Once in solution, the particles grow and evaporate following the curve derived from isopiestic measure-25
ments with bulk solution of calcium nitrate. In conclusion, the hygroscopic behavior of internally mixed Ca(NO3)2/CaCO3 particles is determined by the Ca(NO3)2. The
ACPD
8, 10597–10625, 2008 Hygroscopic properties of Ca(NO3)2particles by Raman spectra Y. J. Liu et al. Title Page Abstract Introduction Conclusions References Tables Figures ◭ ◮ ◭ ◮ Back CloseFull Screen / Esc
Printer-friendly Version Interactive Discussion
dependence of the particle water content.
4 Discussion
Compared with EDB, ESEM, and TDMA, micro-Raman spectrometry provides more than one way to investigate the hygroscopic behavior of calcium nitrate particles. The water content can be quantified by the relative intensity of Raman bands, the morpho-5
logical changes can be observed with microscope equipped to Raman spectrometer, and at the same time, the v1-NO−3 band position and FWHM are sensitive to structural changes. Although the RH dependence of particle water content and morphological changes are expressions of hygroscopic properties, chemical structural changes are actually the determining factor. This factor is complementary and can help to gain a 10
more complete understanding of the hygroscopic process. As described in Sect. 3, ev-idence of a phase transition was found in the curve of water content vs. RH and, more importantly and obviously, in the curve of the v1-NO−3 band position and width vs. RH.
Moreover, based on the results of the v1-NO−
3 band analysis, we can confirm with high
confidence that the new phase is an amorphous solid. 15
Raman spectrometry is a promising technique for quantifying the water content of droplets that have insoluble inclusions. The most commonly used techniques to mea-sure particle water content are EDB and TDMA, which meamea-sure the total mass and size of particles, respectively. However, if insoluble inclusions are present in a droplet, the water content or concentration of the droplet cannot be determined by EDB or 20
TDMA if the precise mass or size of the inclusion is unknown. In contrast, the pres-ence of inclusions will not affect the quantification of droplet concentration with Raman spectrometry because the water content is determined directly using the relative inten-sity of the solute Raman band to water Raman band. In the case of internally mixed Ca(NO3)2/CaCO3particles, the WSR was quantified accurately even when the ratio of
25
Ca(NO3)2to CaCO3was unknown. In the atmosphere, soluble salts or organic compo-nents are often internally mixed with insoluble soot or mineral compocompo-nents (Posfai et al.,
ACPD
8, 10597–10625, 2008 Hygroscopic properties of Ca(NO3)2particles by Raman spectra Y. J. Liu et al. Title Page Abstract Introduction Conclusions References Tables Figures ◭ ◮ ◭ ◮ Back CloseFull Screen / Esc
Printer-friendly Version Interactive Discussion
1999; Vogt et al., 2003; Ro et al., 2002, 2005). Our knowledge of the physicochemical properties of these complicated aerosol particles is far from complete. Raman spec-trometry may be a very useful tool with which to investigate the hygroscopic behaviors of these complicated aerosol particles.
The deliquescence process of amorphous Ca(NO3)2 particles demonstrated here
5
can explain the morphological changes observed by ESEM (Laskin et al., 2005b) and agree with the deliquescence transition point identified by TDMA (Gibson et al., 2006). However, our findings differ from those obtained by EDB (Tang and Fung, 1997), which showed a higher deliquescence RH of ∼13% RH. The EDB results also indicated a dif-ferent dehydration process that Ca(NO3)2droplets continued to lose water upon system 10
evacuation until in vacuum (0% RH) they turned into amorphous solid particles with a WSR of 1:1. In contrast, in our study the changes in water content and in v1-NO−3 band
position and FWHM both indicated that the efflorescence transition occurred at 10–7% RH. Although there have been no other reports regarding the calcium nitrate dehydra-tion process, Gibson et al. (2006) prepared amorphous calcium nitrate for hydradehydra-tion 15
experiments by evaporating droplets in a diffusion dryer in which the RH can be re-duced to only several percent; their findings support our observation that efflorescence occurs above 0% RH.
The disagreement between our results and those reported by Tang and Fung (1997) may have been because of the different equilibrium time used. The gas transport 20
in very viscous particles can hinder gas–particle equilibrium. For example, Chan et al. (2000) reported significant retardation of the water evaporation rate of highly con-centrated Mg(SO4)2 droplets. We performed pre-experiments to ensure that equilib-rium could be reached at each RH. It took approximately 15 min for a Ca(NO3)2
parti-cle with several micrometers in diameter to attain an equilibrium state at 7–10% RH. 25
However, the equilibrium time that is normally used in hygroscopic experiments is on the order of a few seconds (Chan and Chan, 2005), which is too short for sufficient mass transfer for viscous supersaturated Ca(NO3)2droplets. The equilibrium time was
ACPD
8, 10597–10625, 2008 Hygroscopic properties of Ca(NO3)2particles by Raman spectra Y. J. Liu et al. Title Page Abstract Introduction Conclusions References Tables Figures ◭ ◮ ◭ ◮ Back CloseFull Screen / Esc
Printer-friendly Version Interactive Discussion
in their experiment, the observed RHs of efflorescence and deliquescence would have been underestimated and overestimated, respectively.
Crystallographic studies indicate that anhydrate calcium nitrate and its di-, tri-, and tetrahydrates occur as solid phases (Frazier et al., 1964). The corresponding stable form in different ranges of RH has been predicted by bulk thermodynamics (Kelly and 5
Wexler, 2005). The tetrahydrate is expected to be in the solid phase in equilibrium with the Ca(NO3)2saturated solution with a transition point at 50% RH (Fig. 4). Solid–solid
phase transitions are expected below 50% RH, including transformation from tetrahy-drate to trihytetrahy-drate at 17% RH, from trihytetrahy-drate to dehytetrahy-drate at 11% RH, and from dehy-drate to anhydehy-drate at 9% RH. However, instead of transforming into the tetrahydehy-drate at 10
50% RH as expected, Ca(NO3)2droplets continuously lost water until they were highly supersaturated at 10% RH, after which they began to convert to a solid metastable phase, i.e. amorphous hydrate, which was not predicted by bulk thermodynamics. Hys-teresis of efflorescence is very common for microparticles and is usually explained by the absence of heterogeneous nucleation (Martin, 2000). However, kinetic limitations 15
cannot explain the hygroscopic behavoir of Ca(NO3)2 particles completely. As shown
in Sect. 3, the internally mixed Ca(NO3)2/CaCO3particles effloresce at the same rel-ative humidity as pure Ca(NO3)2 particles, although there are large CaCO3 nuclei in
these particles that can invariably induce heterogeneous nucleation. Further investiga-tions are required to determine why the calcium nitrate solution shell on dust particles 20
does not transform to its stable tetrahydrate. Nevertheless, these observations indicate the very different behavior and mechanism of phase transition in microparticles than those in bulk samples. In another word, it is inappropriate to infer the phase transition behavior of Ca(NO3)2microparticles from their bulk properties.
In fact, in addition to the very different properties of calcium nitrate particles as com-25
pared with bulk samples, Tang et al. (1995) also reported discrepancies between mi-croparticle hygroscopic behavior and bulk thermodynamic predictions for some other salts. The role of atmospheric aerosol particles, therefore, cannot always be assessed solely based on bulk properties. Care should be taken when using bulk thermodynamic
ACPD
8, 10597–10625, 2008 Hygroscopic properties of Ca(NO3)2particles by Raman spectra Y. J. Liu et al. Title Page Abstract Introduction Conclusions References Tables Figures ◭ ◮ ◭ ◮ Back CloseFull Screen / Esc
Printer-friendly Version Interactive Discussion
calculations to infer aerosol properties; some experiments for the study of aerosol prop-erties using bulk samples may lead to erroneous results.
5 Conclusions and atmospheric implications
Our results indicate that the micro-Raman technique is a powerful tool with which to investigate the hygroscopic behavior of individual Ca(NO3)2 and internally mixed
5
Ca(NO3)2/CaCO3particles. The RH dependence of the water content was quantified
accurately for Ca(NO3)2 particles with and without CaCO3 inclusion. Significant new spectroscopic evidence related to chemical structure was provided to identify phase transitions and to determine phases. Thus, the hygroscopic behavior of Ca(NO3)2
par-ticles was characterized in more detail and more reliably than had been possible pre-10
viously, and the hygroscopic properties of internally mixed Ca(NO3)2/CaCO3 particles were investigated systematically for the first time.
The deliquescence and efflorescence of individual Ca(NO3)2 particles were
re-versible processes. The Ca(NO3)2particles were in the form of solution droplets above 10% RH and amorphous hydrates below 7% RH; phase transitions occurred between 15
7–10% RH. The hygroscopic behavior of internally mixed Ca(NO3)2/CaCO3 particles
was fully controlled by the Ca(NO3)2 and was identical to that of pure Ca(NO3)2 parti-cles. That is, the slightly soluble CaCO3core has a negligible effect on phase transition
and the RH dependence of the particle water content.
Typical ambient relative humidity is in the range of 20–90%; thus, calcium nitrate par-20
ticles or calcium nitrate products on mineral dust particles are usually in the solution state in the atmosphere, whereas the original mineral particles are normally insolu-ble. The formation of calcium nitrate on dust particles can therefore markedly change its water content and hygroscopic properties. Its impact on radiation and climate has been discussed extensively (Vlasenko et al., 2006; Prince et al., 2007; Gibson et al., 25
2006). Here, we would like to emphasis its effect on the reactivity of mineral dust. The strong hygroscopic properties of calcium nitrate product make the heterogeneous
re-ACPD
8, 10597–10625, 2008 Hygroscopic properties of Ca(NO3)2particles by Raman spectra Y. J. Liu et al. Title Page Abstract Introduction Conclusions References Tables Figures ◭ ◮ ◭ ◮ Back CloseFull Screen / Esc
Printer-friendly Version Interactive Discussion
actions of mineral dust with reactive nitrogen species unlimited to the particle surface. This was supported by the results of laboratory and field studies of completely pro-cessed calcium carbonate dust particles (Laskin et al., 2005a; Krueger et al., 2003). Once a calcium nitrate solution film has formed, the interface where the heterogeneous reaction takes place will change from gas–solid to gas–solution–solid. Consequently, 5
the reaction mechanism will be completely different, and mass transfer in the solution layer should also be considered.
Appendix A
Calibration curves of (NH4)2SO4and Ca(NO3)2
10
See Fig. A1.
Acknowledgements. This work was supported by the National Basic Research Priorities
Pro-gram (Grant No. 2002CB410802) and National Natural Science Foundation of China (Grant No. 40490265).
References
15
Chan, C. K., Choi, M. Y., and Zhang, Y.: Observation of mass transfer limitation in evaporation of single levitated droplets, J. Aerosol Sci., 31, 989–990, 2000.
Chan, M. N. and Chan, C. K.: Mass transfer effects in hygroscopic measurements of aerosol particles, Atmos. Chem. Phys., 5, 2703–2712, 2005,
http://www.atmos-chem-phys.net/5/2703/2005/.
20
Chen, Q., Zhu, T., Li, H., Ding, J., and Li, Y.: In-situ investigation of the heterogeneous reactions on atmospheric particles by micro-Raman spectrometry, Prog. Nat. Sci., 15, 1518–1522, 2005.
Clegg, S. L., Brimblecombe, P., and Wexler, A. S.: Thermodynamic model of the system H+-NH+4-SO2−4 -NO−3-H2O at tropospheric temperatures, J. Phys. Chem. A, 102, 2137–2154,
25
ACPD
8, 10597–10625, 2008 Hygroscopic properties of Ca(NO3)2particles by Raman spectra Y. J. Liu et al. Title Page Abstract Introduction Conclusions References Tables Figures ◭ ◮ ◭ ◮ Back CloseFull Screen / Esc
Printer-friendly Version Interactive Discussion
Dentener, F. J., Carmichael, G. R., Zhang, Y., Lelieveld, J., and Crutzen, P. J.: Role of min-eral aerosol as a reactive surface in the global troposphere, J. Geophys. Res. Atmos., 101, 22 869–22 889, 1996.
Frazier, A. W., Mullins, R. C., and Smith, J. P.: Fertilizer Materials, Crystallography of Hydrates of Calcium Nitrate, J. Agric. Food Chem., 12, 478–479, 1964.
5
Frost, R. L. and James, D. W.: Ion Ion Solvent Interactions in Solution .3. Aqueous-Solutions of Sodium-Nitrate, J. Chem. Soc., Faraday Trans. 1, 78, 3223–3234, 1982.
Gibson, E. R., Hudson, P. K., and Grassian, V. H.: Physicochemical properties of nitrate aerosols: Implications for the atmosphere, J. Phys. Chem. A, 110, 11 785–11 799, 2006. Godoi, R. H. M., Potgieter-Vermaak, S., De Hoog, J., Kaegi, R., and Grieken, R.: Substrate
10
selection for optimum qualitative and quantitative single atmospheric particles analysis using nano-manipulation, sequential thin-window electron probe X-ray microanalysis and micro-Raman spectrometry, Spectrochim. Acta B Atom. Spectros., 61, 375–388, 2006.
Hannon, M. J., Boerio, F. J., and Koenig, J. L.: Vibrational Analysis of Polytetrafluoroethylene, J. Chem. Phys., 50, 2829–2836, 1969.
15
James, D. W., Carrick, M. T., and Frost, R. L.: Structure of Aqueous-Solutions – Fourier Trans-formation and Band Component Analysis in Magnesium-Nitrate Solutions, J. Raman Spec-trosc., 13, 115–119, 1982.
Jordanov, N. and Zellner, R.: Investigations of the hygroscopic properties of ammonium sulfate and mixed ammonium sulfate and glutaric acid micro droplets by means of optical levitation
20
and Raman spectroscopy, Phys. Chem. Chem. Phys., 8, 2759–2764, 2006.
Kelly, J. T. and Wexler, A. S.: Thermodynamics of carbonates and hydrates related to heterogeneous reactions involving mineral aerosol, J. Geophys. Res, 110, D11201, doi:10.1029/2004JD005583, 2005.
Koussinsa, F. and Bertin, F.: Raman Microspectrometric Study of the Dissolution Layer of
25
M(NO3)2. nH2O Crystals (M = Mg, Ca, Zn and Cd) in Their Undersaturated Aqueous-Solutions, J. Raman Spectrosc., 22, 169–176, 1991.
Krueger, B. J., Grassian, V. H., Laskin, A., and Cowin, J. P.: The transformation of solid atmo-spheric particles into liquid droplets through heterogeneous chemistry: Laboratory insights into the processing of calcium containing mineral dust aerosol in the troposphere, Geophys.
30
Res. Lett, 30, 1148, doi:10.1029/2002GL016563, 2003.
Krueger, B. J., Grassian, V. H., Cowin, J. P., and Laskin, A.: Heterogeneous chemistry of individual mineral dust particles from different dust source regions: the importance of particle
ACPD
8, 10597–10625, 2008 Hygroscopic properties of Ca(NO3)2particles by Raman spectra Y. J. Liu et al. Title Page Abstract Introduction Conclusions References Tables Figures ◭ ◮ ◭ ◮ Back CloseFull Screen / Esc
Printer-friendly Version Interactive Discussion
mineralogy, Atmos. Environ., 38, 6253–6261, 2004.
Laskin, A., Iedema, M. J., Ichkovich, A., Graber, E. R., Taraniuk, I., and Rudich, Y.: Direct observation of completely processed calcium carbonate dust particles, Faraday Discuss., 130, 453–468, 2005a.
Laskin, A., Wietsma, T. W., Krueger, B. J., and Grassian, V. H.: Heterogeneous chemistry
5
of individual mineral dust particles with nitric acid: A combined CCSEM/EDX, ESEM, and ICP-MS study, J. Geophys. Res. Atmos., 110, D10208, doi:10.1029/2004JD005206, 2005b. Lee, S. H., Murphy, D. M., Thomson, D. S., and Middlebrook, A. M.: Chemical components of
single particles measured with Particle Analysis by Laser Mass Spectrometry (PALMS) dur-ing the Atlanta SuperSite Project: Focus on organic/sulfate, lead, soot, and mineral particles,
10
J. Geophys. Res. Atmos., 107, 4003, doi:10.1029/2000JD000011, 2002.
Mamane, Y. and Gottlieb, J.: Nitrate Formation on Sea-Salt and Mineral Particles – a Single-Particle Approach, Atmos. Environ. Gen. Top., 26, 1763–1769, 1992.
Martin, S. T.: Phase transitions of aqueous atmospheric particles, Chem. Rev., 100, 3403– 3453, 2000.
15
Musick, J., Popp, J., and Kiefer, W.: Observation of a phase transition in an electrodynamically levitated NH4NO3 microparticle by Mie and Raman scattering, J. Raman Spectrosc., 31, 217–219, 2000.
Parsons, M. T., Mak, J., Lipetz, S. R., and Bertram, A. K.: Deliquescence of malonic, succinic, glutaric, and adipic acid particles, J. Geophys. Res. Atmos., 109, D06212,
20
doi:10.1029/2003JD004075, 2004.
Posfai, M., Anderson, J. R., Buseck, P. R., and Sievering, H.: Soot and sulfate aerosol particles in the remote marine troposphere, J. Geophys. Res. Atmos., 104, 21 685–21 693, 1999. Prince, A. P., Grassian, V. H., Kleiber, P., and Young, M. A.: Heterogeneous conversion of
calcite aerosol by nitric acid, Phys. Chem. Chem. Phys., 9, 622–634, 2007.
25
Reid, J. P., Meresman, H., Mitchem, L., and Symes, R.: Spectroscopic studies of the size and composition of single aerosol droplets, Int. Rev. Phys. Chem., 26, 139–192, 2007.
Ro, C. U., Kim, H., Oh, K. Y., Yea, S. K., Lee, C. B., Jang, M., and Grieken, R. V.: Single-particle characterization of urban aerosol Single-particles collected in three Korean cities using low-Z electron probe X-ray microanalysis, Environ. Sci. Technol., 36, 4770–4776, 2002.
30
Ro, C. U., Hwang, H., Chun, Y., and Van Grieken, R.: Single-particle characterization of four “Asian Dust” samples collected in Korea, using low-Z particle electron probe X-ray micro-analysis, Environ. Sci. Technol., 39, 1409–1419, 2005.
ACPD
8, 10597–10625, 2008 Hygroscopic properties of Ca(NO3)2particles by Raman spectra Y. J. Liu et al. Title Page Abstract Introduction Conclusions References Tables Figures ◭ ◮ ◭ ◮ Back CloseFull Screen / Esc
Printer-friendly Version Interactive Discussion
Seinfeld, J. H., Carmichael, G. R., Arimoto, R., Conant, W. C., Brechtel, F. J., Bates, T. S., Cahill, T. A., Clarke, A. D., Doherty, S. J., Flatau, P. J., Huebert, B. J., Kim, J., Markowicz, K. M., Quinn, P. K., Russell, L. M., Russell, P. B., Shimizu, A., Shinozuka, Y., Song, C. H., Tang, Y. H., Uno, I., Vogelmann, A. M., Weber, R. J., Woo, J. H., and Zhang, X. Y.: ACE-ASIA – Regional climatic and atmospheric chemical effects of Asian dust and pollution, B. Am.
5
Meteorol. Soc., 85, 367–380, 2004.
Shi, Z., Zhang, D., Hayashi, M., Ogata, H., Ji, H., and Fujiie, W.: Influences of sulfate and nitrate on the hygroscopic behaviour of coarse dust particles, Atmos. Environ., 42, 822–827, 2008.
Song, C. H. and Carmichael, G. R.: A three-dimensional modeling investigation of the evolution
10
processes of dust and sea-salt particles in east Asia, J. Geophys. Res. Atmos., 106, 18 131– 18 154, 2001.
Stokes, R. H. and Robinson, R. A.: Ionic Hydration and Activity in Electrolyte Solutions, J. Am. Chem. Soc., 70, 1870–1878, 1948.
Sullivan, R. C., Guazzotti, S. A., Sodeman, D. A., and Prather, K. A.: Direct observations of the
15
atmospheric processing of Asian mineral dust, Atmos. Chem. Phys., 7, 1213–1236, 2007,
http://www.atmos-chem-phys.net/7/1213/2007/.
Tang, I. N. and Munkelwitz, H. R.: Water activities, densities, and refractive indices of aque-ous sulfates and sodium nitrate droplets of atmospheric importance, J. Geophys. Res., 99, 18 801–18 808, 1994.
20
Tang, I. N., Fung, K. H., Imre, D. G., and Munkelwitz, H. R.: Phase-Transformation and Metasta-bility of Hygroscopic Microparticles, Aerosol Sci. Tech., 23, 443–453, 1995.
Tang, I. N. and Fung, K. H.: Hydration and Raman scattering studies of levitated microparticles: Ba(NO3)2, Sr(NO3)2, and Ca(NO3)2, J. Chem. Phys., 106, 1653–1660, 1997.
Tang, Y. H., Carmichael, G. R., Kurata, G., Uno, I., Weber, R. J., Song, C. H., Guttikunda, S. K.,
25
Woo, J. H., Streets, D. G., Wei, C., Clarke, A. D., Huebert, B., and Anderson, T. L.: Impacts of dust on regional tropospheric chemistry during the ACE-Asia experiment: A model study with observations, J. Geophys. Res. Atmos., 109, D19S21, doi:10.1029/2003JD003806, 2004. Tegen, I., Lacis, A. A., and Fung, I.: The influence on climate forcing of mineral aerosols from
disturbed soils, Nature, 380, 419–422, 1996.
30
Vlasenko, A., Sjogren, S., Weingartner, E., Stemmler, K., Gaggeler, H. W., and Ammann, M.: Effect of humidity on nitric acid uptake to mineral dust aerosol particles, Atmos. Chem. Phys., 6, 2147–2160, 2006,
ACPD
8, 10597–10625, 2008 Hygroscopic properties of Ca(NO3)2particles by Raman spectra Y. J. Liu et al. Title Page Abstract Introduction Conclusions References Tables Figures ◭ ◮ ◭ ◮ Back CloseFull Screen / Esc
Printer-friendly Version Interactive Discussion http://www.atmos-chem-phys.net/6/2147/2006/.
Vogt, R., Kirchner, U., Scheer, V., Hinz, K. P., Trimborn, A., and Spengler, B.: Identification of diesel exhaust particles at an Autobahn, urban and rural location using single-particle mass spectrometry, J. Aerosol Sci., 34, 319–337, 2003.
Widmann, J. F., Aardahl, C. L., and Davis, E. J.: Microparticle Raman spectroscopy, Trac-Trend.
5
Anal. Chem., 17, 339–345, 1998.
Zhang, Y. H., Choi, M. Y., and Chan, C. K.: Relating hygroscopic properties of magnesium nitrate to the formation of contact ion pairs, J. Phys. Chem. A, 108, 1712–1718, 2004.
ACPD
8, 10597–10625, 2008 Hygroscopic properties of Ca(NO3)2particles by Raman spectra Y. J. Liu et al. Title Page Abstract Introduction Conclusions References Tables Figures ◭ ◮ ◭ ◮ Back CloseFull Screen / Esc
Printer-friendly Version Interactive Discussion Fig. 1. Schematic diagram of the (a) experimental setup and (b) sample cell.
ACPD
8, 10597–10625, 2008 Hygroscopic properties of Ca(NO3)2particles by Raman spectra Y. J. Liu et al. Title Page Abstract Introduction Conclusions References Tables Figures ◭ ◮ ◭ ◮ Back CloseFull Screen / Esc
Printer-friendly Version Interactive Discussion
Fig. 2. Water-to-solute molar ratio (WSR) of (NH4)2SO4 particles as a function of relative
ACPD
8, 10597–10625, 2008 Hygroscopic properties of Ca(NO3)2particles by Raman spectra Y. J. Liu et al. Title Page Abstract Introduction Conclusions References Tables Figures ◭ ◮ ◭ ◮ Back CloseFull Screen / Esc
Printer-friendly Version Interactive Discussion
Fig. 3. The relative humidity (RH) dependence of (a) position and (b) full-width at half-maximum
ACPD
8, 10597–10625, 2008 Hygroscopic properties of Ca(NO3)2particles by Raman spectra Y. J. Liu et al. Title Page Abstract Introduction Conclusions References Tables Figures ◭ ◮ ◭ ◮ Back CloseFull Screen / Esc
Printer-friendly Version Interactive Discussion
Fig. 4. Water-to-solute molar ratio (WSR) of Ca(NO3)2 and Ca(NO3)2/CaCO3 particles as a
ACPD
8, 10597–10625, 2008 Hygroscopic properties of Ca(NO3)2particles by Raman spectra Y. J. Liu et al. Title Page Abstract Introduction Conclusions References Tables Figures ◭ ◮ ◭ ◮ Back CloseFull Screen / Esc
Printer-friendly Version Interactive Discussion
ACPD
8, 10597–10625, 2008 Hygroscopic properties of Ca(NO3)2particles by Raman spectra Y. J. Liu et al. Title Page Abstract Introduction Conclusions References Tables Figures ◭ ◮ ◭ ◮ Back CloseFull Screen / Esc
Printer-friendly Version Interactive Discussion
Fig. 6. Relative humidity (RH) dependence of (a) peak position and (b) full width at
half-maximum (FWHM) of the v1-NO−
3 band of Ca(NO3)2 and Ca(NO3)2/CaCO3particles in
ACPD
8, 10597–10625, 2008 Hygroscopic properties of Ca(NO3)2particles by Raman spectra Y. J. Liu et al. Title Page Abstract Introduction Conclusions References Tables Figures ◭ ◮ ◭ ◮ Back CloseFull Screen / Esc
Printer-friendly Version Interactive Discussion
Fig. 7. Microscopic images of a typical CaCO3 particle (a) before and (b) after exposure to
NO2 and (c) Raman mapping image after exposure to NO2. The green image represents the average intensity at 1020–1075 cm−1, corresponding to v
1-NO−3, whereas the blue image
represents the average intensity at 1075–1100 cm−1, corresponding to v
1-CO
2−
ACPD
8, 10597–10625, 2008 Hygroscopic properties of Ca(NO3)2particles by Raman spectra Y. J. Liu et al. Title Page Abstract Introduction Conclusions References Tables Figures ◭ ◮ ◭ ◮ Back CloseFull Screen / Esc
Printer-friendly Version Interactive Discussion
Fig. A1. Calibration curves for the water-to-solute molar ratio (WSR) of (NH4)2SO4 and
Ca(NO3)2 droplets. The solid line shows the linear fit of the experimental data; the broken line shows the extrapolation to supersaturated concentration.