HAL Id: hal-01714204
https://hal.inria.fr/hal-01714204
Submitted on 21 Feb 2018
HAL is a multi-disciplinary open access
archive for the deposit and dissemination of
sci-entific research documents, whether they are
pub-lished or not. The documents may come from
teaching and research institutions in France or
abroad, or from public or private research centers.
L’archive ouverte pluridisciplinaire HAL, est
destinée au dépôt et à la diffusion de documents
scientifiques de niveau recherche, publiés ou non,
émanant des établissements d’enseignement et de
recherche français ou étrangers, des laboratoires
publics ou privés.
Using High Frequency Accelerometer and Mouse to
Compensate for End-to-end Latency in Indirect
Interaction
Axel Antoine, Sylvain Malacria, Géry Casiez
To cite this version:
Axel Antoine, Sylvain Malacria, Géry Casiez.
Using High Frequency Accelerometer and Mouse
to Compensate for End-to-end Latency in Indirect Interaction. Proceedings of the ACM
Confer-ence on Human Factors in Computing Systems (CHI 2018), Apr 2018, Montréal, Canada. pp.1-11,
�10.1145/3173574.3174183�. �hal-01714204�
Using High Frequency Accelerometer and Mouse to
Compensate for End-to-end Latency in Indirect Interaction
Axel Antoine
1, Sylvain Malacria
2and Géry Casiez
1 1Université de Lille, France
2Inria, France
[email protected], [email protected], [email protected]
ABSTRACT
End-to-end latency corresponds to the temporal difference be-tween a user input and the corresponding output from a system. It has been shown to degrade user performance in both direct and indirect interaction. If it can be reduced to some extend, latency can also be compensated through software compensa-tion by trying to predict the future posicompensa-tion of the cursor based on previous positions, velocities and accelerations. In this paper, we propose a hybrid hardware and software prediction technique specifically designed for partially compensating end-to-end latency in indirect pointing. We combine a computer mouse with a high frequency accelerometer to predict the fu-ture location of the pointer using Euler based equations. Our prediction method results in more accurate prediction than pre-viously introduced prediction algorithms for direct touch. A controlled experiment also revealed that it can improve target acquisition time in pointing tasks.
ACM Classification Keywords
H.5.2User Interfaces: Input devices and strategies
Author Keywords
computer mouse; accelerometer; end-to-end latency; prediction; jitter; performance.
INTRODUCTION
Latency (or "lag") is defined as the temporal difference in a process between an input and the corresponding output. End-to-end latency is then defined as the total time required by a process, from the physical action of a user on an input device to the visual feedback on screen (i.e. sensing, transmission, system, applications, graphical computations and display re-fresh). This end-to-end latency can be split into hardware latency(on input side: sensing, transmission and on output side : display) and software latency (system, toolkits, frame-works and applications). End-to-end latency is still affecting most interactive systems [9, 27, 30], from desktop computers (where latency is between 50 and 90 ms [9]) to touch-based devices (typically, latency on touch-screens is between 60 and 200 ms [10, 30]). And while modern input controllers (e.g.
ACM ISBN . DOI:
gaming controllers) have negligible input latency, they do not completely overcome the end-to-end latency [9, 27, 33]. Research has shown that latency significantly impacts perfor-mance in pointing and dragging tasks [14, 17, 27, 31, 32] and that it can be perceived from as low as 5-10 ms on a touch device [30]. So far, several methods have been explored to re-duce or compensate for end-to-end latency. A first method is to control the entire graphical rendering pipeline to improve com-putation of each frame displayed, trying to include input visual feedback as soon as possible, which is hard to achieve with conventional GPU architecture and 3D engines [19]. Another method is to focus on the hardware part by building home-made input devices, handling systems and output devices. For example, Ng et al. designed a very low latency touchscreen of 1 ms [30], a delay also achieved in a homemade virtual reality system by Friston et al. [19]. However, this approach is expensive and can hardly be applied on current systems. An alternative is to try to use software compensation by try-ing to predict the future position ustry-ing Euler based equations, for example, to compensate hardware and software latencies. Those techniques generally base their prediction on previous positions, velocities and accelerations which are not hardware captured but obtained by derivatives. Few papers present the design of such predictors [13, 20, 25] for direct touch surfaces and how to evaluate them [29].
In this paper, we focus on a hybrid hardware and software compensationof end-to-end latency on desktop computers when operated using a computer-mouse, and we contribute a prediction technique specifically designed for indirect pointing. Our technique is based on the prediction of pointer position based on the velocity measured by the mouse and the accel-eration from an accelerometer embedded in the mouse. Our assumption is that the hardware acceleration measured by the accelerometer is more precise and less noisy than a computed one from the velocity, which is captured discretely by the optical sensor of the mouse controller. We designed our appli-cation to receive and merge raw informations from the mouse and accelerometer. The hardware acceleration and velocity measures together with the high frequency of inputs (both in-put devices run at 1 kHz) allow us to know every millisecond a full precise state of the hand motion (i.e. position, velocity and acceleration). There, using Euler based equations, it is possible to have a better estimation of the next position within a certain delay while reducing estimation errors and delays introduced by time derivative methods.
We will first detail the related work on the end-to-end latency measure and compensation and also discuss its negative effects on performance. We then describe how we designed our pro-totype and merged the information received from the mouse and accelerometer. Our prediction technique to estimate the current position of a mouse pointer is described before being compared to existing techniques. Last we detail the results of a controlled experiment to measure the performance of our technique under different amounts of artificial latency and different levels of latency compensation.
RELATED WORK
End-to-end latency explained
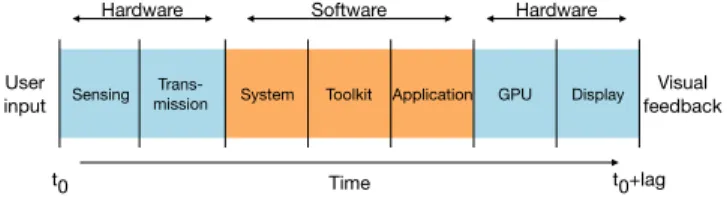
In an interactive system, both hardware (input sensing, com-munication and display) and software (system, toolkit and application) contribute to the end-to-end latency (Figure 1).
Sensing missionTrans- System Toolkit Application GPU Display
Time User
input
Visual feedback
Hardware Software Hardware
t0 t0+lag
Figure 1: Pipeline of information processing between a user input and the associated visual response displayed on screen.
Hardware input latency.On the input side, end-to-end latency can be impacted by the sampling rate of the input device. For example, computer mice have sampling rates ranging from 125 Hz to 1000 Hz for gaming mice, which may add 1 to 8 ms to the end-to-end latency [7]. Data transmission between the input device and the system also impacts latency. Pavlovych et al. [32] compared different end-to-end latencies for different connectivity and found 33.2 ± 2.8 ms using USB and 53.1 ± 3.32 ms using PS/2 port. A wireless mouse controller gave 102.9 ± 3.3 ms for the end-to-end latency of their system. Input latency varies even more on touch based devices, varying from 50 to 200ms depending on the hardware [10, 16, 30]. Software latency.End-to-end latency is also impacted by the way inputs are handled and processed at the system, toolkit and application level. Casiez et al. [9] compared end-to-end latencies on different systems, toolkits and applications and found a mean of 50.9 ± 7.6 ms for a Qt 5 application on Ubuntu 14.04 and 74.9 ± 9.2 ms for the same application on Windows 7. Regarding toolkits, they found 46.2 ± 5.3 ms for a C++/GLUT application, 62.0 ± 5.5 ms for Java / Swing and 65.4 ± 5.1 ms for C++ with Qt. These results show that the choice of toolkit and system is important for a responsive interface.
Hardware output latency.Finally, a significant portion of the end-to-end latency of an interactive system comes from GPU computations and display time [18, 27]. In addition, frame buffering and display refresh rate also strongly impact end-to-end latency. Typically, two frame buffers are generally used to store computed images to display. While the monitor displays one buffer, the GPU computes the next frame in the other, which implies that display events are queued in 2
buffers, which potentially adds, at 60 Hz, up to 33.4 ms to the delay [33].
Impact of the end-to-end latency on user experience
Perception of the latency
Deber et al. studied the minimal perceivable latency with indirect touch devices and found a JND of 55 ms for dragging and 96 ms for tapping tasks [15]. For direct interaction with a touchscreen, Ng et al. [30] found that users could reliably perceive end-to-end latency as low as 5-10 ms whereas Jota et al. found that below 20 ms, no participant was able to discern latency and below 40 ms, 85% of their participants were not able to notice improvements of latency [22].
Impact on performance
MacKenzie and Ware studied the effect of latency on pointing tasks on desktop computers [27]. They simulated several latencies (8.33, 25, 75 and 225 ms) to see the effect on user performance. They found that the impact of latency increases with the index of difficulty of the tasks (up to 6.02 bits) and identified that user performance drastically decreases from 75 ms of latency. Later, Pavlovych and Stuerzlinger [32] conducted a similar experiment with a different apparatus and target sizes, and found that performance decreased from 58 ms of latency. They also claimed that the smaller the targets are, the higher is the impact of latency on performance, which can be a problem in modern systems where pixel densities become larger and the number of objects displayed increases. Also, Teather et al. [34] used 12-pixel wide targets to see a 15% decrease of performance from 35 ms of latency. Pavlovych et Gutwin found a drop of performance and increased number of errors from as low as 50 ms [31]. Finally, Claypool et al. [14] showed that latency also impacts the acquisition of moving targets.
Reducing or compensating end-to-end latency
Two main approaches can be used in order to diminish the impact of end-to-end latency.
Hardware reduction
The first approach consists in reducing the latency by using high frequency input and output devices. Typically, Ng et al. [30] developed their own touch-based device that offered 1 ms end-to-end latency. They used a homemade 24×16cm touch surface capturing touch contacts at 1 kHz. Inputs are then handled by a Xilinx FPGA to be displayed on a 1024×768 mono color video projector with a refresh of 32 kHz and input latency of 40 µs. Friston and al. [18] also did the same kind of work. They built their own architecture based on a FPGA to avoid the current GPU architecture latency (20 ms). They describe in their paper the design of such a workflow to build a DVI display driver running a 2D user interface with 1ms of end-to-end latency. This approach can drastically diminish end-to-end latency, but requires dedicated, expensive state-of-the art hardware and has not been tested with real UIs that would display complex information.
Software compensation
The second approach consists in using methods in order to “predict” what should be displayed in the near future. One of
the most common prediction techniques (used for predicting navigation, vehicles control, trajectory estimation, etc.) con-sists in using a Kalman filter [23] (also known as LQE for Linear Quadratic Estimation) to estimate the next state of a measurement following a model, i.e. a relationship between measurements. The algorithm works in two steps: the predic-tion step, where the Kalman filter estimates the next value of the current state, and the correction step, when the Kalman fil-ter receives new inputs and updates its estimates. This method has been used to compensate latency in direct touch [6, 28]. Knibble et al. [25] used a Microsoft Kinect depth camera and a video projector to display an image on moving targets like free flight balls or human movements. They used a Kalman filter combined with a ballistic model to compensate for the overall latency of their system, and improve its accuracy of 34% for free flight alignment and 40% for human body alignment. Laviola proposed to use a double exponential smoothing al-gorithm in order to predict user’s position and orientation in a Virtual Reality environment [26]. He compared his algo-rithm to various Kalman Filters solutions and showed that, in addition to being easier to implement, it also runs faster and performed equivalently.
Another approach proposed by Cattan et al. [13] to predict inputs continuously on a touch surface consists in using a constant speed linear predictor based on Taylor series (first order) to find the future position of the finger based on the past inputs, reducing latency from 25 to 75 ms but they have shown it only worked when fully compensating 25 ms end-to-end latency.
Qingkui et al. [8] proposed in a patent to use curve fitting to predict user’s pointing. Their goal was to fit a curve to recent touch points and predict the next location using extrapolation, by fitting a polynomial to the last 50 to 60 input points, and use the curve tangent and polynomial derivative to predict the next touch point frame (16.7 ms at 60 Hz).
Kim et al. [24] proposed in a patent to use velocity and accel-eration to compute a prediction. They defined a magnitude of direction change (the angular difference between vectors formed from the new point to previous point, and the pre-vious point to the next prepre-vious point) as a heuristic. For a magnitude lower than 15°, then velocity dominates, otherwise acceleration dominates. We refer to Nancel et al. for a detailed review of the above prediction techniques [29].
Note that all above techniques compute derivatives using sim-ple time differentiation between the last two positions or veloc-ities. Simple time differentiation has the advantage of being easy to implement, fast to compute and using the most recent data available and thus introducing less latency in the esti-mation of derivatives. The drawback is that the derivatives are generally noisy. Ushirobira et al. compared differenti-ation algorithms (homogeneous and algebraic methods) to estimate the derivatives of a computer-mouse with the goal to use these derivatives to perform some latency compensa-tion [35]. Their results suggest that the algebraic differentiator provides smoother curves but when applied to latency com-pensation it results in large overshootings. The results they
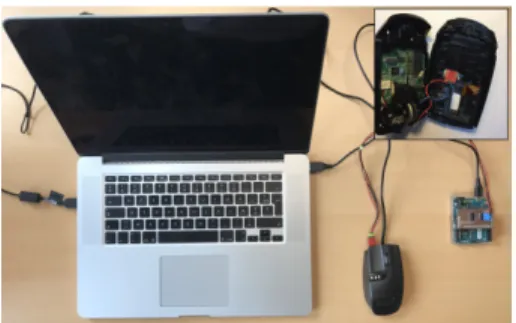
Figure 2: Our setup comprises a Logitech G9 Laser Mouse connected via USB to the host computer with the MPU-9250 chip embedded in-side. The MPU-9250 chip is connected to an Arduino Leonardo that is connected to the host computer via USB.
obtained are based on off-line computations on data logged from a computer mouse. Their technique was not implemented in a real working prototype nor was it evaluated through con-trolled experiments and they did not compare to simple time differentiation. Without evidence of an advantage of algebraic differentiator over simple differentiation we did not replace the simple differentiation used in the techniques of the state of the art with other techniques.
Finally, Henze et al. [20] trained a neural network with almost 3 million touch events from over 138 000 strokes in order to extrapolate finger movement on a touch-based device. Predic-tion using their neural network was more precise than linear and polynomial extrapolation. However, they do not provide the trained neural network, nor the touch events they trained the neural network with, making it impossible to replicate their solution.
Evaluating the accuracy of a prediction method is usually per-formed by using the Root Mean Square error [26], or worst Euclidean error distance [28]. Unfortunately, these metrics rely only on the distance between the predicted position and the real one and are not able to capture side effects introduced by prediction algorithms. Therefore, Nancel et al. [29] eval-uated multiple touchscreen predictors and established new metrics. They conducted a controlled experiment and got user feedback on visual artefacts they noticed on the predicted positions of the finger in different tasks. They grouped user feedback into different categories - lateness, over-anticipation, wrong orientation, jitter, jumps, wrong distance, spring effect -and established different metrics based on these artefacts cate-gories to compute the appearance probability of each visual artefact.
TURBOMOUSE
We propose TurboMouse, a hybrid hardware and software prediction technique specifically designed for partially com-pensating for end-to-end latency in indirect pointing. Our technique relies on a low-cost high frequency accelerometer embedded within a computer mouse. We hereafter describe the hardware we used and how we merge the different sensor data. We then detail our prediction technique.
Hardware
Our setup (illustrated in Figure 2) comprises an optical laser computer mouse embedded with an accelerometer connected to an Arduino board. Both the mouse and Arduino board are connected to a host computer via USB.
Mouse controller
We used a conventional gaming USB Logitech G9 Laser mouse [4], whose retail price was of $99 USD. Its resolu-tion can be configured from 200 CPI to 3200 CPI, and can send from 125 to 1000 HID reports per second. While all these settings can be altered using a dedicated utility software provided by the manufacturer, we decided to use the controller in its default configuration, which runs at 1000 Hz with the resolution of 2000 CPI.
Accelerometer
Movement acceleration measures are provided by an In-venSense MPU-9250 chip [2], 9-axis motion tracking device embedded within the mouse controller, which is connected to an Arduino Leonardo board using I2C communication sys-tem. We tried to position as accurately as possible the IMU on top of the optical sensor. We also tried to align the axis of the accelerometer with the ones of the optical sensor. The MPU-9250 is able to run up to 4 kHz in a range of [-16g; +16g] with an initial tolerance of ± 80 mg. It also contains a gyroscope sensor, running up to 32 kHz and 2000◦/s and a magnetometer capable of running at 100 Hz. In this context, we only used the accelerometer component of the chip that we configured to run at 4 kHz in a range of [-2g ; +2g]. However, since the Leonardo is connected to host computer using USB protocol, we are limited to 1 kHz for sending raw HID reports. Therefore, we chose to read the register values at 1 kHz (i.e. read one value of four). We tried to compute an average each millisecond using the 4 values previously measured by the accelerometer, but this extra computation impacted the output rate of 1 kHz.
The accelerometer of the MPU-9250 has a Zero-G initial cali-bration tolerance of ± 80 mg. To calibrate the accelerometer, we first record the acceleration values from the 3 axes at rest. From there, we compute a mean of each axis acceleration, and we subtract the offset of each axis from the corresponding new input. To reduce noise, we also added filtering directly on the input acceleration and configured a 1e filter [12] empirically tuned with 0.7 Hz mincutoff and 0.4 beta values for each axis. Software
The mouse controller and Arduino board send their data to a host computer via USB that runs a dedicated software to handle these signals and predict the next position of the mouse cursor. This software was written in C++ with the Qt Frame-work.
Merging input data
Acceleration inputs are transmitted to the computer every 1ms using HIDAPI [1] in a dedicated blocking-thread. Each event received is timestamped and buffered by our software. The Ar-duino also records and sends a timestamp to the host-computer. In this way we were able to determine that the communication between the Arduino and the host-computer is below 1 ms. As
a result we use the timestamps recorded by the host computer for the following.
Mouse inputs are provided at 1 kHz by the Logitech G9 Laser controller and captured by the libpointing library [11] which allows us to get raw informations (dx [counts], dy [counts], timestamp [ns], buttons)at very low level.
Inputs are merged based on their timestamps. For each mouse input we associated the most recent acceleration values stored in the buffer.
Supporting transfer functions
Cursor control is performed on desktop systems through in-direct pointing via a mouse or a trackpad. As the physical distance that must be travelled by a cursor can be important, this interaction paradigm usually relies on a transfer function in order to apply a control-display gain (G) that will impact cursor displacement [11]. Basically, the velocity of the cursor corresponds to a function of the velocity of the input device in the real world. For example, a constant transfer function of gain 2 will move the mouse cursor on screen by 4 cm if the physical mouse displacement is equal to 2 cm. However, as pointed out by Casiez et al. [11], most transfer functions nowa-days are non-linear and dynamically adjust the gain depending on the input velocity.
Taking account of a transfer function TF for the input acceler-ation implies multiplying the inputs by this gain G as done for mouse inputs. However the operating system transfer function makes it very hard to precisely know in real time the gain being applied on input. For that reason we bypass the system transfer function and use the transfer functions provided by libpointing[3] to easily get the gain applied at a given time frame and exactly know the transfer function used. It also eases later replication.
Prediction
Our linear prediction technique retrieves the current cursor position pcurrent(in meters), the current cursor velocity v
cap-tured by the mouse (in m/s) and the current cursor acceleration a captured by the accelerometer (m·s−2) at high frequency (1 kHz). First, it computes the gain factor G based on the current transfer function T F and vmouse(eq. 1). Then, it corrects the
velocity v measured by the mouse optical sensor every dt with hardware acceleration a to obtain a more accurate velocity vcorrected(eq. 2). dt is computed as the timestamps difference
between the current event and the past event.
G=T F(vmouse) vmouse
(1)
vcorrected=vmouse∗ G + a ∗ G ∗ dt (2)
ppredicted=pcurrent+ vcorrected∗ comp + 0.5 ∗ a ∗ G ∗ comp2
(3) From there, the predicted position ppredicted of the mouse
can be computed within a future time interval (comp, for latency compensation) using the current position pcurrent, the
corrected velocity vcorrectedand the acceleration a (eq. 3).
We also smoothed the predicted positions with 1e filter [12] empirically tuned with 12 Hz mincutoff and 0 beta values for each axis (x and y).
EVALUATING PREDICTION QUALITY
We conducted a first experiment in order to compare the perfor-mance of TurboMouse in terms of prediction accuracy to other predictors from the literature. This experiment consisted in performing various tasks in order to first collect input events from the mouse sensor and the accelerometer, and then to use these input events to compute metrics that are used as benchmarks for prediction methods.
Data collection
Tasks and procedure
Participants were instructed to perform drawing and pointing tasks as quickly and accurately as possible. The drawing task consisted in dragging the mouse cursor over different shapes displayed at the center of the screen (square, circle, triangle and infinity symbol), without any suggested width on the shape outline participants had to stay in. To complete a dragging operation, participants had to position the mouse cursor within a red circle located somewhere along the shape (Figure 3-left), drag the mouse cursor all over the shape while holding the mouse button, and release the mouse button when back in the red circle. If a mouse press or mouse release event occurred outside the red circle, the trial was not considered and participants had to perform it again.
The pointing task was a 2D reciprocal pointing task with 13 targets positioned along a circle (Figure 3-right) following the norm ISO 9241-9 (§B.6.2.2) [21]. For each trial, participants had to select a target of a width W and located at a distance Dfrom the initial position of the cursor. To select the target, participants had to position the mouse cursor over the target and click on it. The experimental software moved to the next trial only when the target was correctly selected.
Once correctly selected, the current target was hidden and the next target was highlighted on the screen (with only one target highlighted on screen at a time). For both tasks we collected all input events from the mouse and the accelerometer. The operating system transfer function was disabled in order to be able to collect data with two different transfer functions. No software compensation of latency was provided in this experiment.
Design
The experiment used a 2 × 2 within-subject design for the main factors task (pointing or drawing) and transfer function (sigmoid or constant gain of 4). We used the sigmoid function that mimics the default macOS transfer function provided by libpointing [11], that we configured with the following parameters: (gmin=1 gmax=15 v1=0.05 m/s v2=0.6 m/s). The experimental design then varied depending on the task. Drawing tasks used a 4 × 2 × 2 design with factors shape (square, circle, triangle and infinity), shape size (75mm, 150mm) and direction (clockwise, counter-clockwise). Shape and direction were presented to participants in a random order.
Figure 3: In the drawing task (left) participants had to follow the shape outline in dragging mode by pressing and releasing mouse button in the red circle. The direction is indicated by the arrow. In the pointing task (right) participants had to press and release the mouse button on the green target. Opposite target to the current one becomes green until all targets have been selected.
Pointing tasks used a 2 × 2 × 12 design with factors target dis-tance(75mm, 150mm), target width (2mm, 7mm), repetition (1-13, with the first repetition being systematically discarded since used to control the initial cursor position). Combina-tion of distance and width were presented to participants in a random order.
All participants performed both tasks, each task being tested with both transfer functions. In total, each participant per-formed 2 × 4 × 2 × 2 = 36 dragging trials and 2 × 2 × 2 × 12 = 96 pointing trials for a total number of trials of 132 trials. Apparatus and participants
This experiment was conducted on a Mid 2015 15.4” MacBook Pro running macOS Sierra 10.12.6 and equipped with a 60 Hz Retina 2880×1800 display and integrated 1536MB Intel Iris Pro 5200. The experimental software was implemented in C++, using the Qt framework. Ten participants (mean age 31, 3 women) participated in the data collection.
Comparing prediction performances
Offline analysis methodology
By default, we consider the collected points as points with latency. For a given collected point that occurred at t0, we
estimate its ground truth predicted value n ms in the future (that we will call real position) by interpolating linearly between the collected points (tiand ti+1) n ms later (Figure 4). Each value
of n represents in that case the amount of latency compensation to be computed. We use a given prediction algorithm in order to compute predicted points for different artificial latencies (8, 24, 40 and 56 ms). We then compare the performance of these predictions using different pointing prediction metrics.
ti+2 ti+1 t0 time n ms compensation Collected points Real/Interpolated point Predicted point t0+comp
Figure 4: The ground truth compensated estimation of a given collected point at t0is estimated by interpolating linearly between the collected
Metrics
In addition to the classic Root Mean Square Error (RMSE), we compared the prediction performance using the metrics introduced by Nancel et al. [29] for evaluating direct pointing prediction. These metrics that were invented by combining geometric properties and user feedback on the perception of different prediction algorithms, are computed in the context of direct pointing by comparing the predicted position to finger position on screen.
We adapted the metrics from Nancel et al. [29] (see section Metrics and models) to indirect pointing, as follows:
• Lateness: measures how much the predicted point is behind the real one
• Over-anticipation: measures how much the predicted point is in front of the real one, in the direction of movement • Wrong orientation: measures how much the predicted point
is not going in the same direction as the pointer
• Jitter: measures the amount of noise of the predicted pointer positions
• Jumps: measures how often the cursor jumps away from the trajectory from time to time
Predictors
We computed these metrics on 5 state-of-the-art predictors: Laviola using Double Exponential Smoothing (DES) [26], Kalman [28], Linear 1st order (first) [13], Linear 2nd order
(second) [36], quadratic [8] and TurboMouse.
Except DES we used for all other predictors the implementa-tions provided1by Nancel et al. and we also used the code they provide to compute the metrics [29]. We were not able to compute values for the Spring effect metric as the provided implementation systematically returned 0 for every predictor. Results
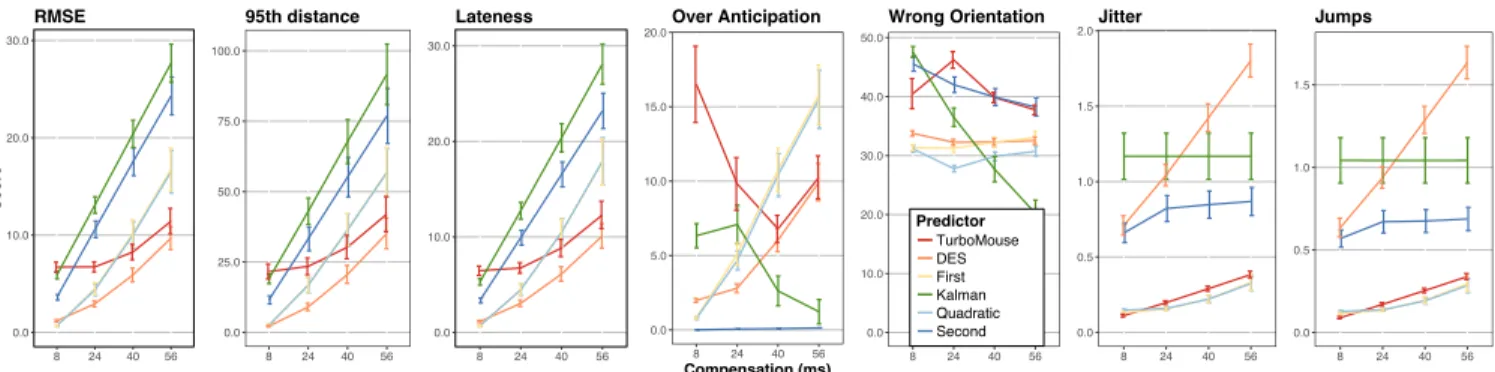
To run our statistical analyses we aggregated all data to keep 4 factors: latency compensation (8, 24, 40 and 56 ms), predictor (DES, Kalman, first, second, quadratic and TurboMouse), task (drawing, pointing) and transfer function (TF) (sigmoid and constant).
Note that for each metric mentioned hereafter, a higher score corresponds to a higher chance to notice the corresponding effect. A perfect prediction technique would show low scores across all latencies and metrics.
We used SPSS to run the statistical analyses in this experiment and the next one. Greenhouse-Geisser corrections to the de-grees of freedom were applied when sphericity was violated. Pairwise comparisons used Bonferroni correction.
RMSE
Our main dependent variable is the Root Mean Square Error (RMSE) that is the most common metric used to evaluate the performance of prediction or related techniques.
Repeated-measures ANOVA found a significant main effect of compensation (F3,27= 140.0, p < 0.0001, η2p= 0.94), predictor
(F5,45= 222.1, p < 0.0001, η2p= 0.96), task (F1,9= 48.5, p < 0.0001, η2p=
1http://ns.inria.fr/mjolnir/predictionmetrics/
0.84) and significant compensation × predictor (F15,135= 127.5,
p< 0.0001, η2
p= 0.93) interaction on RMSE. Pairwise
compar-isons show that the drawing task has lower RMSE compared to pointing, certainly due to the lower speeds used while drawing. TFhad no significant effect (p=0.07). The significant compen-sation× predictor interaction reveals that TurboMouse has lower RMSE compared to first and second for compensation above 24 ms, suggesting our use of hardware acceleration provides better predictions than time derivative techniques, especially when trying to compensate higher levels of latency (Figure 5). Overall DES has the lowest RMSE across all compensationwhile Kalman is the worst, certainly because the predicted points are very close to lagging ones (as shown hereafter this is highlighted by the Lateness metric). How-ever RMSE only provides partial results as it does not reveal side-effects associated to prediction techniques.
Other metrics
All other metrics show significant main effects and interac-tions very similar to the ones obtained for RMSE (with similar F and p-values) with the following exceptions: there is no significant effect of task for WrongOrientation (p=0.06). In addition we found significant main effects of TF and signifi-cant TF × predictor interactions for 95thpercentile (p<0.02), OverAnticipation (p<0.04) and Jitter (p=0.03). For Jitter there was no significant TF × predictor interaction.
Pairwise comparisons for task reveal that 95thpercentile,
Late-ness, OverAnticipation, Jitter and Jumps are significantly lower for drawing than pointing task. Pairwise comparisons for TF and predictor reveal constant transfer function shows significantly higher values compared to sigmoid: 45 vs. 40 for 95thpercentile and 0.7 vs 0.6 for Jitter. For OverAnticipation no significant difference was found for TurboMouse. When analysing the interaction between compensation and predictor(Figure 5), we can observe that TurboMouse has a good ability to reduce Lateness compared to other predictors, especially for higher levels of latency. Only DES is better but exhibits much higher levels of Jitter and Jumps that are clearly noticeable when using it.
OverAnticipation and WrongOrientation overall show higher scores for TurboMouse but this is typically the case with pre-dictors being more efficient to reduce Lateness. However the higher values for OverAnticipation can mostly be explained by one limitation of our predictor. Indeed, we realized by testing our prototype that when the mouse suddenly stops moving and, the cursor was already too far in the direction of the pre-diction, then the cursor snapped back, resulting in an elastic band effect. The effect is more noticeable as the user stops more quickly. Of course, the more the compensation increases, the more the effect is noticeable.
In summary, from the off-line simulations done in this first experiment, we have learnt that the pointing task overall in-creases the side-effects associated to prediction techniques. We observed that participants were clearly slower in the draw-ing task compared to the pointdraw-ing task which can be easily explained by the nature of the tasks. Slower speeds are less likely to produce side-effects. We have also learnt that the
0.0 10.0 20.0 30.0 8 24 40 56 Score RMSE 0.0 25.0 50.0 75.0 100.0 8 24 40 56 95th distance 0.0 10.0 20.0 30.0 8 24 40 56 Lateness 0.0 5.0 10.0 15.0 20.0 8 24 40 56 Compensation (ms) Over Anticipation 0.0 10.0 20.0 30.0 40.0 50.0 8 24 40 56 Wrong Orientation 0.0 0.5 1.0 1.5 2.0 8 24 40 56 Jitter 0.0 0.5 1.0 1.5 8 24 40 56 Predictor TurboMouse DES First Kalman Quadratic Second Jumps
Figure 5: Scores for each metric, amount of latency and predictor. Error bars represent 95% CI for the mean.
transfer function has little impact on the side-effects. Only 95thpercentile and Jitter are affected and when considering the range of values over which each metric spans, the differences between the two transfer functions appear to be very small. Last when considering all metrics together, our algorithm ap-pears to be a good trade-off between reduction of Lateness and introduction of side effects. However these results remain based on off-line simulations. The metrics were developed for direct touch surfaces and this is the first time to our knowl-edge they are used in a context of indirect interaction. What would require further investigation is the relation between the magnitude of an effect and its perception by the user. IMPACT OF TURBOMOUSE ON PERFORMANCE
We conducted a second experiment to evaluate if our latency compensation method improves user performance (i.e. de-creases the movement time) in pointing tasks, in spite of po-tential side-effects highlighted by previous simulations. We chose the pointing task as it is the predominant task on desk-top interfaces and that the previous experiment reveals higher side-effects with it.
Method
Procedure and design
Participants were instructed to perform the same pointing task as for the first study, as quickly and accurately as possible, with different levels of artificial additional latency (0ms, 33.3ms, 66.6ms) and latency compensation (0ms, 16.7ms, 33.3ms, 50ms). The levels of artificial latency were chosen to cor-respond to 0, 2 and 4 frames of delay on a 60 Hz display. The levels of latency compensation correspond to 0, 1, 2 or 3 frames of compensation on a 60 Hz display. Latency compen-sation was provided using the TurboMouse. We used the same target distances (75mm, 150mm) and widths (2mm, 7mm) as in the previous experiment. The experiment was composed of 3 blocks of 9 repeated target selections for each ID, level of artificial latency and compensation, with the first selection of every block used as a method for controlling initial cursor position (thus, the first selection of every block was discarded). Clicking outside the target was considered as an error. Partici-pants had to successfully select a target before moving to the next one to prevent them from racing through the experiment. Participants had the opportunity to take a break every time compensationor artificial changed (that is, every 3 blocks).
The pause screen also displayed their current error rate and they were encouraged to adjust their speed / accuracy trade-off to respect a 4% error rate. Since the metrics did not reveal any significant effect of transfer function on latency compensa-tion, the only transfer function set during the experiment was the sigmoid function mimicking the macOS default transfer function used in previous experiment. The experiment used a 3 × 4 × 3 × 2 × 2 × 8 within-subjects design for factors : ar-tificiallatency (0, 33.3 and 66.6 ms), latency compensation (0, 16.7, 33.3 and 50 ms), block (1-3), target distance (75 mm or 150 mm), target width (2 mm or 7 mm) and repetition repetition(1-9). Order of artificial was counterbalanced across participants, compensation was presented in increasing order, and target size and distance were presented in random order. In total, each participants performed 3 × 4 × 3 × 2 × 2 × 8 = 1152 selections used for analysis. The experiment lasted on average 35 minutes.
Participants and apparatus
Twelve participants (mean age 26, SD 7.5, 3 women) were recruited for this experiment, which was conducted using the same apparatus as the previous experiment.
Mechanics for adding artificial latency
Artificial latency was added through artificial delaying of in-put events. Inin-put events received from the mouse and the accelerometer were directly buffered when they arrived on the host computer. As each event is associated with a times-tamp when received by the host computer, our experimental software delays the event handling by comparing its times-tamp plus the amount of artificial latency wanted with the current timestamp. After being delayed when the event is then handled, the prediction is computed to compensate latency. Measuring end-to-end latency of the study
We measured the end-to-end latency in our application using the method described by Casiez et al. [10]. We performed 190 measures for each artificial latency and found 40.5 ms (SD 7.0 ms) for 0 ms artificial latency, 74.1 ms (SD 6.8 ms) for 33.3 ms artificial latency and 108.5 ms (SD 7.6 ms) for 66.6 ms artificial latency, showing our artificial latency mechanics worked as expected. The default latency of our application is particularly low given we use a 1000 Hz mouse and our application had few objects to render in OpenGL.
Results
Error rate
Error rate is measured as the percentage of trials not success-fully completed. Repeated-measures ANOVA revealed signifi-cant effect of width on error rate (F1,11= 9.2, p < 0.01, η2p= 0.46;
2 mm: 6.6%, 7 mm: 3.5%). No other main effect or interaction was found on error rate. On average the error rate is equal to 5.0%.
Movement time
Movement time is the main dependent measure and is defined as the time taken to move from a target to the next one and click on it. Targets marked as errors were removed from the timing analysis.
Repeated-measures ANOVA did not reveal any significant main effect of block but a significant block ×compensation interaction (F6,66= 2.8, p < 0.02, η2p= 0.21) on movement time.
Pairwise comparisons show that for 0 ms of latency compensa-tion, there is a significant decrease in movement time between block 1 and block 3 (p = 0.03; block 1 = 1.54 s, block 3 = 1.48 s). Considering the small learning effect, we chose to keep all the blocks for subsequent analysis.
Repeated-measures ANOVA found a significant main effect of artificial(F2,22= 10.8, p < 0.001, η2p= 0.49), compensation (F3,33=
36.8, p < 0.001, η2
p= 0.77), distance (F1,11= 312, p < 0.0001, ηp2=
0.97), width (F1,11= 305.2, p < 0.0001, η2p= 0.96) and significant
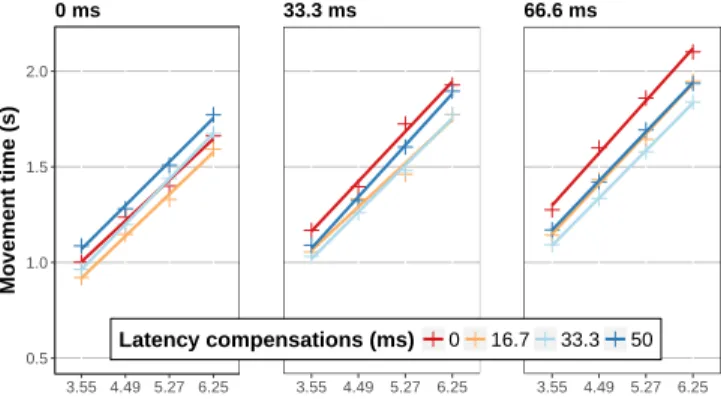
artificial×compensation (F6,66= 7.8, p < 0.001, η2p= 0.41) on
movement time. This interaction reveals that the compensation of latency does not affect movement time in the same way depending on the amount of artificial latency (Figure 6). For 0 ms artificial latency, pairwise comparisons show a sig-nificant (p<0.001) increase of movement time between latency compensation 50 ms and both 16.7 ms and 33.3 ms (0ms: 1.29s, 16.7ms: 1.22s, 33.3ms:1.26s, 50ms:1.37s). However no significant difference was found between 0 ms compensation and the other amounts of compensation. For 33.3ms artificial latency, 16.7ms and 33.3ms compensation significantly (p<0.003) im-prove movement time compared to 0 ms compensation (0ms: 1.52s, 16.7ms: 1.38s, 33.3ms:1.36s, 50ms:1.43s). Last for 66.6 ms arti-ficial latency, all compensations significantly (p<0.04) improve movement time (0ms: 1.69s, 16.7ms: 1.51s, 33.3ms:1.42s, 50ms:1.52s). To sum up, both 16.7 and 33.3 ms compensation significantly improve performance compared to 0 ms artificial latency both for 33.3 ms and 66.6 ms artificial latencies and no significant difference was found for 0 ms artificial latency. 50 ms latency compensation significantly improves performance compared to 0 ms latency compensation only in the 66.6 ms artificial latency condition. In the best case scenario (33.3ms latency compensation with 66.6ms artificial latency), latency compen-sation improves movement time by 16%.
With the values of artificial latencies and latency compensa-tion we chose, it is interesting to compare 33.3 ms latency compensation in the 33.3 ms artificial latency condition (1.36s) with 0 ms latency compensation in the 0 ms artificial latency condition (1.29s). No significant difference was found between the two conditions. In the same way, we can compare 33.3 ms latency compensation in the 66.6 artificial latency condi-tion(1.42s) with 0 latency compensation in the 33.3 ms artificial
0.0 0.2 0.4 0.6 0.8 1.0 1.2 1.4 1.6 1.8 0 33.3 66.6 Artificial latencies (ms) Mo vement time (s) Latency compensations (ms) 0 16.7 33.3 50
Figure 6: Movement time for the different amounts of artificial latency and latency compensation. Error bars represent 95% confidence inter-val for the means.
latency condition (1.52s). Again no significant difference was found between the two conditions.
We also ran a Fitts analysis to standardise our results (Figure 7). The analysis showed all r2values above 0.98 and con-firmed our results. For 0 artificial latency, only the 16 ms compensation regression line is below 0 compensation and for all other artificial latency values, the regression lines for all compensation values are below the one for 0 compensation which confirms the interest of TurboMouse for systems with high latency.
Qualitative feedback
Half the participants found that the transfer function used was not fast enough and forced participants to do larger physical movements than they were used to do doing. As a result par-ticipants were more likely to use higher speeds with the mouse which were more likely to increase the impact of side-effects. From 33.3 ms of compensation, all participants said that the cursor was "shaking" but still "controllable" and that it got "worse" for 50 ms of compensation. With 33.3 and 50 ms of compensation, 3 participants reported that they explicitly restricted the velocity of their mouse inputs motions to avoid this side-effect. Only 2 participants noticed that the "shaking" side effect occurred mostly when they suddenly stopped mov-ing, and then tried to smooth their physical movements. For
0.5 1.0 1.5 2.0 3.55 4.49 5.27 6.25 Mo vement time (s) 0 ms 3.55 4.49 5.27 6.25 33.3 ms 3.55 4.49 5.27 6.25 Latency compensations (ms) 0 16.7 33.3 50 66.6 ms
Figure 7: Fitts linear regressions for each amount of artificial latency and latency compensation.
16.7 ms of compensation, no one reported any side effect, but on the contrary, found the cursor more reactive and smoother. Finally, with 33.3 and 50 ms of compensation, 5 participants reported to find it easier to have a higher amount of end-to-end latency that they qualified "smooth" but "slower" rather than having less delay but more side effects.
DISCUSSION
Prediction quality of TurboMouse
We performed an offline analysis with several metrics to com-pare the prediction quality of TurboMouse comcom-pared to other prediction methods. Overall, TurboMouse provided a good prediction performance with better metrics score than most predictors from the literature, and a good Root Mean Square Error score. Note that Laviola’s predictor based on Double Ex-ponantial Smoothing (DES) was arguably the “best” predictor in term of RMSE, but is significantly worse than TurboMouse with the Jitter and Jumps metrics. While these metrics are not critical in direct interaction where user’s finger might hide the shaky behaviour of the predictor, they are critical in indirect interaction since the mouse cursor is not hidden in any way. Moreover, high Jitter and Jumps are the side effects that are the most likely to be noticed by the user. When considering all metrics together, our prediction algorithm appears as a good trade-off between latency reduction and introduction of side-effects. Another interesting result is that TurboMouse was not affected by the Transfer Function factor, suggesting that it can be both applied to constant gain functions and more complex sigmoid ones.
Impact of TurboMouse on user performance
Our second experiment assessed the effect of TurboMouse on user performance in pointing tasks. Its results showed that with 33.3 ms of artificial latency (for an approximate overall latency of 74.1 ms which corresponds to the average end-to-end latency found on current desktop computers [9]), moderate compensations of 16.7 ms and 33.3 ms of latency significantly improved pointing time. The benefits are even better with 66.6 ms of artificial latency (108.5 ms end-to-end) where all compensations improve performance. However, they did not reveal any evidence that latency compensation im-proves user performance without any artificial latency added but this is consistent with results from previous work showing decrease of performance from 50 ms [31, 32]. While Turbo-Mouse showed only benefits when artificial latency was added, we believe these results are still interesting since the latency measure performed in the literature [9] and in our application were executed with applications requesting limited graphic resources, and latency is likely to increase with more graphi-cally demanding applications. Another interesting result was that no significant difference was found between “equivalent” latency conditions (typically, no compensation with 0 ms of artificial latency and 33 ms of compensation with 33 ms of artificial latency).
As a summary, the results of our studies show that a com-pensation as little as 16.7 ms provides significant benefits in term of pointing time, without producing any noticeable side-effect. While the gain in performance (up to 16%) might seem small for everyday use, it still might be a significant benefit
for specific application areas such as competitive gaming in first-person shooter games where milliseconds matter. Limitations of TurboMouse
TurboMouse currently relies on a separate mouse controller and accelerometer, thus requiring a buffering step in order to associate the input events with each others. Integrating the accelerometer directly on the mouse PCB requires few modifi-cations for a manufacturer as an accelerometer has a small foot-print of the order of 1×1 mm and can be easily connected to the existing micro-controller using I2C. The micro-controller
would synchronize and read the sensors to directly send HID events to the computer with (countX, countY, AccelerationX, AccelerationY, buttons). The integration of the accelerometer on the mouse PCB would also help to get perfect alignment with the optical sensor and it would allow to do some filter-ing directly on the micro-controller (like averagfilter-ing the last 4 values with an accelerometer running at 4 kHz).
Another limitation of TurboMouse is that it requires a USB mouse controller since wireless communication protocols do not support robust and stable 1000Hz data transfer yet. That being said, it can be noted that application areas that might benefit the most from latency reduction (typically, competitive gaming) already tend to minimize latency thus using mostly USB high resolution mouse controllers [5]
Finally, another limitation remaining is the over-anticipation of the technique when the mouse controller abruptly stops, resulting in a noticeable elastic effect. Tuning the prediction algorithm with a specific function to cope with it when a significant deceleration occurs would help reducing this effect when trying to compensate higher amounts of latency. TurboMouse in current systems
TurboMouse could be integrated in a transparent way into an operating system and work system wide by installing a dedi-cated mouse driver. The driver would first acquire acceleration data from the mouse using raw HID on an additional endpoint attached to the existing USB connection. Then, it would apply our prediction equations on data and bypass existing system transfer function to control the mouse pointer.
CONCLUSION
We introduced TurboMouse, a hybrid hardware and software latency compensation technique specifically designed for indi-rect interaction. TurboMouse combines the velocity measured by the mouse and the acceleration reported by an accelerom-eter embedded in the mouse to predict cursor’s position us-ing Euler based equations. Our first experiment showed that TurboMouse appears as a good trade-off between latency re-duction and introre-duction of disturbing side-effects that might be noticed by the user. Our second experiment showed that TurboMouse increases user performance in pointing task, es-pecially in an environment with relatively high latency. Future work will be focused on attempting to further minimize the side-effects of TurboMouse for higher levels of latency com-pensation.
ACKNOWLEDGMENTS
This work was supported by ANR (TurboTouch, ANR-14-CE24-0009).
REFERENCES
1. HIDAPI. Retrieved January 8th, 2018 from
https://github.com/signal11/hidapi
2. Invensense MPU-9250 datasheet. Retrieved January 8th, 2018 fromhttps://www.invensense.com/wp-content/ uploads/2015/02/PS-MPU-9250A-01-v1.1.pdf
3. Libpointing. Retrieved January 8th, 2018 from
https://github.com/INRIA/libpointing
4. Logitech G9 Laser Technical specifications. Retrieved January 8th, 2018 fromhttp://support.logitech.com/en_ us/product/g9-laser-mouse/specs
5. Professional video gamers configurations. Retrieved January 8th, 2018 fromhttps://prosettings.net
6. 2011. Multi-touch trajectory tracking method.
https://www.google.com/patents/CN102096530A?cl=enCN
Patent App. CN 201,110,030,430.
7. 2013. Measuring Input Latency. Retrieved January 8th, 2018 fromhttp://renderingpipeline.com/2013/09/ measuring-input-latency
8. 2014. Curve fitting based touch trajectory smoothing method and system.
https://www.google.ca/patents/CN103902086A?cl=enCN
Patent App. CN 201,210,585,264.
9. Géry Casiez, Stéphane Conversy, Matthieu Falce, Stéphane Huot, and Nicolas Roussel. 2015. Looking Through the Eye of the Mouse: A Simple Method for Measuring End-to-end Latency Using an Optical Mouse. In Proceedings of the 28th Annual ACM Symposium on User Interface Software & Technology (UIST ’15). ACM, New York, NY, USA, 629–636. DOI:
http://dx.doi.org/10.1145/2807442.2807454
10. Géry Casiez, Thomas Pietrzak, Damien Marchal, Sébastien Poulmane, Mathieu Falce, and Nicolas Roussel. 2017. Characterizing Latency in Touch and
Button-Equipped Interactive Systems. In Proceedings of UIST’17, the 30th ACM Symposium on User Interface Software and Technology (UIST ’17). ACM, New York, NY, USA, 9. DOI:
http://dx.doi.org/10.1145/3126594.3126606
11. Géry Casiez and Nicolas Roussel. 2011. No More Bricolage! Methods and Tools to Characterize, Replicate and Compare Pointing Transfer Functions. In
Proceedings of the 24th Annual ACM Symposium on User Interface Software and Technology (UIST ’11). ACM, New York, NY, USA, 603–614. DOI:
http://dx.doi.org/10.1145/2047196.2047276
12. Géry Casiez, Nicolas Roussel, and Daniel Vogel. 2012. 1e Filter: A Simple Speed-based Low-pass Filter for Noisy Input in Interactive Systems. In Proceedings of the SIGCHI Conference on Human Factors in Computing Systems (CHI ’12). ACM, New York, NY, USA,
2527–2530. DOI:
http://dx.doi.org/10.1145/2207676.2208639
13. Elie Cattan, Amélie Rochet-Capellan, Pascal Perrier, and François Bérard. 2015. Reducing Latency with a Continuous Prediction: Effects on Users’ Performance in Direct-Touch Target Acquisitions. In Proceedings of the 2015 International Conference on Interactive Tabletops & Surfaces (ITS ’15). ACM, New York, NY, USA, 205–214.
DOI:http://dx.doi.org/10.1145/2817721.2817736
14. Mark Claypool, Ragnhild Eg, and Kjetil Raaen. 2016. The Effects of Delay on Game Actions: Moving Target Selection with a Mouse. In Proceedings of the 2016 Annual Symposium on Computer-Human Interaction in Play Companion Extended Abstracts (CHI PLAY Companion ’16). ACM, New York, NY, USA, 117–123.
DOI:http://dx.doi.org/10.1145/2968120.2987743
15. Jonathan Deber, Ricardo Jota, Clifton Forlines, and Daniel Wigdor. 2015. How Much Faster is Fast Enough? User Perception of Latency & Latency Improvements in Direct and Indirect Touch. In Proceedings of the 33rd Annual ACM Conference on Human Factors in Computing Systems (CHI ’15). ACM, New York, NY, USA, 1827–1836. DOI:
http://dx.doi.org/10.1145/2702123.2702300
16. Daniel Eran Dilger. 2013. Agawi TouchMark contrasts iPad’s fast screen response to laggy Android tablets. Apple Insider. Retrieved January 8th, 2018 from
http://tinyurl.com/punyo98
17. S. Friston, P. Karlström, and A. Steed. 2016. The Effects of Low Latency on Pointing and Steering Tasks. IEEE Transactions on Visualization and Computer Graphics22, 5 (May 2016), 1605–1615. DOI:
http://dx.doi.org/10.1109/TVCG.2015.2446467
18. S. Friston, A. Steed, S. Tilbury, and G. Gaydadjiev. 2015. Ultra low latency dataflow renderer. In 2015 25th International Conference on Field Programmable Logic and Applications (FPL). 1–4. DOI:
http://dx.doi.org/10.1109/FPL.2015.7293974
19. Sebastian Friston, Anthony Steed, Simon Tilbury, and Georgi Gaydadjiev. 2016. Construction and Evaluation of an Ultra Low Latency Frameless Renderer for VR. IEEE Transactions on Visualization and Computer Graphics22, 4 (April 2016), 1377–1386. DOI:
http://dx.doi.org/10.1109/TVCG.2016.2518079
20. Niels Henze, Markus Funk, and Alireza Sahami Shirazi. 2016. Software-reduced Touchscreen Latency. In Proceedings of the 18th International Conference on Human-Computer Interaction with Mobile Devices and Services (MobileHCI ’16). ACM, New York, NY, USA, 434–441. DOI:
http://dx.doi.org/10.1145/2935334.2935381
21. ISO 9241-9 2000. Ergonomic requirements for office work with visual display terminals (VDTs) – Part 9: Requirements for non-keyboard input devices(1 ed.). Technical Report. International Organization for Standardization, Geneva, CH.
22. Ricardo Jota, Albert Ng, Paul Dietz, and Daniel Wigdor. 2013. How Fast is Fast Enough? A Study of the Effects of Latency in Direct-touch Pointing Tasks. In
Proceedings of the SIGCHI Conference on Human Factors in Computing Systems (CHI ’13). ACM, New York, NY, USA, 2291–2300. DOI:
http://dx.doi.org/10.1145/2470654.2481317
23. Rudolph Emil Kalman. 1960. A New Approach to Linear Filtering and Prediction Problems. Transactions of the ASME–Journal of Basic Engineering82, Series D (1960), 35–45.
24. B. Kim and Y. Lim. 2014. Mobile terminal and touch coordinate predicting method thereof.
https://www.google.com/patents/WO2014129753A1?cl=en
WO Patent App. PCT/KR2014/000,661.
25. Jarrod Knibbe, Hrvoje Benko, and Andrew D. Wilson. 2015. Juggling the Effects of Latency: Software Approaches to Minimizing Latency in Dynamic
Projector-Camera Systems. In Adjunct Proceedings of the 28th Annual ACM Symposium on User Interface Software & Technology (UIST ’15 Adjunct). ACM, New York, NY, USA, 93–94. DOI:
http://dx.doi.org/10.1145/2815585.2815735
26. Joseph J. LaViola. 2003. Double Exponential Smoothing: An Alternative to Kalman Filter-based Predictive Tracking. In Proceedings of the Workshop on Virtual Environments 2003 (EGVE ’03). ACM, New York, NY, USA, 199–206. DOI:
http://dx.doi.org/10.1145/769953.769976
27. I. Scott MacKenzie and Colin Ware. 1993. Lag As a Determinant of Human Performance in Interactive Systems. In Proceedings of the INTERACT ’93 and CHI ’93 Conference on Human Factors in Computing Systems
(CHI ’93). ACM, New York, NY, USA, 488–493. DOI:
http://dx.doi.org/10.1145/169059.169431
28. F. Moussavi. 2014. Methods and apparatus for incremental prediction of input device motion.
https://www.google.ca/patents/US8766915US Patent
8,766,915.
29. Mathieu Nancel, Daniel Vogel, Bruno De Araujo, Ricardo Jota, and Géry Casiez. 2016. Next-Point Prediction Metrics for Perceived Spatial Errors. In Proceedings of the 29th Annual Symposium on User Interface Software and Technology (UIST ’16). ACM,
New York, NY, USA, 271–285. DOI:
http://dx.doi.org/10.1145/2984511.2984590
30. Albert Ng, Julian Lepinski, Daniel Wigdor, Steven Sanders, and Paul Dietz. 2012. Designing for
Low-latency Direct-touch Input. In Proceedings of the 25th Annual ACM Symposium on User Interface Software and Technology (UIST ’12). ACM, New York, NY, USA, 453–464. DOI:
http://dx.doi.org/10.1145/2380116.2380174
31. Andriy Pavlovych and Carl Gutwin. 2012. Assessing Target Acquisition and Tracking Performance for Complex Moving Targets in the Presence of Latency and Jitter. In Proceedings of Graphics Interface 2012 (GI ’12). Canadian Information Processing Society, Toronto, Ont., Canada, Canada, 109–116.
http://dl.acm.org/citation.cfm?id=2305276.2305295
32. Andriy Pavlovych and Wolfgang Stuerzlinger. 2009. The Tradeoff Between Spatial Jitter and Latency in Pointing Tasks. In Proceedings of the 1st ACM SIGCHI
Symposium on Engineering Interactive Computing Systems (EICS ’09). ACM, New York, NY, USA, 187–196. DOI:
http://dx.doi.org/10.1145/1570433.1570469
33. Kjetil Raaen and Andreas Petlund. 2015. How Much Delay is There Really in Current Games?. In Proceedings of the 6th ACM Multimedia Systems Conference (MMSys ’15). ACM, New York, NY, USA, 89–92. DOI:
http://dx.doi.org/10.1145/2713168.2713188
34. R. J. Teather, A. Pavlovych, W. Stuerzlinger, and I. S. MacKenzie. 2009. Effects of tracking technology, latency, and spatial jitter on object movement. In 2009 IEEE Symposium on 3D User Interfaces. 43–50. DOI:
http://dx.doi.org/10.1109/3DUI.2009.4811204
35. Rosane Ushirobira, Denis Efimov, Géry Casiez, Nicolas Roussel, and Wilfrid Perruquetti. 2016. A forecasting algorithm for latency compensation in indirect
human-computer interactions. In Proceedings of ECC’16, the 15th annual European Control Conference (ECC ’16). IEEE, 1081–1086. DOI:
http://dx.doi.org/10.1109/ECC.2016.7810433
36. W. Zhao, D.A. Stevens, A. Uzelac, H. Benko, and J.L. Miller. 2012. Prediction-based touch contact tracking.
https://www.google.com/patents/US20120206380US Patent