HAL Id: hal-00303948
https://hal.archives-ouvertes.fr/hal-00303948
Submitted on 23 Nov 2005HAL is a multi-disciplinary open access
archive for the deposit and dissemination of sci-entific research documents, whether they are pub-lished or not. The documents may come from teaching and research institutions in France or abroad, or from public or private research centers.
L’archive ouverte pluridisciplinaire HAL, est destinée au dépôt et à la diffusion de documents scientifiques de niveau recherche, publiés ou non, émanant des établissements d’enseignement et de recherche français ou étrangers, des laboratoires publics ou privés.
Retrieval of stratospheric ozone profiles from
MIPAS/ENVISAT limb emission spectra: a sensitivity
study
N. Glatthor, T. von Clarmann, H. Fischer, B. Funke, S. Gil-López, U.
Grabowski, M. Höpfner, S. Kellmann, A. Linden, M. López-Puertas, et al.
To cite this version:
N. Glatthor, T. von Clarmann, H. Fischer, B. Funke, S. Gil-López, et al.. Retrieval of strato-spheric ozone profiles from MIPAS/ENVISAT limb emission spectra: a sensitivity study. Atmostrato-spheric Chemistry and Physics Discussions, European Geosciences Union, 2005, 5 (6), pp.12031-12066. �hal-00303948�
ACPD
5, 12031–12066, 2005 Retrieval of stratospheric ozone from MIPAS N. Glatthor et al. Title Page Abstract Introduction Conclusions References Tables Figures J I J I Back CloseFull Screen / Esc
Print Version Interactive Discussion
EGU Atmos. Chem. Phys. Discuss., 5, 12031–12066, 2005
www.atmos-chem-phys.org/acpd/5/12031/ SRef-ID: 1680-7375/acpd/2005-5-12031 European Geosciences Union
Atmospheric Chemistry and Physics Discussions
Retrieval of stratospheric ozone profiles
from MIPAS/ENVISAT limb emission
spectra: a sensitivity study
N. Glatthor1, T. von Clarmann1, H. Fischer1, B. Funke2, S. Gil-L ´opez2, U. Grabowski1, M. H ¨opfner1, S. Kellmann1, A. Linden1, M. L ´opez-Puertas2, G. Mengistu Tsidu1,*, M. Milz1, T. Steck1, G. P. Stiller1, and D.-Y. Wang1,**
1
Forschungszentrum Karlsruhe, Institut f ¨ur Meteorologie und Klimaforschung, Karlsruhe, Germany
2
Instituto de Astrof´ısica de Andaluc´ıa (CSIC), Granada, Spain
*
now at: Universit ¨at Bremen, Fachbereich Physik/Elektrotechnik, Institut f ¨ur Umweltphysik, Bremen, Germany
**
now at: SAIC/GSO: MODIS Characterization Support Team, Seabrook, MD 20706, USA Received: 18 August 2005 – Accepted: 24 October 2005 – Published: 23 November 2005 Correspondence to: N. Glatthor (norbert.glatthor@imk.fzk.de)
ACPD
5, 12031–12066, 2005 Retrieval of stratospheric ozone from MIPAS N. Glatthor et al. Title Page Abstract Introduction Conclusions References Tables Figures J I J I Back CloseFull Screen / Esc
Print Version Interactive Discussion
EGU Abstract
We report on the dependance of ozone volume mixing ratio profiles, retrieved from spectra of the Michelson Interferometer for Passive Atmospheric Sounding (MIPAS), on different retrieval setups such as different a-priori profiles, regularization strengths and spectral regions used for analysis. MIPAS is a spaceborne limb-viewing Fourier 5
transform infrared (FTIR) emission spectrometer, by which vertical profiles of various trace gases can be measured simultaneously. Purpose of this investigation is to check and to optimize the current retrieval setup. The choice of different a-priori profiles, of a different approach to retrieve the continuum radiation, and of a weaker regularization than in the reference data version (V2 O3 2) causes only small to moderate deviations 10
of up to ±0.2, −0.3 and ±0.5 ppmv, respectively, in the retrieved ozone volume mix-ing ratios below 60 km altitude. Use of different microwindow sets optimized for polar, mid-latitude and tropical conditions results in deviations of up to ±1.5 ppmv in the al-titude region of the ozone maximum, exceeding the total estimated retrieval error of 0.65 ppmv (polar regions) – 1.2 ppmv (tropics) in this height region. Therefore, to avoid 15
latitudinal artefacts, one fixed set of microwindows is considered more appropriate for retrieval of a whole orbit rather than a latitude-dependent microwindow selection. For this task the microwindow set optimized for the polar atmosphere was found to be bet-ter suitable than its midlatitude and tropical counbet-terparts. The results from the different microwindow sets, which variably cover MIPAS spectral bands A (685–970 cm−1) and 20
AB (1020–1170 cm−1), indicated a positive bias of up to 1 ppmv between the ozone maxima retrieved from the ozone emission in MIPAS band AB only and from combined analysis of MIPAS bands A and AB. Further investigations showed that this discrep-ancy can be caused by a bias between the radiance calibration of level-1B spectra of bands A and AB or by a bias between the spectroscopic data used in bands A and AB. 25
ACPD
5, 12031–12066, 2005 Retrieval of stratospheric ozone from MIPAS N. Glatthor et al. Title Page Abstract Introduction Conclusions References Tables Figures J I J I Back CloseFull Screen / Esc
Print Version Interactive Discussion
EGU 1. Introduction
The Michelson Interferometer for Passive Atmospheric Sounding (MIPAS) is a limb-viewing Fourier transform infrared (FTIR) emission spectrometer with an unapodised spectral resolution of 0.035 cm−1(Fischer and Oelhaf, 1996; European Space Agency (ESA), 2000), which was launched onboard the Sun-synchronous polar-orbiting Eu-5
ropean ENVIronmental SATellite (ENVISAT) on 1 March 2002. MIPAS covers a wide mid-infrared spectral region, namely from 685 to 2410 cm−1, which enables simulta-neous observation of various trace gases. The original standard observation mode, which generally was performed until 26 March 2004, consisted of limb-scans in anti-flight direction, composed of 17 steps with tangent altitudes between 6 and 68 km. The 10
step-width was 3 km up to 42 km and increased up to 8 km above 52 km. Generation of calibrated, so-called level-1B radiance spectra is described in Nett et al. (2002). Sev-eral data analysis schemes have been developed for near-real time and off-line retrieval of profiles of atmospheric trace species from calibrated MIPAS spectra provided by the European Space Agency (ESA) (von Clarmann et al., 2003a). The ozone distributions 15
presented in this paper were derived with the retrieval processor of the Institut f ¨ur Me-teorologie und Klimaforschung (IMK), which was developed to produce self-consistent datasets containing considerably more trace species than enclosed in the operational dataset provided under ESA responsibility. At IMK, for retrieval of stratospheric ozone profiles from spectra measured in the standard observation mode local thermodynamic 20
equilibrium (LTE) is assumed, which is valid for most species throughout the tropo-sphere and stratotropo-sphere. For analysis of trace species in non-local thermodynamic equilibrium (NLTE), which becomes important for MIPAS observations of the upper at-mosphere, the processor capabilities were extended at the Instituto de Astrof´ısica de Andaluc´ıa (IAA).
25
Retrieval of ozone profiles from limb emission spectra meanwhile is rather routine. However, different retrieval algorithms and setups will produce different ozone profiles from the same set of measurements. This is, to a certain degree, even true for the
ACPD
5, 12031–12066, 2005 Retrieval of stratospheric ozone from MIPAS N. Glatthor et al. Title Page Abstract Introduction Conclusions References Tables Figures J I J I Back CloseFull Screen / Esc
Print Version Interactive Discussion
EGU ideal case of synthetic measurements only perturbed by random noise (von Clarmann
et al., 2003a). With real measured spectra, the situation is even worse, because the setup of the retrieval determines how, e.g., uncertainties in spectroscopic data, unac-counted physics such as NLTE emissions, or calibration uncertainties, map onto the retrieved profiles. In this paper we assess the sensitivity of ozone retrievals to changes 5
of the a-priori profiles chosen, the treatment of background continuum emission, the threshold for removal of cloud-contaminated spectra, the regularization strength, and the microwindow selection. The goal of these investigations is the optimization of these quantities. For this purpose, we also take into account a preliminary validation study by Wang et al. (2005). A possible residual bias to independent experiments will be 10
quantified in a final validation study (Steck et al., 20051).
2. Retrieval of vertical ozone profiles
2.1. Description of the reference retrieval setup
In the retrievals performed at IMK, MIPAS level-1B spectra are inverted to vertical pro-files of atmospheric state parameters by constrained non-linear least squares fitting of 15
modeled to measured spectra (e.g., Rodgers, 2000, and references therein) by min-imising the expression
χ2= (ym− yc)TSy−1(ym− yc)+ (xa− x)TR(x
a− x). (1)
Here ym and yc are the measured and modelled spectral radiances, Sy is the co-variance matrix of measurement noise, xa and x are the a-priori and retrieved profile 20
and R is the regularization matrix. First, spectral shift, the temperature profile and
the tangent heights are fitted. Thereafter various trace gas profiles are retrieved in a successive manner, in which the major species O3, H2O, CH4, N2O, and HNO3 are
1
Steck, T., Blumenstock, T., von Clarmann, T., et al.: Validation of ozone measurements from MIPAS-ENVISAT, in preparation, 2005.
ACPD
5, 12031–12066, 2005 Retrieval of stratospheric ozone from MIPAS N. Glatthor et al. Title Page Abstract Introduction Conclusions References Tables Figures J I J I Back CloseFull Screen / Esc
Print Version Interactive Discussion
EGU analyzed first. Beside each target species, microwindow-dependent continuum
radia-tion profiles and microwindow-dependent, but height-independent zero level calibraradia-tion corrections are jointly fitted. More details on the retrieval strategy are given in, e.g., von Clarmann et al. (2003b), Glatthor et al. (2004), H ¨opfner et al. (2004), Mengistu Tsidu et al. (2004) and references therein. The retrieval grid used at IMK has an altitude spac-5
ing of 1 km up to 44 km and of 2 km between 44 and 70 km, which is considerably finer than the height distance of ∼3 km between the respective tangent altitudes. To avoid consequential instabilities, Tikhonov’s first derivative operator is used as smoothing constraint for the retrieval of profiles (Steck, 2002, and references therein).
For IMK ozone retrievals (data version V2 O3 2, V2 is ESA level 1 data version 4.59, 10
O3 2 is IMK ozone retrieval setup 2), climatological profiles compiled by Remedios and Parkes (2003, personal communication) were taken both as a-priori and as first-guess profiles. This climatology is diversified into four seasons and six latitudinal bands (90◦N to 65◦N, 65◦N to 20◦N, 20◦N to 0◦N and correspondingly in the southern hemisphere). Except for the northern polar profile, which contains a kink at 30 km (this kink has been 15
smoothed in an updated version of IMK a-priori profiles), the structure of all profiles is relatively smooth with single stratospheric maxima increasing from 5 to 10 ppmv from polar regions to the tropics.
Instead of analysis of wide spectral bands, generally a set of confined spectral re-gions, so-called microwindows (MWs), is used for retrieval of the volume mixing ratio 20
(VMR) of ozone or other trace species from mid-infrared measurements. The altitude-dependent selection of microwindows is stored in so-called occupation matrices (OMs). In pre-flight studies, microwindow sets were optimized for polar winter, mid-latitude and tropical atmospheric conditions via a quantitative mathematical method by minimizing the estimated retrieval error (von Clarmann and Echle, 1998; Echle et al., 2000). Ta-25
ble 1 shows the microwindow set or occupation matrix, used at IMK for ozone-retrieval, which in the following is also called standard or reference occupation matrix. This mi-crowindow set was calculated for polar conditions, since in first studies mainly polar ozone distributions were investigated. It consists of 10 microwindows and, added up
ACPD
5, 12031–12066, 2005 Retrieval of stratospheric ozone from MIPAS N. Glatthor et al. Title Page Abstract Introduction Conclusions References Tables Figures J I J I Back CloseFull Screen / Esc
Print Version Interactive Discussion
EGU over all 17 tangent altitudes, contains 1429 spectral gridpoints. Six microwindows are
situated in MIPAS band A (685–970 cm−1) in the wavenumber region 741–798 cm−1 and 4 microwindows in band AB (1020–1170 cm−1) in the region 1062–1108 cm−1, each of them used in a specific altitude range. MIPAS band AB contains the most energetic ozone ν1 and ν3 fundamental modes at 1103 and 1042 cm−1, respectively. 5
Lines of these bands are commonly used for ozone retrieval in the middle atmosphere, but often become saturated at lower altitudes. Here the weaker ν2 fundamental band situated in band A can also be taken into account, but many of these lines are perturbed by the 15 µm bands of CO2. Since ozone retrieval at IMK is performed assuming lo-cal thermodynamic equilibrium, all three occupation matrices are optimized such that 10
NLTE emissions are as far as possible excluded. Ozone retrieval of upper atmospheric MIPAS scans (18–100 km) under consideration of NLTE is described by Gil-L ´opez et al. (2005).
2.2. Results of the reference retrieval setup and error estimation
Figure1shows the ozone distribution obtained at IMK (data version V2 O3 2) with the 15
polar OM for MIPAS orbit 8597 of 22 October 2003, which is used as reference in this study. Daytime measurements, indicated by white plus signs, were generally performed on the southward leg of the orbit and nighttime measurements (red plus signs) on the northward leg. Because of the season the day/night terminators are shifted towards 80◦ and −80◦. The tropical and subtropical O3VMR maximum of 12 ppmv is in the altitude 20
region 30–35 km, exhibiting no distinct variation between day and night. The Arctic maximum of about 7 ppmv is situated around 38 km, whereas the Antarctic maximum of about 8 ppmv is just below 30 km. The low Arctic ozone amounts in the altitude region 24–32 km reflect the climatological minimum of total ozone in autumn. Different from the stratosphere there is a clear variation in the mesosphere, with nearly disappearing 25
daytime ozone and nighttime mixing ratios of up to 2 ppmv around 60◦and −60◦. This is the tertiary ozone maximum just equatorward of the polar night terminator (Marsh et al., 2001).
ACPD
5, 12031–12066, 2005 Retrieval of stratospheric ozone from MIPAS N. Glatthor et al. Title Page Abstract Introduction Conclusions References Tables Figures J I J I Back CloseFull Screen / Esc
Print Version Interactive Discussion
EGU Figure2shows the total estimated ozone retrieval error and the major error
compo-nents for a polar (left) and a tropical geolocation (right). This error estimation is based on the actual retrieved temperatures, tangent heights, ozone mixing ratios, simulated spectra and Jacobians of the final iteration (cf. Glatthor et al., 2004). The total error exceeds 0.2 ppmv in the altitude region 20 to 50 km and reaches maximum values of 5
0.65 ppmv for the polar and of 1.2 ppmv for the tropical geolocation. In both cases the maximum noise error is 0.2 ppmv. In relative units, the total error is around 10% and the noise error is below 4% in the altitude region from 10 to 45 km at the polar geolo-cation. At the tropical geolocation, the relative total error is between 5% and 10% in the height region between 25 and 50 km, whereas the relative noise error is below 3%. 10
In both cases, the estimated uncertainty in spectroscopic data (line intesity and half-width) is the dominant error source. Further important error sources are uncertainties in the retrieved temperatures and tangent altitudes, in spectral gain calibration and in the assumed instrumental line shape (ILS).
3. Sensitivity studies
15
3.1. Influence of the a-priori profile
Retrievals based on climatological a-priori profiles have the tendency to map the shape of the a-priori to the results. To assess the influence of different a-priori profiles on the ozone retrieval, two tests were performed: First, the O3 a-priori profile from northern mid-latitudes (20◦to 65◦) was used for all other latitude bands as well. Secondly, a zero 20
a-priori profile was taken for all latitudes. In both cases the differences to the ozone reference retrieval are below ±0.2 ppmv (Fig.3), which in the altitude region 25–45 km is small in comparison to the total retrieval error (cf. Fig. 2). Below and above this altitude range the differences are of the same order as the the retrieval error. Since the use of a zero a-priori profile proved equivalent to a climatological profile, whereas 25
ACPD
5, 12031–12066, 2005 Retrieval of stratospheric ozone from MIPAS N. Glatthor et al. Title Page Abstract Introduction Conclusions References Tables Figures J I J I Back CloseFull Screen / Esc
Print Version Interactive Discussion
EGU use it for future ozone retrievals. However, climatological ozone profiles will further be
applied as first guess in order to save iterations.
3.2. Influence of the treatment of background continuum emission
The basic IMK strategy is to retrieve the background continuum emission per altitude and per microwindow simultaneously to the ozone abundancy. In this section we as-5
sess the effect of assigning one single value of background continuum emission to several spectrally adjacent microwindows of a certain tangent altitude. By this tech-nique the number of retrieval variables and thus the computational burden can be con-siderably reduced. As long as the continuum radiance is only weakly dependent on wavenumber over the size of the related microwindow subset, this procedure should 10
not significantly influence the retrieval results. Here the effect of retrieving, per tangent altitude, one continuum radiance to microwindows within a 5 cm−1 spectral range is compared to the reference retrieval presented in Fig.1, where an individual continuum emission was assigned to every microwindow. Applied to the microwindow set pre-sented in Table 1, this means that microwindows 1 and 2 as well as 3 and 4 each share 15
a common continuum profile.
In our test this approach generally causes differences of less than ±0.2 ppmv in the altitude region 15–40 km (Fig.4). Somewhat larger deviations of up to −0.3 ppmv occur in the Antarctic region at 32 km, where, different from all altitudes below, microwindows 1 and 2 as well as 3 and 4 are all included in the microwindow set (cf. Table 1). Thus the 20
different approaches of the continuum-fit have the largest effect here. The differences are all smaller than the estimated retrieval error (cf. Fig.2). Thus a common continuum retrieval for adjacent microwindows does not significantly change the O3retrieval result and will be applied to save computation time.
ACPD
5, 12031–12066, 2005 Retrieval of stratospheric ozone from MIPAS N. Glatthor et al. Title Page Abstract Introduction Conclusions References Tables Figures J I J I Back CloseFull Screen / Esc
Print Version Interactive Discussion
EGU 3.3. Influence of the cloud-index
The signal obtained by MIPAS from the lower atmosphere is often contaminated by tropospheric or polar stratospheric clouds, by what errors in the retrieval of trace gas amounts at these altitudes are triggered. Therefore spectra from tangent altitudes below 30 km are checked by a cloud-detection algorithm, which calculates the ra-5
tio between the measured radiances in the wavenumber ranges 788.2–796.25 and 832.3–834.4 cm−1. This ratio, the so-called cloud-index, decreases with increasing cloud-contamination (Spang et al., 2004). For ozone data versions V2 O3 2 and lower, spectra with cloud-indices below 1.8 were excluded from the measurement vector. The same value is used in the operational data analysis under ESA responsibility. However 10
it turned out that this value was often not sufficient for exclusion of spectra contami-nated by thin upper tropospheric or polar stratospheric clouds. Therefore we decided to increase the threshold to 4, mainly to improve the retrieval of tropospheric source gases, like N2O, CH4or CFCs. Figure5shows the difference in retrieved ozone using the high and low cloud-index along with the lowermost tangent altitudes taken into ac-15
count by application of the low (red curve) and the enhanced cloud-index (black curve). It is evident that the influence on the retrieved stratospheric ozone amounts is very small in most regions. Between 10◦and −20◦in the dayside tropics, where the number of tangent altitudes additionally excluded because of the increased cloud threshold is largest, there are stratospheric differences of up to −0.15 ppmv. Therefore, and to be 20
consistent to source gas retrievals, the cloud index 4 will also be used for future ozone retrievals.
3.4. Influence of the regularization strength
Since the retrieval grid used at IMK has a much finer height spacing than the vertical tangent height distance (cf. Sect. 2.1), a constraint has to be applied for the retrieval of 25
ACPD
5, 12031–12066, 2005 Retrieval of stratospheric ozone from MIPAS N. Glatthor et al. Title Page Abstract Introduction Conclusions References Tables Figures J I J I Back CloseFull Screen / Esc
Print Version Interactive Discussion
EGU retrievals at IMK is implemented as follows
R= BLTLB, (2)
whereR (cf. Eq. 1) is the regularization matrix, L is Tikhonov’s first-derivative operator
(Steck, 2002) andB is a diagonal matrix containing the regularization strength, varying
with altitude z approximately ∼1/VMR(z). For each trace gas, VMR is the volume mixing 5
ratio of a climatological profile. This constraint tends to drive the retrieval towards the shape of the a-priori profile, if the measurement contains only little information on the target variable. However, in case of adequate regularization, the retrieved trace gas profiles are supposed to be virtually independend of the a-priori assumption in altitude regions, where the measurement contains substantial information. This is the case for 10
ozone over the major part of the MIPAS limb scan. On the other hand, uncorrected systematic errors like the gain-oscillations between spectra from subsequent tangent heights, which occured in the first version of level-1B datasets produced from MIPAS measurements before 18 September, 2002, required stronger regularization, which may lead to over-regularization of retrievals when applied to later measurements of 15
higher quality. The appropriateness of the strength of the smoothing constraint can be estimated from the height resolution or degrees of freedom of the retrieved profiles (Rodgers, 2000; Steck, 2002).
The regularization strength, calculated for a certain geolocation, is used for evalua-tion of all measurements along the whole orbit. This leads to a number of degrees of 20
freedom dr, defined as trace of the averaging kernelA (cf. Steck, 2002)
dr = tr(A), (3)
which is slightly varying with latitude because of change of the atmospheric conditions. The ideal number of degrees of freedom attainable for a trace gas with significant signatures at each tangent altitude of the standard MIPAS scan is approximately 17. 25
Figure6(top) shows the number of degrees of freedom resulting from the reference retrieval (black curve). For better comparison of the different scans the degrees of
ACPD
5, 12031–12066, 2005 Retrieval of stratospheric ozone from MIPAS N. Glatthor et al. Title Page Abstract Introduction Conclusions References Tables Figures J I J I Back CloseFull Screen / Esc
Print Version Interactive Discussion
EGU freedom have been multiplied by the ratio of the number of tangents of the full
MI-PAS scan (17) and the number of tangents actually used after removal of corrupted or cloud-contaminated spectra (cf. Sect. 3.3). The degrees of freedom for the refer-ence case vary between 11.7 at Arctic and 13.8 at Antarctic latitudes, which indicates that the chosen constraint (Fig.6, middle), might be somewhat too strong. An over-5
regularization is also expressed by the scan-averaged height resolution of 4.51 km for the altitude region 15–50 km (Table 4, first row), which is coarser than the height dis-tance of 3 km between the lowermost 13 tangent altitudes and the vertical field-of-view of MIPAS of about 3 km. As already mentioned above, this regularization was orig-inally chosen to suppress oscillations in the retrieved profiles caused by systematic 10
calibration differences between level-1B spectra of subsequent tangent altitudes. The calibration problem has been reduced in level-1B spectra produced after September 2002 and in all re-calibrated spectra, justifying the definition of a weaker regularization in the context of this study. For this purpose, we decreased the regularization strength by 33% between 20 and 50 km and considerably more in the altitude regions below 20 15
and above 50 km (Fig.6, middle) to assure best possible detection of ozone signatures in the upper troposphere/lower stratosphere region and in the upper stratosphere. This regularization results in 15–17 degrees of freedom (Fig.6, top) and sometimes leads to oscillations or unrealistic gradients in the upper stratosphere in single profiles with little information content, but assures that no information is smoothed out. Figure 6 (bot-20
tom) shows, that in the altitude region 15–50 km the differences of the resulting ozone distribution from the standard retrieval are generally below ±0.3 ppmv. The differences below 15 km mainly occur at geolocations with no information content at this altitude region because of exclusion of tangent altitudes (cf. Sect. 3.3). The nighttime devia-tions above 60 km of up to 1 ppmv reflect a clearer detection of the tertiary nighttime 25
ozone maximum. However, the absolute VMRs at this high altitude have to be handled with some care because of possible NLTE-effects, which are not taken explicitely into account in IMK ozone retrieval (cf. Sect. 2.1). In summary, for the reasons given above the newly defined regularization will be applied to ozone retrievals version V3o O3 7
ACPD
5, 12031–12066, 2005 Retrieval of stratospheric ozone from MIPAS N. Glatthor et al. Title Page Abstract Introduction Conclusions References Tables Figures J I J I Back CloseFull Screen / Esc
Print Version Interactive Discussion
EGU (V3o is ESA level 1 data versions 4.61–4.62, processed offline at DFD, O3 7 is IMK
ozone retrieval setup 7) and higher.
3.5. Retrieval with latitude dependent microwindow sets
The retrieval results may depend on the microwindow selection because of inconsis-tencies of spectroscopic data for various spectral bands and different accurateness of 5
radiance calibration for different MIPAS bands due to a frequency dependent effect of ice coverage or cloud signals. Thus, to avoid artefacts in the latitudinal ozone distri-bution, which could result from switching from one microwindow set to another, MIPAS scans of all latitudinal bands have been analyzed with a polar microwindow set in the retrievals performed so far at IMK. This set had proven suitable for analysis of the 10
Antarctic major warming of September 2002 (Glatthor et al., 2005). In this section we investigate the influence of microwindows optimized for polar, midlatitude and tropical conditions on the ozone retrieval results.
The microwindow set optimized for polar conditions has already been described in Sect. 2.1. Its counterpart for mid-latitudes (Table 2) consists of 5 microwindows each 15
in MIPAS band A as well as in band AB and of 692 spectral gridpoints. In contrast to the polar and mid-latitude microwindows, the occupation matrix optimized for tropi-cal conditions has only 1 microwindow in band A, but 9 in band AB, and exhibits 764 gridpoints (Table 3). Whereas the other two OMs are rather compact, i.e. each mi-crowindow is generally used at many tangent altitudes, most of the mimi-crowindows of 20
the tropical OM are excluded in the middle stratosphere. The reason is the very cold tropical tropopause, by what the noise error in this region is significantly larger than in the other latitude bands. This causes a microwindow selection more focused to the tropopause region between 15 and 18 km. Most of the microwindows chosen for this altitude are obviously considered not suitable to further reduce the estimated retrieval 25
error between 24 and 39 km, mainly achieved with the first and ninth microwindow, and thus not used there.
oc-ACPD
5, 12031–12066, 2005 Retrieval of stratospheric ozone from MIPAS N. Glatthor et al. Title Page Abstract Introduction Conclusions References Tables Figures J I J I Back CloseFull Screen / Esc
Print Version Interactive Discussion
EGU cupation matrices and the reference retrieval (data version V2 O3 2) with the polar
occupation matrix (cf. Fig.1). In the latitude dependent case the polar microwindow selection was used for limb-scans at geolocations north of 60◦, the mid-latitude oc-cupation matrix for the latitude band 25◦–60◦, and the tropical occupation matrix for geographical latitudes 0◦–25◦ (analogously for the southern hemisphere). Thus, dif-5
ferences can by definition only occur at mid-latitudes and in the tropics. The resulting stratospheric deviations are up to −1.5 ppmv at midlatitudes in the altitude region 28– 34 km and up to 1.5 ppmv between 28 and 42 km in the tropics. The large deviations at mid-latitudes are mainly restricted to 55◦–35◦ (dayside), whereas those in the tropics extend over larger areas and occur both during day (20◦ to −25◦) and night (−25◦ to 10
10◦). These deviations in the altitude region of the ozone maximum are of the order of the total retrieval error (cf. Fig.2) and are caused by different sensitivity of different mi-crowindows to certain error sources. Further there are areas below 20 km and above 45 km with differences exceeding the estimated retrieval error for these altitudes (for the lower atmosphere not clearly visible on this colour scale).
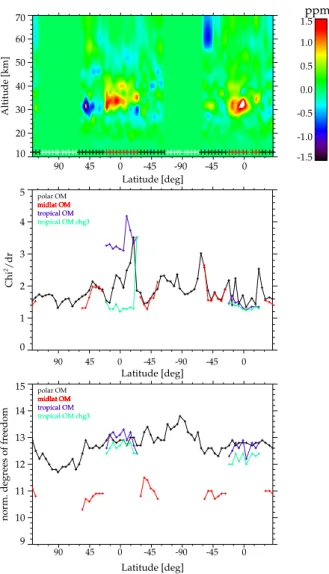
15
To identify the reason of the differences, the quality of the fits was checked by in-spection of the χn2 values of the different limb-scans, with χn2=χ2/dr (cf. Eqs. 1 and 3). χn2 defined in such a way is equal unity for an ideal retrieval with measurement noise as the only uncertainty, but becomes larger for realistic retrievals with additional error sources. In the middle panel of Fig.7the χn2values of the reference calculation and of 20
the retrievals with latitude-dependent occupation matrices are plotted against geoloca-tion. The χn2 values resulting from retrieval with the polar OM (black curve) are below 2 at Arctic geolocations, which indicates good fit quality. Except for one outlier near −65◦(nightside), they are around 2 in the Antarctic, also suggesting reasonable fits. At mid-latitudes both the polar and the midlatitude OM lead to similar χn2values generally 25
lower than 2. The χn2 values resulting from retrieval with both the polar and the tropi-cal OM (blue curve) indicate problems in the dayside tropics. However the χn2values associated to the tropical OM are considerably higher than those corresponding to the polar OM and extend up to more than 4, indicating worse fit results. After this
scan-ACPD
5, 12031–12066, 2005 Retrieval of stratospheric ozone from MIPAS N. Glatthor et al. Title Page Abstract Introduction Conclusions References Tables Figures J I J I Back CloseFull Screen / Esc
Print Version Interactive Discussion
EGU averaged inspection, the fit quality was checked for each microwindow and tangent
altitude individually at geolocations with high χn2-values or with larger VMR differences. Microwindows with χn2-values larger than 4 were considered not suitable and removed at the respective altitudes. Using this criterion, only microwindows 1 and 2 had to be removed at 12 km and 27–33 km, respectively, from the midlatitude OM, by what the 5
midlatitude deviations could not be decreased. In contrast, seven microwindows were removed from the tropical OM in the altitude region around 15 km, which except for one geolocation resulted in considerably improved scan-averaged χn2values in the dayside tropics (Fig.7, middle, green curve). However the tropical VMR-deviations in the prob-lematic region between 28 and 42 km were not reduced. Removal of microwindows at 10
tangent altitudes, where they exhibited χn2-values larger than 4, from the reference OM (not shown here) also caused no reduction of these differences. Thus, as performed in IMK standard retrievals, one fixed occupation matrix should be applied for evaluation of a whole orbit rather than different OMs to avoid latitude-band dependent artefacts.
We then investigated which of the latitude-dependent occupation matrices presented 15
above leads to the best representation of the “true” ozone distribution. A validation study performed by Wang et al. (2005) came to the result that in the height regions 20–30 km and 33–45 km the MIPAS ozone VMRs are generally higher by up to 0.3 and 0.4 ppmv, respectively, than measurements of the HALogen Occultation Exper-iment (HALOE) on the Upper Atmospheric Research Satellite (UARS), whereas they 20
are slightly lower (up to −0.2 ppmv) between 30 and 33 km. In the same study, a similar difference was found between ozone VMRs of MIPAS and the Sub-Millimeter Radiome-ter (SMR) on the Swedish polar-orbiting ODIN satellite (Murtagh et al., 2002). Since application of the tropical OM would amplify the differences above 33 km, we consider this OM less suitable than the standard OM. An additional argument against the tropi-25
cal OM is its approximately 300 m worse orbit- and altitude-averaged height resolution (Table 4, OM no. 4). Further, the typical total estimated error at a tropical geolocation is 1.1 ppmv for the standard retrieval, but 1.4 ppmv for retrieval with the tropical OM for the height region of the O3 VMR-maximum (not shown here). The larger error is
ACPD
5, 12031–12066, 2005 Retrieval of stratospheric ozone from MIPAS N. Glatthor et al. Title Page Abstract Introduction Conclusions References Tables Figures J I J I Back CloseFull Screen / Esc
Print Version Interactive Discussion
EGU mainly due to increased uncertainties in spectroscopic data, in gain calibration and in
temperature. Since the midlatitude OM results in lower ozone mainly around 32 km, it would lead to worse agreement between MIPAS and the other two satellite experi-ments in this altitude region. Further, Fig.7(bottom) shows that the number of degrees of freedom decreases by up to 2 by use of the mid-latitude OM in comparison to the 5
polar OM. Accordingly, the averaged height resolution resulting from the mid-latitude OM (Table 4, OM no. 3) is worse by 350 m and 1270 m for the altitude ranges 15–50 km and 6–68 km, respectively. For these reasons we consider the polar occupation matrix as best suitable of the latitude dependent OMs for retrieval of a whole orbit.
3.6. Retrieval with microwindows from different MIPAS spectral bands 10
The tropical OM, which leads to larger ozone maxima, in this altitude region contains nearly twice as many microwindows from MIPAS spectral band AB (1020–1170 cm−1) than from band A (685–970 cm−1), whereas it is the other way round for the polar refer-ence OM (cf. Tables 1 and 3). To check for a systematic bias between these two bands, orbit 8597 was analyzed with new occupation matrices restricted to band A and AB, re-15
spectively (Table 4, OMs no. 5 and 6). Like the reference occupation matrix, both OMs were optimized for polar conditions and consisted of 10 microwindows. In Sects. 3.6.1 and 3.6.2 we compare the results of retrievals using these occupation matrices with the standard retrieval, and in Sect. 3.6.3 we present the differences between retrievals with the band-restricted occupation matrices themselves.
20
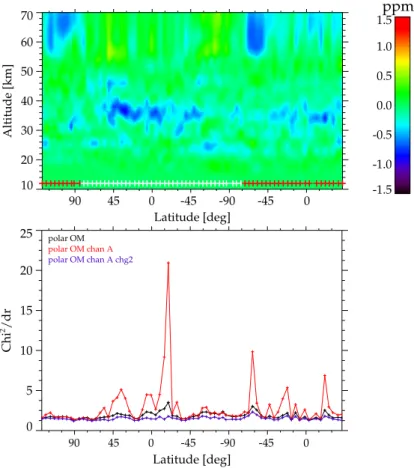
3.6.1. Retrieval with microwindows restricted to MIPAS band A versus reference
In the altitude region from 20 to 45 km, the strongest deviations between retrieval with microwindows restricted to MIPAS band A and the standard retrieval occur at dayside mid-latitudes and in the tropics, extending up to −1 ppmv (Fig.8, top), which is of the order of the total retrieval error. The largest deviations above 60 km are in the high-25
ACPD
5, 12031–12066, 2005 Retrieval of stratospheric ozone from MIPAS N. Glatthor et al. Title Page Abstract Introduction Conclusions References Tables Figures J I J I Back CloseFull Screen / Esc
Print Version Interactive Discussion
EGU OM restricted to band A (Fig.8, bottom) exhibits several peaks with rather high values
of up to 21 (red curve), which turned out to result mainly from bad fits of spectra from the lowermost tangent altitudes in two microwindows. The reason for the very poor fit in these microwindows is poor modelling of the actual H2O signature by the climatological H2O profile. Removal of these microwindows from the lowermost tangent altitudes 5
lead to strongly reduced χn2-values (blue curve), but as expected did hardly change the stratospheric differences to the reference retrieval. In summary, the polar occupation matrix restricted to MIPAS band A over wide areas results in systematically lower ozone maxima than the reference OM, which contains microwindows from MIPAS bands A and AB.
10
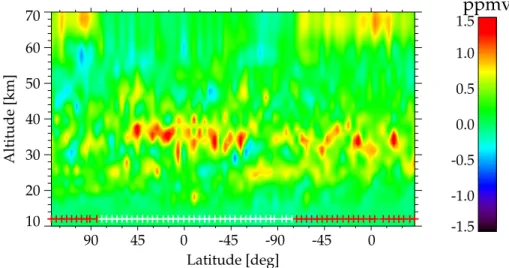
3.6.2. Retrieval with microwindows restricted to MIPAS band AB versus reference
The differences between retrieval with the occupation matrix restricted to band AB and the reference retrieval (Fig.9, top) extended up to ±1.5 ppmv or even more mainly in the polar and mid-latitude stratosphere, which exceeded the total retrieval error. The corresponding scan-averaged χn2-curve exhibited several maxima of up to more than 5, 15
indicating considerably worse fits than the χn2-values from the standard retrieval (Fig.9, middle, red and black curve). These problems resulted from poor fits nearly over the whole limb-scan in the microwindow at 1040.225–1040.65 cm−1 of the OM restricted to band AB. After this microwindow was removed below 53 km, the scan-averaged χn2 is considerably improved (Fig.9, middle). Further, differences to the reference retrieval 20
are strongly reduced in the altitude region 20-50 km (Fig.9, bottom), whereas the orbit-and scan-averaged height resolution orbit-and estimated storbit-andard deviation presented in Ta-ble 4 (OMs no. 6 and 7) are hardly changed. Thus, in this case the fit-quality and the agreement with the reference retrieval was strongly improved by removal of an inap-propriate microwindow without considerably decreased performance of the modified 25
ACPD
5, 12031–12066, 2005 Retrieval of stratospheric ozone from MIPAS N. Glatthor et al. Title Page Abstract Introduction Conclusions References Tables Figures J I J I Back CloseFull Screen / Esc
Print Version Interactive Discussion
EGU 3.6.3. Bias between ozone retrievals in MIPAS bands A and AB
Figure10 shows the differences between retrieval with the modified polar occupation matrix restricted to band AB (microwindow at 1040.225–1040.65 cm−1 removed be-low 53 km) and retrieval with the polar OM confined to band A. Especially at dayside mid-latitudes and in the tropics there are wide areas with positive differences of about 5
1 ppmv in the altitude region 28 to 42 km, indicating a positive bias between ozone amounts retrieved using microwindows from MIPAS band AB or A, respectively. As already outlined, the χn2-values resulting from retrieval with the modified occupation matrices from band A (Fig.8, bottom) as well as from band AB (Fig. 9, middle) are rather low and thus give no indication that the differences are caused by poor fits. 10
Another reason for the discrepancy could be different strengths of NLTE-effects, which are not included in IMK radiative transfer calculations, in these two MIPAS bands. How-ever, these effects are generally small in the stratosphere, and IMK microwindows are selected such that NLTE regions are avoided. As a check, NLTE-retrievals were per-formed at IAA with the same microwindows from bands A and AB. They resulted in 15
nearly the same positive bias as the LTE calculations, and thus neglection of NLTE-effects can be ruled out as reason for the differences.
Two further possible reasons for the discrepancy are a bias in radiance calibration between level-1B spectra from MIPAS bands A and AB or a spectroscopic bias between the major ozone bands used for retrieval in these bands, namely ozone band ν2(MIPAS 20
band A) or ozone bands ν1and ν3(MIPAS band AB). To check these assumptions, an-other retrieval was performed using ozone lines of the ν3band located in MIPAS band A between 960 and 970 cm−1. These lines are not contained in the above applied microwindow set from band A (Sect. 3.6.1), which exhibits ozone lines between 730 and 798 cm−1, with the most prominent signatures resulting from the ν2 band. Thus, 25
agreement of the retrieval result using the ν3lines between 960 and 970 cm−1with the result from the OM from band A would indicate a calibration problem, whereas agree-ment with the result from the OM from band AB would indicate a spectroscopic bias.
ACPD
5, 12031–12066, 2005 Retrieval of stratospheric ozone from MIPAS N. Glatthor et al. Title Page Abstract Introduction Conclusions References Tables Figures J I J I Back CloseFull Screen / Esc
Print Version Interactive Discussion
EGU This test indicated that the reason for the differences can be a calibration problem as
well as a spectroscopic bias, since the resulting ozone amounts did neither completely correspond with those obtained with the first microwindow set from band A nor with those resulting from the microwindows from MIPAS band AB.
4. Conclusions
5
We have investigated the dependance of O3 retrieval results from MIPAS spectra on modification of various processing parameters to check the applied processing base-line (version V2 O3 2) and to define an updated basebase-line, which will be used for ozone retrievals beginning from data version V3o O3 7. It turned out that the retrieved ozone amounts were not strongly influenced by change of most of the processing parame-10
ters. The resulting deviations from the reference were generally smaller than the total retrieval error, which amounted to 0.65 ppmv in the region of the polar and to 1.2 ppmv in the region of the tropical ozone maximum. However, change of the microwindow selection lead to deviations as large as the total retrieval error in the altitude region of the ozone maximum. The main features of the new baseline are as follows:
15
The retrieved O3 profiles were only little dependent on the shape of the O3 a-priori profiles, including an all zero a-priori profile. Thus we will apply the latter profile to future ozone retrievals to avoid any possible mapping of the structure of the a-priori profiles onto the result. Assuming the same background continuum radiance profile for adjacent microwindows within spectral intervals of 5 cm−1 lead to deviations of 20
up to ±0.3 ppmv from the reference calcualation (version V2 O3 2), where this sim-plification was not applied. Thus, this approach, which saves computation time, will be used. Moreover, a reduced regularization strength, defined to improve the overall height resolution and especially the detectability of ozone signatures in the lower and upper stratosphere, was successfully tested and will be applied in future. In the altitude 25
region 27–40 km, retrieval with microwindow sets optimized for mid-latitude and tropical conditions lead to deviations from the reference (microwindows for polar conditions) of
ACPD
5, 12031–12066, 2005 Retrieval of stratospheric ozone from MIPAS N. Glatthor et al. Title Page Abstract Introduction Conclusions References Tables Figures J I J I Back CloseFull Screen / Esc
Print Version Interactive Discussion
EGU up to −1.5 ppmv in a confined area of the dayside mid-latitudes and of up to 1.5 ppmv
over larger areas of the day- and nightside tropics. Thus, to avoid latitude-dependent artefacts, a fixed microwindow set should be chosen for retrieval of measurements from a whole orbit. On the basis of an initial validation study (Wang et al., 2005) and from comparison of height resolution and retrieval error the polar microwindows used so far 5
turned out to be best suitable and will furthermore be used.
In addition, we investigated a possible bias between retrieval results obtained with microwindows from MIPAS bands A and AB. Compared to the standard analysis, re-trieval with a polar occupation matrix restricted to band A lead to negative deviations in the 20–45 km altitude region, extending up to −1 ppmv at dayside mid-latitudes and in 10
the tropics. Even larger and more widespread deviations of up to ±1.5 ppmv from the reference, obtained with a polar occupation matrix restricted to band AB, could be con-siderably minimised after removal of a microwindow with especially bad performance from this occupation matrix. However, after this modification the ozone amounts result-ing from retrieval in band AB were still up to 1 ppmv higher than those resultresult-ing from 15
band A in the altitude region 28–42 km. Further investigations showed, that the reason for this discrepancy can either be a bias in radiance calibration between level-1B spec-tra of bands A and AB or a spectroscopic bias between ozone bands used for retrieval in bands A (ν2band) and AB (ν3and ν1bands).
Acknowledgements. The authors like to thank ESA for giving access to MIPAS level-1 data.
20
Meteorological analysis data have been provided by ECMWF. The IAA team has been partially supported by Spanish projects REN2001-3249/CLI and ESP2004–01556, and by EC FEDER funds.
References
Echle, G., von Clarmann, T., Dudhia, A., Flaud, J.-M., Funke, B., Glatthor, N., Kerridge, B., 25
ACPD
5, 12031–12066, 2005 Retrieval of stratospheric ozone from MIPAS N. Glatthor et al. Title Page Abstract Introduction Conclusions References Tables Figures J I J I Back CloseFull Screen / Esc
Print Version Interactive Discussion
EGU for data analysis of the Michelson Interferometer for Passive Atmospheric Sounding on the
Environmental Satellite, Appl. Opt., 39(30), 5531–5540, 2000.
European Space Agency: Envisat, MIPAS An instrument for atmospheric chemistry and cli-mate research, ESA Publications Division, ESTEC, P.O. Box 299, 2200 AG Noordwijk, The Netherlands, SP-1229.
5
Fischer, H. and Oelhaf, H.: Remote sensing of vertical profiles of atmospheric trace con-stituents with MIPAS limb-emission spectrometers, Appl. Opt., 35(16), 2787–2796, 1996. Gil-L ´opez, S., von Clarmann, T., Funke, B., Garc´ia-Comas, M., Glatthor, N., Grabowski, U.,
H ¨opfner, M., Kaufmann, M., Koukouli, M. E., L ´opez-Puertas, M., and Stiller, G. P.: Retrieval of stratospheric and mesospheric O3from high resolution MIPAS spectra at 15 and 10 µm, 10
Adv. Space Res., in press, 2005.
Glatthor, N., von Clarmann, T., Fischer, H., Funke, B., Grabowski, U., H ¨opfner, M., Kellmann, S., Kiefer, M., Linden, A., Milz, M., Steck, T., Stiller, G. P., Mengistu Tsidu, G., and Wang, D.-Y.: Spaceborne ClO observations by the Michelson Interferometer for Passive Atmospheric Sounding (MIPAS) before and during the Antarctic major warming in September/October 15
2002, J. Geophys. Res., 109(D11307), doi:10.1029/2003JD004440, 2004.
Glatthor, N., von Clarmann, T., Fischer, H., Funke, B., Grabowski, U., H ¨opfner, M., Kellmann, S., Kiefer, M., Linden, A., Milz, M., Steck, T., Stiller, G. P., Mengistu Tsidu, G., and Wang, D.-Y.: Mixing processes during the Antarctic vortex split in September/October 2002 as inferred from source gas and ozone distributions from MIPAS/ENVISAT, J. Atmos. Sci., 62, 787–800, 20
2005.
H ¨opfner, M., von Clarmann, T., Fischer, H., Funke, B., Glatthor, N., Grabowski, U., Kellmann, S., Kiefer, M., Linden, A., Mengistu Tsidu, G., Milz, M., Steck, T., Stiller, G. P., and Wang, D.-Y.: First spaceborne observations of Antarctic stratospheric ClONO2 recovery: Austral spring 2002, J. Geophys. Res., 109(D11), D11308, doi:10.1029/2004JD004609, 2004. 25
Marsh, D., Smith, A., Brasseur, G., Kaufmann, M., and Grossmann, K.: The existence of a tertiary ozone maximum in the high-latitude middle mesosphere, Geophys. Res. Lett., 28, 4531–4534, 2001.
Mengistu Tsidu, G., von Clarmann, T., Stiller, G. P., H ¨opfner, M., Fischer, H., Funke, B., Glatthor, N., Grabowski, U., Kellmann, S., Kiefer, M., Linden, A., Mengistu Tsidu, G., Milz, M., Steck, 30
T., and Wang, D.-Y.: Stratospheric N2O5 in the austral spring 2002 as retrieved from limb emission spectra recorded by the Michelson Interferometer for Passive Atmospheric Sound-ing (MIPAS), J. Geophys. Res., 109, D18301, doi:10.1029/2004JD004856, 2004.
ACPD
5, 12031–12066, 2005 Retrieval of stratospheric ozone from MIPAS N. Glatthor et al. Title Page Abstract Introduction Conclusions References Tables Figures J I J I Back CloseFull Screen / Esc
Print Version Interactive Discussion
EGU Murtagh, D., Frisk, U., Merino, F., Ridal, M., Jonsson, A., Stegman, J., Witt, G., Eriksson, P.,
Jim ´enez, C., Megie, G., de la N ¨oe, J., Ricaud, P., Baron, P., Pardo, J. R., Hauchcorne, A., Llewellyn, E. J., Degenstein, D. A., Gattinger, R. L., Lloyd, N. D., Evans, W. F. J., McDade, I. C., Haley, C. S., Sioris, C., von Savigny, C., Solheim, B. H., McConnell, J. C., Strong, K., Richardson, E. H., Leppelmeier, G. W., Kyr ¨ol ¨a, E., Auvinen, H., and Oikarinen, L.: An 5
overview of the Odin atmospheric mission, Can. J. Phys., 80, 309–319, 2002.
Nett, H., Perron, G., Sanchez, M., Burgess, A., and Mossner, P.: MIPAS inflight calibration and processor validation, in: ENVISAT Calibration Review – Proc. of the European Workshop, 9– 13 September 2002, ESTEC, Noordwijk, The Netherlands, CD-ROM, vol. SP-520, edited by: Sawaya-Lacoste, H., ESA Publications Division, ESTEC, Postbus 299, 2200 AG Noordwijk, 10
The Netherlands, 2002.
Rodgers, C. D.: Inverse Methods for Atmospheric Sounding: Theory and Practice, vol. 2 of Se-ries on Atmospheric, Oceanic and Planetary Physics, edited by: F. W. Taylor, World Scientific, 2000.
Spang, R., Remedios, J. J., and Barkley, M. P.: Colour indices for the detection and differenti-15
ation of cloud types in infra-red limb emission spectra, Adv. Space Res., 33(7), 1041–1047, 2004.
Steck, T.: Methods for determining regularization for atmospheric retrieval problems, Appl. Opt., 41(9), 1788–1797, 2002.
von Clarmann, T. and Echle, G.: Selection of optimized microwindows for atmospheric spec-20
troscopy, Appl. Opt., 37(33), 7661–7669, 1998.
von Clarmann, T., Ceccherini, S., Doicu, A., Dudhia, A., Funke, B., Grabowski, U., Hilgers, S., Jay, V., Linden, A., L ´opez-Puertas, M., Mart´ın-Torres, F.-J., Payne, V., Reburn, J., Ridolfi, M., Schreier, F., Schwarz, G., Siddans, R., and Steck, T.: A blind test retrieval experiment for infrared limb emission spectrometry, J. Geophys. Res. 108(D23), 4746, 25
doi:10.1029/2003JD003835, 2003a.
von Clarmann, T., Fischer, H., Funke, B., Glatthor, N., Grabowski, U., H ¨opfner, M., Kellmann, S., Kiefer, M., Linden, A., Mengistu Tsidu, G., Milz, M., Steck, T., Stiller, G. P., Wang, D.-Y., Gil-L ´opez, S., and L ´opez-Puertas, M.: Retrieval of temperature and tangent altitude pointing from limb emission spectra recorded from space by the michelson interferometer for passive 30
atmospheric sounding (MIPAS), J. Geophys. Res., 108(D23), doi:10.1029/2003JD003602, 2003b.
ACPD
5, 12031–12066, 2005 Retrieval of stratospheric ozone from MIPAS N. Glatthor et al. Title Page Abstract Introduction Conclusions References Tables Figures J I J I Back CloseFull Screen / Esc
Print Version Interactive Discussion
EGU M., Kellmann, S., Kiefer, M., Linden, A., Mengistu Tsidu, G., Milz, M., Steck, T., Wohnsiedler,
S., L ´opez-Puertas, M., Funke, B., Gil-L ´opez, S., Kaufmann, M., Koukouli, M. L., Murtagh, D., Lauti ´e, N., Jim ´enez, C., Jones, A., Eriksson, P., Urban, J., de La No ¨e, J., Le Flochmo ¨en, ´E., Dupuy, ´E., Ricaud, P., Olberg, M., Frisk, U., Russell III, J., and Remsberg, E.: Comparison of MIPAS/ENVISAT ozone profiles with SMR/ODIN and HALOE/UARS observations, Adv. 5
ACPD
5, 12031–12066, 2005 Retrieval of stratospheric ozone from MIPAS N. Glatthor et al. Title Page Abstract Introduction Conclusions References Tables Figures J I J I Back CloseFull Screen / Esc
Print Version Interactive Discussion
EGU
Table 1. Microwindow set optimized for a polar atmosphere, used for standard ozone retrieval.
The left column shows the spectral regions of the different microwindows. The logical matrix in the right column (so-called occupation matrix) defines, at which heights between 6 and 68 km the respective microwindow is used (T) or not used (=). Heights increase from left to right, and height labels 06 to 68 km are denoted vertically in the first two rows.
Microwindow Altitude coverage cm−1 6-68 km 00111222333344566 69258147036927208 741.675 - 741.825 ====T====TTTTTTT= 744.950 - 745.125 =TTTTTTTTTTTTTTTT 757.900 - 758.000 ==TTTTTTTTTTT===T 759.225 - 761.650 TTTT==TTTTTTTTTTT 764.800 - 764.950 T==TTTTTT==TT=TTT 798.450 - 798.650 ===TTTTTTTTTTTTTT 1062.325 - 1062.475 ====T=========TTT 1081.500 - 1081.600 TTTTT=TTTTTTTTTTT 1090.350 - 1090.475 TTTTT=TTTTTTTTTTT 1108.000 - 1108.350 TTT=T===TT=T=====
ACPD
5, 12031–12066, 2005 Retrieval of stratospheric ozone from MIPAS N. Glatthor et al. Title Page Abstract Introduction Conclusions References Tables Figures J I J I Back CloseFull Screen / Esc
Print Version Interactive Discussion
EGU
Table 2. Microwindow set optimized for a midlatitude atmosphere. For more details see Table 1.
Microwindow Altitude coverage cm−1 6-68 km 00111222333344566 69258147036927208 716.850 - 717.125 ==T=======TTTTTTT 717.950 - 718.050 ==T====TTTTTTTTTT 744.950 - 745.125 ==TTTTTTTTTTTT=TT 757.325 - 757.475 ==TTTTT=T=T=TTT=T 798.500 - 798.700 ===TT==T=T===TTTT 1076.200 - 1076.300 ==TTTTTTTTTTT=TTT 1080.450 - 1080.550 =TTTTT=====TT==TT 1090.225 - 1090.325 =T=TT==TTTTTT==== 1103.750 - 1104.025 =TTT=======TTTTTT 1129.325 - 1129.725 TT=T==========TTT
ACPD
5, 12031–12066, 2005 Retrieval of stratospheric ozone from MIPAS N. Glatthor et al. Title Page Abstract Introduction Conclusions References Tables Figures J I J I Back CloseFull Screen / Esc
Print Version Interactive Discussion
EGU
Table 3. Microwindow set optimized for a tropical atmosphere. For more details see Table 1.
Microwindow Altitude coverage cm−1 6-68 km 00111222333344566 69258147036927208 759.525 - 760.350 ==TTTTTTTTTTTTTTT 1027.575 - 1027.700 ===TTT=========TT 1033.625 - 1033.775 ===T==T==TT====TT 1042.125 - 1042.225 ==TTTTT=======T== 1042.800 - 1042.900 ===TT==========TT 1043.375 - 1043.550 TTTTTT=========T= 1045.350 - 1045.550 ==TTT==========TT 1068.675 - 1069.000 ===TT========TTTT 1099.700 - 1099.850 ====TTTTTTTTTTTTT 1103.750 - 1104.025 TTTTT======TTTTTT
ACPD
5, 12031–12066, 2005 Retrieval of stratospheric ozone from MIPAS N. Glatthor et al. Title Page Abstract Introduction Conclusions References Tables Figures J I J I Back CloseFull Screen / Esc
Print Version Interactive Discussion
EGU
Table 4. Characteristics and performance of different occupation matrices (OM) tested. The
second and third column indicate the atmosphere and MIPAS bands used for microwindow selection. Band A covers the 685–970 cm−1 and band AB the 1020–1170 cm−1 spectral re-gion. “No. of gridpts” is the total number of gridpoints of the microwindow sets and “Regul str” the applied regularization strength, whereupon “std” denotes application of the regularization strength of the reference and “new” of the newly defined retrieval setup. “Reso” and “ESD” are resulting orbit- and altitude-averaged height resolution and estimated standard deviation for the indicated altitude ranges.
OM Optimized MIPAS No. of Regul Reso ESD Reso ESD
for atm band gridpts str 15–50 km 15–50 km 6–68 km 6–68 km
1 polar A+AB 1429 std 4.51 0.12 6.25 0.09
2 polar A+AB 1429 new 4.30 0.15 6.05 0.12
3 midlat A+AB 692 std 4.86 0.14 7.52 0.11
4 trop A+AB 764 std 4.78 0.13 6.51 0.10
5 polar A 1630 std 4.53 0.12 7.26 0.11
6 polar AB 1220 std 4.84 0.13 6.74 0.10
ACPD
5, 12031–12066, 2005 Retrieval of stratospheric ozone from MIPAS N. Glatthor et al. Title Page Abstract Introduction Conclusions References Tables Figures J I J I Back CloseFull Screen / Esc
Print Version Interactive Discussion EGU
ppmv
0 2 4 6 8 10 12 Latitude [deg] 10 20 30 40 50 60 70 Altitude [km] 90 45 0 -45 -90 -45 0Fig. 1. Ozone distribution, derived from MIPAS limb-scans along orbit 8597 of 22 October 2003,
16:15–17:53 UT, plotted versus geographic latitude and altitude; result of standard retrieval with microwindows optimized for polar conditions; plus signs indicate the latitudinal locations of the limb-scans on the daytime (white signs) and nighttime part (red signs) of the orbit; the small white areas are retrieved volume mixing ratios below 0 ppmv (due to oscillations).
ACPD
5, 12031–12066, 2005 Retrieval of stratospheric ozone from MIPAS N. Glatthor et al. Title Page Abstract Introduction Conclusions References Tables Figures J I J I Back CloseFull Screen / Esc
Print Version Interactive Discussion
EGU
Fig. 2. O3retrieval error of standard retrieval for a polar (left) and a tropical (right) geolocation of the dayside part of orbit 8597. Solid curve: total error, dashed curve: total parameter error, dotted curve: random error, symbols (cf. legend, top to bottom): error caused by uncertainty in the N2O5amount, in temperature, in spectroscopic data, in the instrumental line-of-sight, in spectral shift, in gain calibration, and in the instrumental line shape.
ACPD
5, 12031–12066, 2005 Retrieval of stratospheric ozone from MIPAS N. Glatthor et al. Title Page Abstract Introduction Conclusions References Tables Figures J I J I Back CloseFull Screen / Esc
Print Version Interactive Discussion EGU ppmv -0.20 -0.10 0.00 0.10 0.20 Latitude [deg] 10 20 30 40 50 60 70 Altitude [km] 90 45 0 -45 -90 -45 0 ppmv -0.20 -0.10 0.00 0.10 0.20 Latitude [deg] 10 20 30 40 50 60 70 Altitude [km] 90 45 0 -45 -90 -45 0
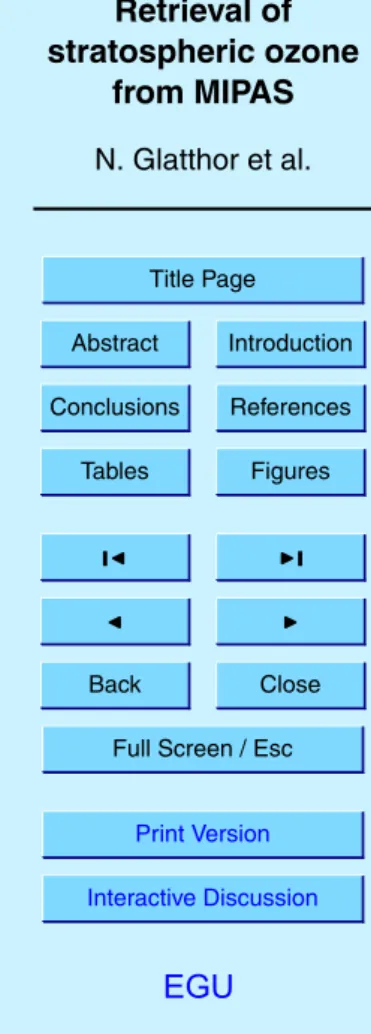
Fig. 3. Top: Difference between O3 retrieval with latitude-independent and retrieval with latitude-dependent a-priori profiles (standard retrieval). The latitude-independent profile is iden-tical to the northern mid-latitude profile. Bottom: Difference between O3retrieval with zero
a-priori profile and standard retrieval. White, black and red plus signs indicate polar, midlatitude and tropical geolocations, respectively.
ACPD
5, 12031–12066, 2005 Retrieval of stratospheric ozone from MIPAS N. Glatthor et al. Title Page Abstract Introduction Conclusions References Tables Figures J I J I Back CloseFull Screen / Esc
Print Version Interactive Discussion EGU
ppmv
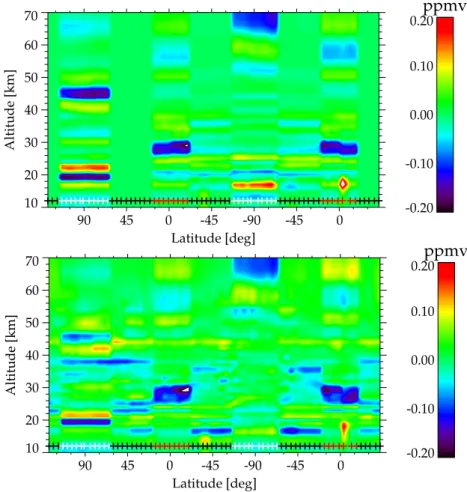
-0.20 -0.10 0.00 0.10 0.20 Latitude [deg] 10 20 30 40 50 60 70 Altitude [km] 90 45 0 -45 -90 -45 0Fig. 4. Difference between retrieval with assignment of a common continuum background
emission profile to adjacent microwindows within a 5 cm−1 spectral range and retrieval with individual continuum profiles for every microwindow. Same meaning of plus signs as in Fig.3.
ACPD
5, 12031–12066, 2005 Retrieval of stratospheric ozone from MIPAS N. Glatthor et al. Title Page Abstract Introduction Conclusions References Tables Figures J I J I Back CloseFull Screen / Esc
Print Version Interactive Discussion EGU
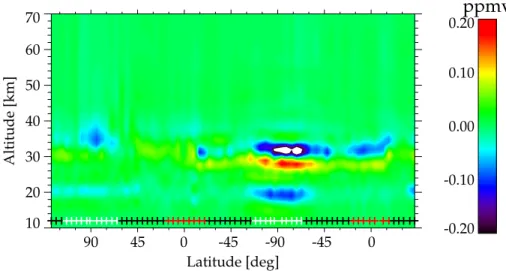
ppmv
-0.20 -0.10 0.00 0.10 0.20 Latitude [deg] 10 20 30 40 50 60 70 Altitude [km] 90 45 0 -45 -90 -45 0Fig. 5. Difference between retrieval with cloud-threshold 4.0 and 1.8. The red and black curves
show the lowermost tangent heights taken into account for retrieval after application of cloud-threshold 1.8 and 4.0, respectively. Same meaning of plus signs as in Fig.1.
ACPD
5, 12031–12066, 2005 Retrieval of stratospheric ozone from MIPAS N. Glatthor et al. Title Page Abstract Introduction Conclusions References Tables Figures J I J I Back CloseFull Screen / Esc
Print Version Interactive Discussion EGU Latitude [deg] 10 12 14 16 18
norm. degrees of freedom
90 45 0 -45 -90 -45 0 polar OM polar OM reg_new 1 10 100 1000 [1/ppmv] 0 10 20 30 40 50 60 70 Altitude [km] ppmv -0.4 -0.2 0.0 0.2 0.4 Latitude [deg] 10 20 30 40 50 60 70 Altitude [km] 90 45 0 -45 -90 -45 0
Fig. 6. Top: Normalized number
of degrees of freedom resulting from reference retrieval (black curve) and from retrieval with reduced regularization strength (red curve). Middle: Alti-tude dependance of regulariza-tion strength of reference re-trieval (black curve) and of newly defined regularization strength (red curve). Bottom: Difference between retrieval with reduced regularization strength and ref-erence retrieval. Same meaning of plus signs as in Fig.1.
ACPD
5, 12031–12066, 2005 Retrieval of stratospheric ozone from MIPAS N. Glatthor et al. Title Page Abstract Introduction Conclusions References Tables Figures J I J I Back CloseFull Screen / Esc
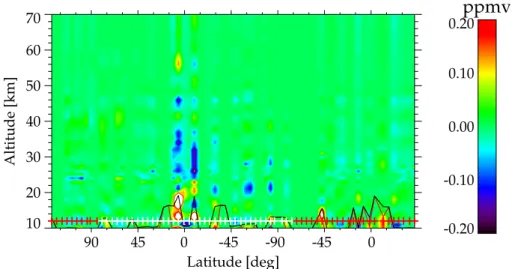
Print Version Interactive Discussion EGU ppmv -1.5 -1.0 -0.5 0.0 0.5 1.0 1.5 Latitude [deg] 10 20 30 40 50 60 70 Altitude [km] 90 45 0 -45 -90 -45 0 Latitude [deg] 0 1 2 3 4 5 Chi 2/dr 90 45 0 -45 -90 -45 0 polar OM midlat OM midlat OM midlat OM midlat OM midlat OM tropical OM tropical OM tropical OM chg3 tropical OM chg3 Latitude [deg] 9 10 11 12 13 14 15
norm. degrees of freedom
90 45 0 -45 -90 -45 0 polar OM midlat OM midlat OM midlat OM midlat OM midlat OM tropical OM tropical OM tropical OM chg3 tropical OM chg3
Fig. 7. Top: Deviations be-tween retrieval with different oc-cupation matrices (OMs) for po-lar, midlatitude and tropical lat-itudes and with the latitude-independent (polar) OM. Same meaning of plus signs as in Fig. 3. Middle: χ2/dr (dr = number of degrees of freedom) for polar OM (black curve), mid-latitude OM (red curves), cal OM (blue curves), and tropi-cal OM with microwindows with
χ2/dr>4 removed from tropical
OM (green curves). Bottom: Normalized number of degrees of freedom for the different OMs. Same meaning of colours as in (middle).
ACPD
5, 12031–12066, 2005 Retrieval of stratospheric ozone from MIPAS N. Glatthor et al. Title Page Abstract Introduction Conclusions References Tables Figures J I J I Back CloseFull Screen / Esc
Print Version Interactive Discussion EGU ppmv -1.5 -1.0 -0.5 0.0 0.5 1.0 1.5 Latitude [deg] 10 20 30 40 50 60 70 Altitude [km] 90 45 0 -45 -90 -45 0 Latitude [deg] 0 5 10 15 20 25 Chi 2 /dr 90 45 0 -45 -90 -45 0 polar OM polar OM chan A polar OM chan A chg2
Fig. 8. Top: Difference between retrieval with polar occupation matrix restricted to MIPAS band
A and reference polar OM (bands A and AB). Same meaning of plus signs as in Fig.1. Bottom: Limb-scan averaged χ2/dr for reference polar OM, polar OM restricted to band A and polar OM restricted to band A after removal of microwindows with high χ2/dr.
ACPD
5, 12031–12066, 2005 Retrieval of stratospheric ozone from MIPAS N. Glatthor et al. Title Page Abstract Introduction Conclusions References Tables Figures J I J I Back CloseFull Screen / Esc
Print Version Interactive Discussion EGU ppmv -1.5 -1.0 -0.5 0.0 0.5 1.0 1.5 Latitude [deg] 10 20 30 40 50 60 70 Altitude [km] 90 45 0 -45 -90 -45 0 Latitude [deg] 0 1 2 3 4 5 6 Chi 2/dr 90 45 0 -45 -90 -45 0 polar OM polar OM chan AB polar OM chan AB chg ppmv -1.5 -1.0 -0.5 0.0 0.5 1.0 1.5 Latitude [deg] 10 20 30 40 50 60 70 Altitude [km] 90 45 0 -45 -90 -45 0
Fig. 9. Top: Difference between
retrieval with polar occupation matrix restricted to MIPAS band AB and reference polar OM (bands A and AB). Same mean-ing of plus signs as in Fig. 1. Middle: χ2/dr for reference polar OM, polar OM restricted to band AB, and polar OM restricted to band AB after removal of MW 1040.225–1040.65 cm−1 below 53 km. Bottom: Difference between retrieval with modified (MW 1040.225–1040.65 cm−1 removed below 53 km) polar occupation matrix restricted to band AB and reference polar OM.
ACPD
5, 12031–12066, 2005 Retrieval of stratospheric ozone from MIPAS N. Glatthor et al. Title Page Abstract Introduction Conclusions References Tables Figures J I J I Back CloseFull Screen / Esc
Print Version Interactive Discussion EGU
ppmv
-1.5 -1.0 -0.5 0.0 0.5 1.0 1.5 Latitude [deg] 10 20 30 40 50 60 70 Altitude [km] 90 45 0 -45 -90 -45 0Fig. 10. Difference between retrieval with modified polar occupation matrix restricted to MIPAS
band AB (MW 1040.225–1040.65 cm−1 removed below 53 km) and with with polar occupation matrix confined to band A. Same meaning of plus signs as in Fig.1.