Supplement of Atmos. Chem. Phys., 17, 8411–8427, 2017 https://doi.org/10.5194/acp-17-8411-2017-supplement © Author(s) 2017. This work is distributed under the Creative Commons Attribution 3.0 License.
Supplement of
Understanding the primary emissions and secondary formation of gaseous
organic acids in the oil sands region of Alberta, Canada
John Liggio et al.
Correspondence to:John Liggio (john.liggio@canada.ca)
1
Methods.
Transformation Flights.
Transformation flights were designed as Lagrangian experiments such that air parcels in plumes were repeatedly sampled at different times (1 hour apart), by flying virtual screens (at multiple altitudes) up to 120km downwind of the OIL SANDS. There were no industrial emissions between the screens such that pollutant
5
differences between screens can be ascribed to a combination of photochemistry, dilution and deposition.
Meteorological parameters associated with the transformation flights are given in Liggio et al., 2016. In the current work, the secondary formation of organic acids and their evolution over time is investigated using primarily F19 (but also F20) as it was the most successful Lagrangian experiment, having the best agreement between air parcel transport times and aircraft flight times at each plume intercept (Liggio et al., 2016).
10
HR-ToF-CIMS Measurements.
The HR-ToF-CIMS sub-sampled air through a rear-facing (0.635 cm O.D., 0.580 I.D., 3 meter length) PFA Teflon (PFA) tube externally heated to 50 ºC and into the ion-molecule reaction (IMR) region of the CIMS via a critical orifice (1.7 L min-1). Acetate ions were generated by passing 10 mL min-1 of N2 over the headspace of a
15
diffusion vessel containing acetic anhydride, followed by dilution with N2 and ionization via a Po210 source. To reduce the residence time in the overall sampling manifold, the total flow was maintained at >15 L min-1, resulting in a residence time from the inlet to the HR-ToF-CIMS of less than 0.4 seconds. The IMR pressure was maintained at 60 mbar by constantly modulating the volume of air provided to the ambient pressure side of the IMR pump. Instrumental backgrounds were performed 3-5 times per flight for a duration of 5 minutes each, by diverting the
20
sample flow through a pair of acidic gas traps. These traps were comprised of nylon wool coated in a saturated solution of sodium bicarbonate, followed by activated carbon. The effective use of bicarbonate as an acid scrubber has been demonstrated previously (Veres et al., 2008; Yuan et al., 2016).
During sampling and calibrations, a constant flow of 1 mL min-1 containing a known gaseous concentration of isotopically labelled formic acid (C13) was also introduced into the HR-ToF-CIMS to correct for any dynamic
25
fluctuations in response factors. The detection limits for various organic acids was estimated to be approximately 2 – 10 pptv (2 level noise), with a 2 second time response. At higher altitudes (> ≈ 1500 m), the pressure of the IMR could not be reliably controlled due to pumping limitations, resulting in portions of the data at altitude being invalidated. The HR-ToF-CIMS was not operational during F7.
30
Other Supporting Measurements.
Refractory black carbon (rBC, also referred to as BC) measurements were conducted with a Single Particle Soot Photometer (SP2; Droplet Measurement Technologies, Boulder, CO, USA.). Extensive descriptions of the
2
principles of operation and its use in this and other aircraft applications have been given previously (Moteki and Kondo, 2010; Schwarz et al., 2006). Briefly, single BC particles were irradiated with an intra-cavity pump laser (1064 nm), heating the BC particles to >4000oC and resulting in BC incandescence which was monitored in the visible band (λ= 300-550 nm) and calibrated with regal black particles during this study (Cheng et al., 2017).
An extensive set of 154 volatile organic compounds (VOCs), including C2-C8 alkanes, branched alkanes,
5
alkenes, C6-C10 aromatics and halogenated hydrocarbons, were measured via on board canister sampling with subsequent offline analysis. Air samples were collected during flight into pre-cleaned and passivated 3L stainless steel canisters. Each canister was sampled for 20 seconds, with 20-65 integrated samples collected in a given flight mostly in plumes. The canisters were analyzed by off-line gas chromatography mass spectrometry (GC-MS) analysis. Full details with respect to canister sampling is described elsewhere (Li et al., 2017).
10
Nitrogen oxides (NO and NO2) were measured with separate chemiluminescence-based NO/NOx
instruments (TECO 42i-TL; Thermo Fisher Scientific, Waltham, MA, USA). One instrument was equipped with a photolytic converter (Air Quality Design Inc.) to selectively convert NO2 to NO followed by detection of NO. Data was recorded with a 1 second time resolution, and instrument zeros were performed 3-5 times per flight for a duration of ~5 minutes using in-line air purifiers. The conversion efficiency of the photolytic converter was
15
experimentally determined to be ~60%, which was applied to the final data. Ozone was measured with an absorption based O3 instrument (TECO 49i; Thermo Fisher Scientific, Waltham, MA, USA).
Topdown Emission Rate Retrieval Algorithm (TERRA).
For estimating primary emissions, the TERRA algorithm resolves air mass balance within the virtual box
20
and determines the mass fluxes across the walls to derive an emission rate for a pollutant based on the Divergence Theorem. The emission rate is determined using the following equation
M VD VT V HT H
E
E
E
E
E
E
E
(1)where the individual terms represent fluxes due to horizontal advection into and out of the box, horizontal turbulence, vertical advection, vertical turbulence, dry deposition, and air mass density change over the flight
25
duration.
The secondary organic acid formation rate (RFOrgAc ; for any single species) between any two virtual screens (in the absence of any other primary emissions downwind), can be derived as the transfer rate (ROrgAc) difference between the screens,
RFOrgAc ≈ ROrgAc(t2) – ROrgAc(t1) (2)
3
Where t represents the time associated with the various screens. Eq (2) ignores dry deposition, which implies that it is a lower limit to the actual organic acid formation rate during the measurement period. An estimate of the total LMWOA formation rate corrected for dry deposition is provided below. The total organic acid production rate (RFOrgAc) for any measured species in these flights is taken to be the transfer rate (ROrgAc) through the final screen after having removed the contribution to the transfer rate from primary organic acid emissions described above. This
5
contribution is typically small as described in section 3.2.1. The spatial extent of the oil sands plume (and the organic acid formation within these plumes) across any given screen is defined within TERRA using BC
measurements which are known to originate from mining activities in the oil sands, and whose background levels are negligible. The edge of the oil sands plume is approximately defined as where the BC concentration returns to background levels (≈0.05 g m-3). The total organic acid production over the course of the transformation flight is
10
further extrapolated to a photochemical day (ie: tonnes/day) by scaling to the available OH radical, in a manner described previously (Liggio et al., 2016).
Modifications to the MCM for organic acids.
Organic acids are included in the MCM as photochemical products of various VOC precursors. In addition
15
to the native MCM reactions, additional modifications were applied for formic and acetic acids. Specifically, previous recommendations with respect to formic acid were applied here (Yuan et al., 2015). These include updated yields from the ozonolysis and OH radical reactions of alkenes, aromatics, isoprene, terpenes, glycoaldehyde and hydroxyacetone, formation from vinyl alcohol oxidation and reaction of CH3O2 with OH, and the various branching ratios as reported previously (Yuan et al., 2015). Additional changes with respect to the acetic acid mechanism were
20
also made to the MCM following the approach of Yuan et al., 2015. Specifically, the acetic acid yield from the ozonolysis of propene was increased from 7.4% to 9.6% (Paulot et al., 2011), an acetic yield of 8% from OH reaction of hydroxyacetone was added (Butkovskaya et al., 2006) as a proxy for the yield from isoprene (Yuan et al., 2015), and a 7.5% yield from -pinene ozonolysis was added based on the work of Paulot et al., 2011. While yields of formic acid from OH reactions of aromatic species have been reported and hence added to the MCM (Yuan et al.,
25
2015), similar acetic acid yields are not readily available with the exception of one study for a single aromatic (TMB) (Wyche et al., 2009). However, several laboratory studies have since attributed much of the acetic acid signal detected in laboratory experiments to chamber wall off-gassing and/or fragmentation from larger molecular weight species (Müller et al., 2012; Praplan et al., 2014). Given the uncertainty in using the quantified yield value from a single study we have chosen not to include it here. The mechanisms for all other organic acids in the MCM
30
3.3 were not altered, primarily due to the lack of experimental data on specific yields from various precursors.
4
The hourly primary emissions of LMWOAs derived in Figure S-7 must be scaled up to a daily emission rate for comparison to daily VOC emissions estimates (Li et al., 2017) in Figure 7. However a simple 24 hour scaling factor may overestimate the total daily emissions. Hence, the approach of Li et al., 2016 is used to estimate the daily emissions of LMWOAs. This approach is simplified here, as the emissions are considered solely from mine fleet emissions. As shown in Li et al., 2016, the TERRA derived hourly emission rates are converted to daily
5
emission rates based on the diurnal changes in bitumen production. For mining trucks the hourly emission rate (Rm)
is related to the average hourly emission rate (𝑹𝒎 ), the hourly bitumen production q at the hour of measurement and
the 24-hour production p.
𝑹𝒎= 𝟐𝟒 ∗ 𝑹𝒎(
𝒒 𝒑)
Since production is accompanied by SO2 emissions, the ratio q/p may be derived as (𝒒
𝒑) = 𝑹𝑺𝑶𝟐 ∑ 𝑹𝑺𝑶𝟐
where 𝑹𝑺𝑶𝟐 is the hourly emission rate during aircraft measurement, and ∑𝑹𝑺𝑶𝟐is the daily SO2 emission rate. Thus,
10
a factor C, for converting hourly to daily emission rates, can be expressed as
𝑪 = 𝟐𝟒 ∗𝒒 𝒑∑ 𝒇𝒎 𝒏 𝒎=𝟏 =𝟐𝟒 ∗ 𝑹𝑺𝑶𝟐 ∑ 𝑹𝑺𝑶𝟐 ∑ 𝒇𝒎 𝒏 𝒎=𝟏
Where fm is the fractional contribution of the various sources in the facility to the total which scale with production.
In this case, fm = 1 (and n = 1) as only the mine fleet emissions are considered as the source of LMWOAs. Using
continuous emission monitoring (CEMS) data for SO2 from the facilities, the conversion factor C is derived as 0.92±0.18, 1.01±0.17, and 0.75±0.24 for Syncrude-ML, Suncor-MS, and CNRL-HOR respectively. For other
15
facilities no CEMS data for SO2 were available, and the average of production terms above is used to calculate C (0.9±0.2). Thus, a factor of 24/C is multiplied with the TERRA hourly emission rates to obtain the daily emission rates shown in Figure 5.
Accounting for LMWOA deposition losses during transformation flights.
While dry deposition of particles has been estimated to be small on these experimental time scales (Liggio
20
et al., 2016), it is expected that LMWOAs will be more severely dry deposited during the transformation flights than particles or non-oxygenated hydrocarbons, likely due to their higher water solubility which increases their potential to deposit to the surface (Nguyen et al., 2015). Reported deposition velocities for LMWOAs are highly limited; however regional modelling exercises have used a value of approximately 1 cm s-1 (Grosjean, 1992) for LMWOAs and recent measurements also indicate a value of ≈ 1 cm s-1 for formic acid over forest canopies (Nguyen et al.,
25
2015). These estimates are comparable to that of SO2 (Wu et al., 2016). Hence, in order to account for the dry deposition of LMWOAs here, their depositional loss is scaled to measured total sulfur loss (dominated by SO2) measured between the flight screens of F19 and F20. Using concurrent total sulfur (TS) measurements, the maximum dry deposition of total S over the region was estimated to be approximately 24±12 % hr-1 for F19 and
5
16±6 % hr-1 for F20, derived from the differences in the total S mass transfer rates across their respective screens. We assume that this relative rate of deposition of TS is applicable to LMWOA, which is then propagated through the calculation of the hourly (and hence total) LMWOA formation as described previously (Liggio et al., 2016) and in section 3.2.1. Accordingly, the daily LMWOA formation rate including deposition is estimated to be 288±58 and 226±45 tonnes day-1 for F19 and F20 respectively. Given the uncertainties associated with attempting to
5
indirectly derive a depositional loss for LMWOAs, these values are not discussed further or included in the
associated figures. However, this estimate indicates that total formation neglecting deposition, as depicted in Figure 7, should be considered a lower limit.
10
6
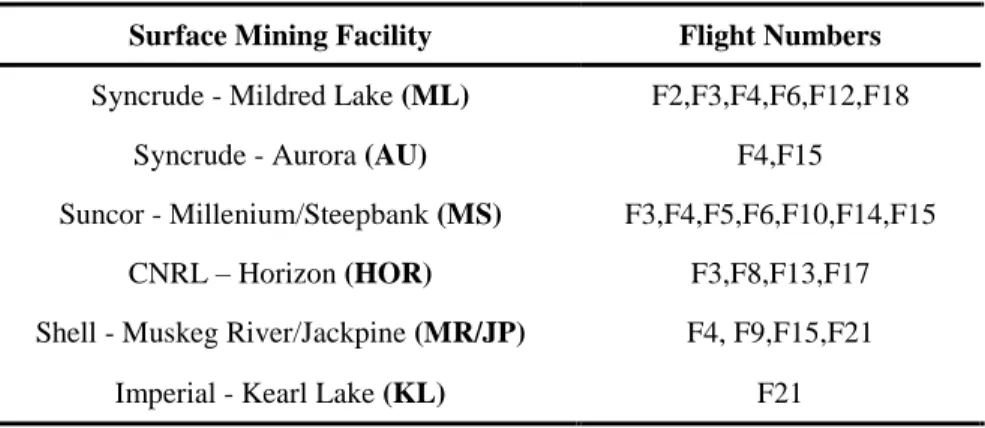
Table S-1: Emission flights associated with specific surface mining oil sands operations Surface Mining Facility Flight Numbers
Syncrude - Mildred Lake (ML) F2,F3,F4,F6,F12,F18
Syncrude - Aurora (AU) F4,F15
Suncor - Millenium/Steepbank (MS) F3,F4,F5,F6,F10,F14,F15
CNRL – Horizon (HOR) F3,F8,F13,F17
Shell - Muskeg River/Jackpine (MR/JP) F4, F9,F15,F21
Imperial - Kearl Lake (KL) F21
7
Figure S-1: Lagrangian plume intercepts of flight 19 used in subsequent box modelling. The Yellow shaded area for
plume intercepts 1 – 4 represent the same parcel of air sampled within approximately 1 minute of its arrival time based on the average wind speed, and approximately 1 hr apart. Various chemical species are shown during these intercepts, including a typical organic acid (C5H8O2), Black Carbon (BC), and organic aerosol as measured by the
5
8
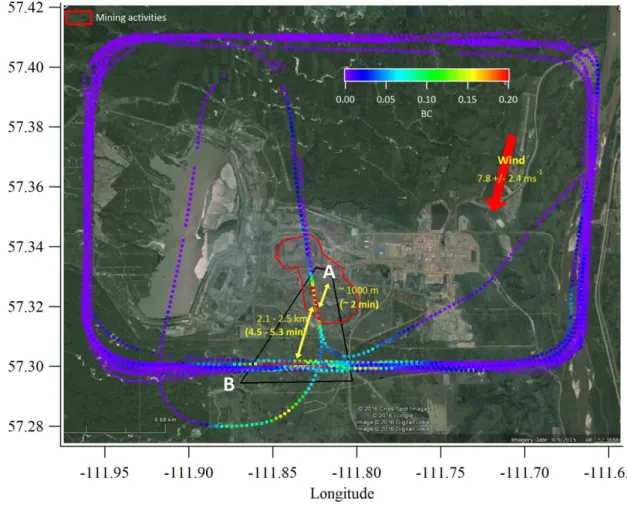
Figure S-2. Concentration of BC during emission flight 17 (CNRL) showing a transect (A) within the box and
closest to the mining emission source (red box). Time in brackets represents the approximate time between the
5
horizontal transects (A – B) or from the approximate center of the mine to the closest transect. The time is calculated based upon the average wind speed during this portion of the flight. The range in values is based upon differences in time calculated from the northern and southern most legs of transect B.
9
Figure S-3. Concentration of BC during emission flight 21 showing horizontal transects (A1 – F1) within the box
and closest to the mining emission source (red boxes). Mine at A1 = Syncrude-AU; Mine at A2 = Shell-JP. Time in brackets represents the approximate time between horizontal transects or from the approximate center of the mine to the closest transect. The time is calculated based upon the average wind speed during this portion of the flight. The
5
range in values is based upon differences in time calculated from the northern and southern most legs of transects A1 – F1.
10
Figure S-4. Ozone, NO and BC through screen A of flight 18 (Figure 3) closest to the open pit mining source
showing significant ozone titration via NO. Time in UTC.
11
Figure S-5. Individual LMWOA/BC (ie: emission ratios) for the measured organic acids from flights 17, 18, and 21 as depicted in the yellow highlighted region of Figure 4. Error bars represent 25th – 75th percentiles of the ratio data. Instrumental issues resulted in no formic acid data for flights 17, 18 and 21 (JP).
12
Figure S-6. Primary organic acid emissions (kg hr-1) derived using the LMWOA/BC emission ratios of Figure 5 and the quantified BC emissions from the various oil sands operations of Table S-1.
13
Figure S-7: A. Individual relative contributions to the total measured LMWOA primary mass emission rates
summed across all surface mining oil sands facilities. B. Individual relative contributions to the total estimated LMWOA secondary formation rates derived from F19.
14
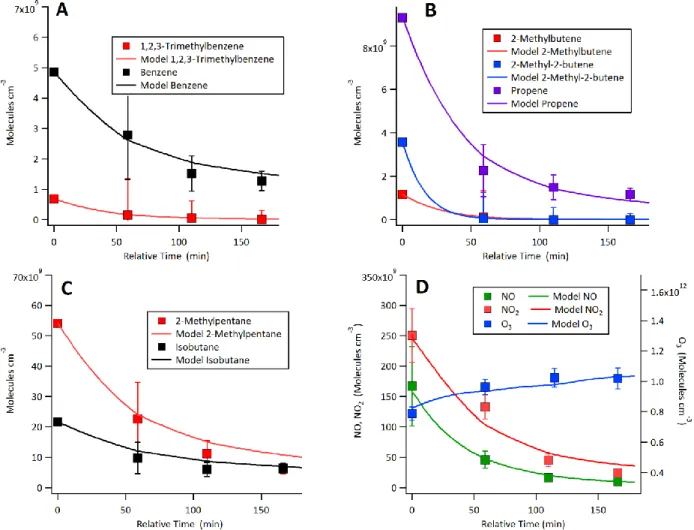
Figure S-8: Lagrangian box model – measurement comparison for select species during F19. A. Aromatic
15
References.
Butkovskaya, N. I., Pouvesle, N., Kukui, A., Mu, Y., and Bras, G. L.: Mechanism of the OH-Initiated oxidation of hydroxyacetone over the temperature range 236-298 K, Journal of Physical Chemistry A, 110, 6833-6843, 10.1021/jp056345r, 2006.
Cheng, Y., Li, S. M., Liu, P., Gordon, M., and Hayden, K.: Black carbon from the Canadian oil sands operations: size distributions and emission rates, Atmos. Chem. Phys. discuss., (in preparation) 2017.
Grosjean, D.: Formic acid and acetic acid: Emissions, atmospheric formation and dry deposition at two southern California locations, Atmospheric Environment Part A, General Topics, 26, 3279-3286, 10.1016/0960-1686(92)90343-J, 1992.
Li, S.-M., Leithead, A., Moussa, S. G., Liggio, J., Moran, M. D., Wang, D., Hayden, K., Darlington, A., Gordon, M., Staebler, R., Makar, P. A., Stroud, C., McLaren, R., Liu, P. S. K., O’Brien, J., Mittermeier, R., Marson, J. Z. G., Cober, S., Wolde, M., and Wentzell, J.: Differences between Measured and Reported Volatile Organic Compound Emissions from Oil Sands Facilities in Alberta, Canada Proc. Natl. Acad. Sci. U.S.A., (accepted), 2017.
Liggio, J., Li, S. M., Hayden, K., Taha, Y. M., Stroud, C., Darlington, A., Drollette, B. D., Gordon, M., Lee, P., Liu, P., Leithead, A., Moussa, S. G., Wang, D., O'Brien, J., Mittermeier, R. L., Brook, J. R., Lu, G., Staebler, R. M., Han, Y., Tokarek, T. W., Osthoff, H. D., Makar, P. A., Zhang, J., Plata, D. L., and Gentner, D. R.: Oil sands operations as a large source of secondary organic aerosols, Nature, 534, 91-94, 10.1038/nature17646, 2016.
Moteki, N., and Kondo, Y.: Dependence of laser-induced incandescence on physical properties of black carbon aerosols: Measurements and theoretical interpretation, Aerosol Sci. Technol., 44, 663-675,
10.1080/02786826.2010.484450, 2010.
Müller, M., Graus, M., Wisthaler, A., Hansel, A., Metzger, A., Dommen, J., and Baltensperger, U.: Analysis of high mass resolution PTR-TOF mass spectra from 1,3,5-trimethylbenzene (TMB) environmental chamber experiments, Atmos. Chem. Phys., 12, 829-843, 10.5194/acp-12-829-2012, 2012.
Nguyen, T. B., Crounse, J. D., Teng, A. P., Clair, J. M. S., Paulot, F., Wolfe, G. M., and Wennberg, P. O.: Rapid deposition of oxidized biogenic compounds to a temperate forest, Proc. Natl. Acad. Sci. U.S.A., 112, E392-E401, 10.1073/pnas.418702112, 2015.
Paulot, F., Wunch, D., Crounse, J. D., Toon, G. C., Millet, D. B., Decarlo, P. F., Vigouroux, C., Deutscher, N. M., Abad, G. G., Notholt, J., Warneke, T., Hannigan, J. W., Warneke, C., De Gouw, J. A., Dunlea, E. J., De Mazière, M., Griffith, D. W. T., Bernath, P., Jimenez, J. L., and Wennberg, P. O.: Importance of secondary sources in the atmospheric budgets of formic and acetic acids, Atmos. Chem. Phys., 11, 1989-2013, 10.5194/acp-11-1989-2011, 2011.
Praplan, A. P., Hegyi-Gaeggeler, K., Barmet, P., Pfaffenberger, L., Dommen, J., and Baltensperger, U.: Online measurements of water-soluble organic acids in the gas and aerosol phase from the photooxidation of 1,3,5-trimethylbenzene, Atmos. Chem. Phys., 14, 8665-8677, 10.5194/acp-14-8665-2014, 2014.
Schwarz, J. P., Gao, R. S., Fahey, D. W., Thomson, D. S., Watts, L. A., Wilson, J. C., Reeves, J. M., Darbeheshti, M., Baumgardner, D. G., Kok, G. L., Chung, S. H., Schulz, M., Hendricks, J., Lauer, A., Kärcher, B., Slowik, J. G., Rosenlof, K. H., Thompson, T. L., Langford, A. O., Loewenstein, M., and Aikin, K. C.: Single-particle measurements of midlatitude black carbon and light-scattering aerosols from the boundary layer to the lower stratosphere, J. Geophys. Res., 111, 10.1029/2006JD007076, 2006.
Veres, P., Roberts, J. M., Warneke, C., Welsh-Bon, D., Zahniser, M., Herndon, S., Fall, R., and de Gouw, J.: Development of negative-ion proton-transfer chemical-ionization mass spectrometry (NI-PT-CIMS) for the measurement of gas-phase organic acids in the atmosphere, Int. J. Mass spectrom., 274, 48-55,
10.1016/j.ijms.2008.04.032, 2008.
Wu, Z., Staebler, R., Vet, R., and Zhang, L.: Dry deposition of O<inf>3</inf> and SO<inf>2</inf> estimated from gradient measurements above a temperate mixed forest, Environmental Pollution, 210, 202-210,
10.1016/j.envpol.2015.11.052, 2016.
Wyche, K. P., Monks, P. S., Ellis, A. M., Cordell, R. L., Parker, A. E., Whyte, C., Metzger, A., Dommen, J., Duplissy, J., Prevot, A. S. H., Baltensperger, U., Rickard, A. R., and Wulfert, F.: Gas phase precursors to anthropogenic secondary organic aerosol: Detailed observations of 1,3,5-trimethylbenzene photooxidation, Atmos. Chem. Phys., 9, 635-665, 2009.
Yuan, B., Veres, P. R., Warneke, C., Roberts, J. M., Gilman, J. B., Koss, A., Edwards, P. M., Graus, M., Kuster, W. C., Li, S. M., Wild, R. J., Brown, S. S., Dubé, W. P., Lerner, B. M., Williams, E. J., Johnson, J. E., Quinn, P. K., Bates, T. S., Lefer, B., Hayes, P. L., Jimenez, J. L., Weber, R. J., Zamora, R., Ervens, B., Millet, D. B.,
16
Rappenglück, B., and De Gouw, J. A.: Investigation of secondary formation of formic acid: Urban environment vs. oil and gas producing region, Atmos. Chem. Phys., 15, 1975-1993, 10.5194/acp-15-1975-2015, 2015.
Yuan, B., Liggio, J., Wentzell, J., Li, S. M., Stark, H., Roberts, J. M., Gilman, J., Lerner, B., Warneke, C., Li, R., Leithead, A., Osthoff, H. D., Wild, R., Brown, S. S., and De Gouw, J. A.: Secondary formation of nitrated phenols: Insights from observations during the Uintah Basin Winter Ozone Study (UBWOS) 2014, Atmos. Chem. Phys., 16, 2139-2153, 10.5194/acp-16-2139-2016, 2016.