arXiv:1405.3964v1 [hep-ex] 15 May 2014
Measurement of the differential γ + 2 b-jet cross section and the ratio
σ(γ + 2 b-jets)/σ(γ + b-jet) in p ¯
p
collisions at
√s = 1.96 TeV
V.M. Abazov,31B. Abbott,67 B.S. Acharya,25 M. Adams,46 T. Adams,44 J.P. Agnew,41 G.D. Alexeev,31 G. Alkhazov,35 A. Altona,56 A. Askew,44 S. Atkins,54 K. Augsten,7 C. Avila,5 F. Badaud,10 L. Bagby,45 B. Baldin,45 D.V. Bandurin,73S. Banerjee,25 E. Barberis,55 P. Baringer,53J.F. Bartlett,45 U. Bassler,15 V. Bazterra,46 A. Bean,53M. Begalli,2 L. Bellantoni,45 S.B. Beri,23G. Bernardi,14R. Bernhard,19 I. Bertram,39 M. Besan¸con,15 R. Beuselinck,40 P.C. Bhat,45 S. Bhatia,58 V. Bhatnagar,23 G. Blazey,47 S. Blessing,44K. Bloom,59
A. Boehnlein,45 D. Boline,64 E.E. Boos,33 G. Borissov,39M. Borysoval,38 A. Brandt,70 O. Brandt,20 R. Brock,57 A. Bross,45 D. Brown,14 X.B. Bu,45 M. Buehler,45V. Buescher,21V. Bunichev,33 S. Burdinb,39 C.P. Buszello,37
E. Camacho-P´erez,28 B.C.K. Casey,45 H. Castilla-Valdez,28 S. Caughron,57 S. Chakrabarti,64 K.M. Chan,51 A. Chandra,72 E. Chapon,15G. Chen,53 S.W. Cho,27 S. Choi,27 B. Choudhary,24 S. Cihangir,45 D. Claes,59 J. Clutter,53 M. Cookek,45 W.E. Cooper,45 M. Corcoran,72 F. Couderc,15 M.-C. Cousinou,12 D. Cutts,69 A. Das,42 G. Davies,40 S.J. de Jong,29, 30 E. De La Cruz-Burelo,28 F. D´eliot,15 R. Demina,63 D. Denisov,45
S.P. Denisov,34 S. Desai,45 C. Deterrec,20 K. DeVaughan,59 H.T. Diehl,45 M. Diesburg,45 P.F. Ding,41 A. Dominguez,59 A. Dubey,24 L.V. Dudko,33 A. Duperrin,12 S. Dutt,23 M. Eads,47 D. Edmunds,57 J. Ellison,43V.D. Elvira,45 Y. Enari,14H. Evans,49 V.N. Evdokimov,34A. Faur´e,15 L. Feng,47 T. Ferbel,63 F. Fiedler,21 F. Filthaut,29, 30 W. Fisher,57 H.E. Fisk,45 M. Fortner,47 H. Fox,39 S. Fuess,45 P.H. Garbincius,45
A. Garcia-Bellido,63J.A. Garc´ıa-Gonz´alez,28 V. Gavrilov,32 W. Geng,12, 57 C.E. Gerber,46 Y. Gershtein,60 G. Ginther,45, 63 O. Gogota,38G. Golovanov,31 P.D. Grannis,64 S. Greder,16 H. Greenlee,45 G. Grenier,17 Ph. Gris,10J.-F. Grivaz,13 A. Grohsjeanc,15S. Gr¨unendahl,45M.W. Gr¨unewald,26 T. Guillemin,13G. Gutierrez,45
P. Gutierrez,67 J. Haley,68 L. Han,4 K. Harder,41A. Harel,63 J.M. Hauptman,52 J. Hays,40 T. Head,41 T. Hebbeker,18 D. Hedin,47 H. Hegab,68 A.P. Heinson,43 U. Heintz,69 C. Hensel,1 I. Heredia-De La Cruzd,28 K. Herner,45 G. Heskethf,41M.D. Hildreth,51 R. Hirosky,73T. Hoang,44J.D. Hobbs,64 B. Hoeneisen,9 J. Hogan,72
M. Hohlfeld,21 J.L. Holzbauer,58 I. Howley,70 Z. Hubacek,7, 15 V. Hynek,7 I. Iashvili,62 Y. Ilchenko,71 R. Illingworth,45A.S. Ito,45 S. Jabeenm,45 M. Jaffr´e,13A. Jayasinghe,67M.S. Jeong,27 R. Jesik,40P. Jiang,4 K. Johns,42 E. Johnson,57 M. Johnson,45A. Jonckheere,45 P. Jonsson,40 J. Joshi,43 A.W. Jung,45A. Juste,36 E. Kajfasz,12 D. Karmanov,33I. Katsanos,59 M. Kaur,23 R. Kehoe,71 S. Kermiche,12 N. Khalatyan,45 A. Khanov,68
A. Kharchilava,62 Y.N. Kharzheev,31 I. Kiselevich,32J.M. Kohli,23 A.V. Kozelov,34 J. Kraus,58 A. Kumar,62 A. Kupco,8 T. Kurˇca,17 V.A. Kuzmin,33S. Lammers,49 P. Lebrun,17 H.S. Lee,27 S.W. Lee,52W.M. Lee,45 X. Lei,42
J. Lellouch,14 D. Li,14H. Li,73L. Li,43 Q.Z. Li,45 J.K. Lim,27 D. Lincoln,45 J. Linnemann,57 V.V. Lipaev,34 R. Lipton,45 H. Liu,71 Y. Liu,4 A. Lobodenko,35 M. Lokajicek,8 R. Lopes de Sa,64 R. Luna-Garciag,28 A.L. Lyon,45A.K.A. Maciel,1 R. Madar,19 R. Maga˜na-Villalba,28S. Malik,59V.L. Malyshev,31 J. Mansour,20
J. Mart´ınez-Ortega,28 R. McCarthy,64 C.L. McGivern,41 M.M. Meijer,29, 30 A. Melnitchouk,45 D. Menezes,47 P.G. Mercadante,3M. Merkin,33A. Meyer,18J. Meyeri,20 F. Miconi,16N.K. Mondal,25 M. Mulhearn,73 E. Nagy,12
M. Narain,69 R. Nayyar,42 H.A. Neal,56 J.P. Negret,5 P. Neustroev,35 H.T. Nguyen,73 T. Nunnemann,22 J. Orduna,72 N. Osman,12 J. Osta,51 A. Pal,70 N. Parashar,50 V. Parihar,69 S.K. Park,27R. Partridgee,69 N. Parua,49A. Patwaj,65 B. Penning,45 M. Perfilov,33 Y. Peters,41 K. Petridis,41G. Petrillo,63 P. P´etroff,13
M.-A. Pleier,65 V.M. Podstavkov,45 A.V. Popov,34 M. Prewitt,72D. Price,41 N. Prokopenko,34 J. Qian,56 A. Quadt,20 B. Quinn,58 P.N. Ratoff,39 I. Razumov,34 I. Ripp-Baudot,16F. Rizatdinova,68 M. Rominsky,45
A. Ross,39C. Royon,15P. Rubinov,45 R. Ruchti,51 G. Sajot,11 A. S´anchez-Hern´andez,28 M.P. Sanders,22 A.S. Santosh,1 G. Savage,45 M. Savitskyi,38L. Sawyer,54T. Scanlon,40 R.D. Schamberger,64 Y. Scheglov,35 H. Schellman,48 C. Schwanenberger,41R. Schwienhorst,57 J. Sekaric,53 H. Severini,67 E. Shabalina,20 V. Shary,15
S. Shaw,41 A.A. Shchukin,34 V. Simak,7 P. Skubic,67 P. Slattery,63 D. Smirnov,51 G.R. Snow,59 J. Snow,66 S. Snyder,65 S. S¨oldner-Rembold,41L. Sonnenschein,18K. Soustruznik,6 J. Stark,11 D.A. Stoyanova,34M. Strauss,67
L. Suter,41 P. Svoisky,67 M. Titov,15 V.V. Tokmenin,31 Y.-T. Tsai,63D. Tsybychev,64B. Tuchming,15 C. Tully,61 L. Uvarov,35 S. Uvarov,35 S. Uzunyan,47 R. Van Kooten,49 W.M. van Leeuwen,29 N. Varelas,46 E.W. Varnes,42 I.A. Vasilyev,34A.Y. Verkheev,31 L.S. Vertogradov,31M. Verzocchi,45 M. Vesterinen,41 D. Vilanova,15 P. Vokac,7
M.R.J. Williams,49 G.W. Wilson,53 M. Wobisch,54 D.R. Wood,55 T.R. Wyatt,41 Y. Xie,45 R. Yamada,45 S. Yang,4 T. Yasuda,45 Y.A. Yatsunenko,31 W. Ye,64 Z. Ye,45 H. Yin,45 K. Yip,65 S.W. Youn,45 J.M. Yu,56
J. Zennamo,62 T.G. Zhao,41 B. Zhou,56 J. Zhu,56 M. Zielinski,63 D. Zieminska,49 and L. Zivkovic14 (The D0 Collaboration∗)
1LAFEX, Centro Brasileiro de Pesquisas F´ısicas, Rio de Janeiro, Brazil 2Universidade do Estado do Rio de Janeiro, Rio de Janeiro, Brazil
3Universidade Federal do ABC, Santo Andr´e, Brazil
4University of Science and Technology of China, Hefei, People’s Republic of China 5Universidad de los Andes, Bogot´a, Colombia
6Charles University, Faculty of Mathematics and Physics,
Center for Particle Physics, Prague, Czech Republic
7Czech Technical University in Prague, Prague, Czech Republic
8Institute of Physics, Academy of Sciences of the Czech Republic, Prague, Czech Republic 9Universidad San Francisco de Quito, Quito, Ecuador
10LPC, Universit´e Blaise Pascal, CNRS/IN2P3, Clermont, France 11LPSC, Universit´e Joseph Fourier Grenoble 1, CNRS/IN2P3,
Institut National Polytechnique de Grenoble, Grenoble, France
12CPPM, Aix-Marseille Universit´e, CNRS/IN2P3, Marseille, France 13LAL, Universit´e Paris-Sud, CNRS/IN2P3, Orsay, France 14LPNHE, Universit´es Paris VI and VII, CNRS/IN2P3, Paris, France
15CEA, Irfu, SPP, Saclay, France
16IPHC, Universit´e de Strasbourg, CNRS/IN2P3, Strasbourg, France
17IPNL, Universit´e Lyon 1, CNRS/IN2P3, Villeurbanne, France and Universit´e de Lyon, Lyon, France 18III. Physikalisches Institut A, RWTH Aachen University, Aachen, Germany
19Physikalisches Institut, Universit¨at Freiburg, Freiburg, Germany
20II. Physikalisches Institut, Georg-August-Universit¨at G¨ottingen, G¨ottingen, Germany 21Institut f¨ur Physik, Universit¨at Mainz, Mainz, Germany
22Ludwig-Maximilians-Universit¨at M¨unchen, M¨unchen, Germany 23Panjab University, Chandigarh, India
24Delhi University, Delhi, India
25Tata Institute of Fundamental Research, Mumbai, India 26University College Dublin, Dublin, Ireland
27Korea Detector Laboratory, Korea University, Seoul, Korea 28CINVESTAV, Mexico City, Mexico
29Nikhef, Science Park, Amsterdam, the Netherlands 30Radboud University Nijmegen, Nijmegen, the Netherlands
31Joint Institute for Nuclear Research, Dubna, Russia 32Institute for Theoretical and Experimental Physics, Moscow, Russia
33Moscow State University, Moscow, Russia 34Institute for High Energy Physics, Protvino, Russia 35Petersburg Nuclear Physics Institute, St. Petersburg, Russia
36Instituci´o Catalana de Recerca i Estudis Avan¸cats (ICREA) and Institut de F´ısica d’Altes Energies (IFAE), Barcelona, Spain 37Uppsala University, Uppsala, Sweden
38Taras Shevchenko National University of Kyiv, Kiev, Ukraine 39Lancaster University, Lancaster LA1 4YB, United Kingdom 40Imperial College London, London SW7 2AZ, United Kingdom 41The University of Manchester, Manchester M13 9PL, United Kingdom
42University of Arizona, Tucson, Arizona 85721, USA 43University of California Riverside, Riverside, California 92521, USA
44Florida State University, Tallahassee, Florida 32306, USA 45Fermi National Accelerator Laboratory, Batavia, Illinois 60510, USA
46University of Illinois at Chicago, Chicago, Illinois 60607, USA 47Northern Illinois University, DeKalb, Illinois 60115, USA
48Northwestern University, Evanston, Illinois 60208, USA 49Indiana University, Bloomington, Indiana 47405, USA 50Purdue University Calumet, Hammond, Indiana 46323, USA 51University of Notre Dame, Notre Dame, Indiana 46556, USA
52Iowa State University, Ames, Iowa 50011, USA 53University of Kansas, Lawrence, Kansas 66045, USA 54Louisiana Tech University, Ruston, Louisiana 71272, USA 55Northeastern University, Boston, Massachusetts 02115, USA
57Michigan State University, East Lansing, Michigan 48824, USA 58University of Mississippi, University, Mississippi 38677, USA
59University of Nebraska, Lincoln, Nebraska 68588, USA 60Rutgers University, Piscataway, New Jersey 08855, USA 61Princeton University, Princeton, New Jersey 08544, USA 62State University of New York, Buffalo, New York 14260, USA
63University of Rochester, Rochester, New York 14627, USA 64State University of New York, Stony Brook, New York 11794, USA
65Brookhaven National Laboratory, Upton, New York 11973, USA 66Langston University, Langston, Oklahoma 73050, USA 67University of Oklahoma, Norman, Oklahoma 73019, USA 68Oklahoma State University, Stillwater, Oklahoma 74078, USA
69Brown University, Providence, Rhode Island 02912, USA 70University of Texas, Arlington, Texas 76019, USA 71Southern Methodist University, Dallas, Texas 75275, USA
72Rice University, Houston, Texas 77005, USA 73University of Virginia, Charlottesville, Virginia 22904, USA
74University of Washington, Seattle, Washington 98195, USA
(Dated: May 15, 2014)
We present the first measurements of the differential cross section dσ/dpγ
T for the production of
an isolated photon in association with at least two b-quark jets. The measurements consider photons with rapidities |yγ
| < 1.0 and transverse momenta 30 < pγT< 200 GeV. The b-quark jets are required
to have pjetT > 15 GeV and |y jet
| < 1.5. The ratio of differential production cross sections for γ + 2 b-jets to γ + b-jet as a function of pγ
Tis also presented. The results are based on the proton-antiproton
collision data at√s =1.96 TeV collected with the D0 detector at the Fermilab Tevatron Collider. The measured cross sections and their ratios are compared to the next-to-leading order perturbative QCD calculations as well as predictions based on the kT-factorization approach and those from the
sherpaand pythia Monte Carlo event generators.
PACS numbers: 13.85.Qk, 12.38.Bx, 12.38.Qk
In hadronic collisions, high-energy photons (γ) emerge unaltered from the hard parton-parton interaction and therefore provide a clean probe of the underlying hard-scattering dynamics [1]. Photons produced in these in-teractions (called direct or prompt) in association with one or more bottom (b)-quark jets provide an important test of perturbative Quantum Chromodynamics (QCD) predictions at large hard-scattering scales Q and over a wide range of parton momentum fractions. In addition, the study of these processes also provides information about the parton density functions (PDF) of b quarks and gluons (g), which still have substantial uncertainties. In p¯p collisions, γ + b-jet events are produced primar-ily through the Compton process gb → γb, which
domi-∗with visitors from aAugustana College, Sioux Falls, SD, USA, bThe University of Liverpool, Liverpool, UK,cDESY, Hamburg, Germany, dUniversidad Michoacana de San Nicolas de Hidalgo, Morelia, MexicoeSLAC, Menlo Park, CA, USA,fUniversity Col-lege London, London, UK,gCentro de Investigacion en Computa-cion - IPN, Mexico City, Mexico,hUniversidade Estadual Paulista, S˜ao Paulo, Brazil, iKarlsruher Institut f¨ur Technologie (KIT) -Steinbuch Centre for Computing (SCC), D-76128 Karlsruhe, Ger-many,jOffice of Science, U.S. Department of Energy, Washington, D.C. 20585, USA,kAmerican Association for the Advancement of Science, Washington, D.C. 20005, USA, lKiev Institute for Nu-clear Research, Kiev, Ukraine andmUniversity of Maryland, Col-lege Park, Maryland 20742, USA.
nates for low and moderate photon transverse momenta (pγT), and through quark-antiquark annihilation followed by g → b¯b gluon splitting q¯q → γg → γb¯b, which domi-nates at high pγT [2, 3]. The final state with b-quark pair production, p¯p → γ+b¯b, is mainly produced via q¯q → γb¯b and gg → γb¯b scatterings [4]. The γ + 2 b-jet process is a crucial component of background in measurements of, for example, t¯tγ coupling [5] and in some searches for new phenomena. A series of measurements involving γ and b(c)-quark final states have previously been performed by the D0 and CDF Collaborations [3, 6–9].
In this measurement, we follow an inclusive approach by allowing the final state with any additional jet(s) on top of the studied b-quark jets. Inclusive γ + 2 b-jet pro-duction may also originate from partonic subprocesses involving parton fragmentation into a photon. However, using photon isolation requirements significantly reduces the contributions from such processes. Next-to-leading order (NLO) calculations of the γ + 2 b-jet production cross section, which includes all b-quark mass effects, have recently become available [4]. These calculations are based on the four-flavor number scheme, which as-sumes four massless quark flavors and treats the b quark as a massive quark not appearing in the initial state.
This letter presents the first measurement of the cross section for associated production of an isolated photon with a bottom quark pair in p¯p collisions. The results
are based on data corresponding to an integrated lumi-nosity of 8.7 ± 0.5 fb−1 [10] collected with the D0 detec-tor from June 2006 to September 2011 at the Fermilab Tevatron Collider at√s =1.96 TeV. The large data sam-ple and use of advanced photon and b-jet identification tools [11–13] enable us to measure the γ + 2 b-jet pro-duction cross section differentially as a function of pγT for photons with rapidities |yγ| < 1.0 and transverse mo-menta 30 < pγT < 200 GeV, while the b jets are required to have pjetT > 15 GeV and |yjet| < 1.5. This allows for probing the dynamics of the production process over a wide kinematic range not studied before in other mea-surements of a vector boson + b-jet final state. The ratio of differential cross sections for γ + 2 b-jet production rel-ative to γ + b-jet production is also presented in the same kinematic region and differentially in pγT. The measure-ment of the ratio of cross sections leads to cancellation of various experimental and theoretical uncertainties, al-lowing a more precise comparison with the theoretical predictions.
The D0 detector is a general purpose detector de-scribed in detail elsewhere [14]. The subdetectors most relevant to this analysis are the central tracking system, composed of a silicon microstrip tracker (SMT) and a central fiber tracker embedded in a 1.9 T solenoidal mag-netic field, the central preshower detector (CPS), and the calorimeter. The CPS is located immediately before the inner layer of the central calorimeter and is formed of approximately one radiation length of lead absorber fol-lowed by three layers of scintillating strips. The calorime-ter consists of a central section (CC) with coverage in pseudorapidity of |ηdet| < 1.1 [15], and two end calorime-ters (EC) extending coverage to |ηdet| ≈ 4.2, each housed in a separate cryostat, with scintillators between the CC and EC cryostats providing sampling of developing show-ers for 1.1 < |ηdet| < 1.4. The electromagnetic (EM) sec-tion of the calorimeter is segmented longitudinally into four layers (EMi, i = 1 − 4), with transverse segmen-tation into cells of size ∆ηdet× ∆φdet = 0.1 × 0.1 [15], except EM3 (near the EM shower maximum), where it is 0.05 × 0.05. The calorimeter allows for a precise mea-surement of the energy of electrons and photons, provid-ing an energy resolution of approximately 4% (3%) at an energy of 30 (100) GeV. The energy response of the calorimeter to photons is calibrated using electrons from Z boson decays. Because electrons and photons interact differently in the detector material before the calorime-ter, additional energy corrections as a function of pγT are derived using a detailed geant-based [16] simulation of the D0 detector response. These corrections are ≈ 2% for photon candidates of pγT = 30 GeV, and smaller for higher pγT.
The data used in this analysis satisfy D0 experiment data quality requirements and are collected using a com-bination of triggers requiring a cluster of energy in the EM calorimeter with loose shower shape requirements.
The trigger efficiency is ≈ 96% for photon candidates with pγT = 30 GeV and 100% for pγT & 40 GeV. Of-fline event selection requires a reconstructed p¯p interac-tion vertex [17] within 60 cm of the center of the detector along the beam axis. The efficiency of the vertex require-ment is ≈ (96 − 98)%, depending on pγT. The missing transverse momentum in the event is required to be less than 0.7pγT to suppress background from W → eν decays. Such a requirement is highly efficient (≥ 98%) for signal events.
The photon selection criteria in the current measure-ment are identical to those used in Refs. [3, 6]. The photon selection efficiency and acceptance are calculated using samples of γ + b-jet events, generated with the sherpa [18] and pythia [19] Monte Carlo (MC) event generators. The samples are processed through a geant-based [16] simulation of the D0 detector. Simulated events are overlaid with data events from random p¯p crossings to properly model the effects of multiple p¯p interactions and noise in data. We ensure that the in-stantaneous luminosity distribution in the overlay events is similar to the data. The efficiency for photons to pass the identification criteria is (71 − 82)% with relative sys-tematic uncertainty of 3%.
For the γ + n b measurement (n = 1, 2), n jets with the highest pT that satisfy pjetT > 15 GeV and |yjet|<1.5 are selected. Jets are reconstructed using the D0 Run II algorithm [20] with a cone radius of R = 0.5. A set of criteria is imposed to ensure that we have sufficient information to identify the jet as a heavy-flavor candi-date: the jet is required to have at least two associated tracks with pT > 0.5 GeV and at least one hit in the SMT, one of these tracks must also have pT > 1.0 GeV. These criteria have an efficiency of about 90% for a b jet. Light jets (initiated by u, d and s quarks or gluons) are suppressed using a dedicated heavy-flavor (HF) tagging algorithm [13].
The HF tagging algorithm is based on a multivari-ate analysis (MVA) technique that combines information from the secondary vertex (SV) tagging algorithms and tracks impact parameter variables using an artificial neu-ral network (NN) to define a single output discriminant, MVAbl [13]. This algorithm utilizes the longer lifetimes of HF hadrons relative to their lighter counterparts. The MVAblhas a continuous output value that tends towards one for b jet and zero for light jets. Events with at least two jets passing the MVAbl> 0.3 selection are considered in the γ + 2 b-jet analysis. Depending on pγT, this selec-tion has an efficiency of (13 − 21)% for two b jets with relative systematic uncertainties of (4 − 6)%, primarily due to uncertainties on the data-to-MC correction fac-tors [13]. Only (0.2 − 0.4)% of light-jets are misidentified as b jets.
After application of all selection requirements, 3,816 γ + 2 b-jet candidate (186,406 γ + b-jet candidate) events remain in the data sample. In these events, there are
(GeV) γ T p 0 20 40 60 80 100 120 140 160 180 200 Photon purity 0 0.2 0.4 0.6 0.8 1 1.2 -1
DØ, L = 8.7 fb
FIG. 1: Photon purity as a function of pγ
T in the selected
data sample. The error bars include statistical and systematic uncertainties added in quadrature. The binning is defined as in Table I.
two main background sources: jets misidentified as pho-tons and light-flavor jets mimicking HF jets. To estimate the photon purity, the γ-NN distribution in data is fit-ted to a linear combination of templates for photons and jets obtained from simulated γ + jet and dijet samples. An independent fit is performed in each pγT bin, yield-ing photon fractions between 62% and 90%, as shown in Fig. 1. The main systematic uncertainty in the photon fractions is due to the fragmentation model implemented in pythia [21]. This uncertainty is estimated by varying the production rate of π0 and η mesons by ±50% with respect to their central values [22], and found to be about 6% at pγT ≈ 30 GeV, and ≤ 1% at pγT &70 GeV.
The fraction of different flavor jets in the selected data sample is extracted using a discriminant, DMJL, with dis-tributions dependent on the jet flavors. It combines two discriminating variables associated with the jet, mass of any secondary vertex associated with the jet MSV and the probability for the jet tracks located within the jet cone to come from the primary p¯p interaction vertex. The latter probability is found using the jet lifetime impact parameter (JLIP) algorithm, and is denoted as PJLIP[17]. The final DMJLdiscriminant [23] is defined as DMJL = 0.5 × (MSV/5 GeV − ln(PJLIP)/20), where MSV and ln(PJLIP) are normalized by their maximum values obtained from the corresponding distributions in data. The data sample with two HF-tagged jets is fitted to templates consisting mainly of 2 b-jet and 2 c-jet events, as determined from MC simulation. The remaining jet flavor contributions in the sample (e.g., light+light-jets,
MJL D 0.1 0.2 0.3 0.4 0.5 0.6 0.7 0.8 0.9 1 Events 10 2 10 3 10 Data b-jet c-jet b-jet + c-jet < 40 GeV γ T 30 GeV < p -1
DØ, L = 8.7 fb
FIG. 2: (Color online) Distribution of discriminant DMJL
af-ter all selection criaf-teria for a representative bin of 30 < pγ T<
40 GeV. The expected contribution from the light jets com-ponent has been subtracted from the data. The distributions for the b-jet and c-jet templates (with statistical uncertain-ties) are shown normalized to their respective fitted fractions.
(GeV) γ T p 0 20 40 60 80 100 120 140 160 180 200 2b-jets fractions 0 0.2 0.4 0.6 0.8 1 1.2 -1
DØ, L = 8.7 fb
FIG. 3: The 2 b-jet fraction in data as a function of pγ T
de-rived from the template fit to the heavy quark jet data sample after applying all selections. The error bars show both statis-tical and systemastatis-tical uncertainties summed in quadrature. Binning is the same as given in Table I.
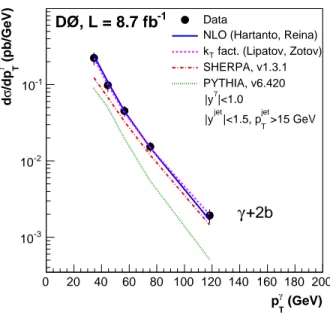
(GeV) γ T p 0 20 40 60 80 100 120 140 160 180 200 (pb/GeV) γ T /dp σ d -3 10 -2 10 -1 10 Data
NLO (Hartanto, Reina) fact. (Lipatov, Zotov)
T k SHERPA, v1.3.1 PYTHIA, v6.420 >15 GeV jet T |<1.5, p jet |y |<1.0 γ |y -1
DØ, L = 8.7 fb
+2b
γ
FIG. 4: (Color online) The γ + 2 b-jet differential produc-tion cross secproduc-tions as a funcproduc-tion of pγT. The uncertainties on the data points include statistical and systematic contribu-tions. The measurements are compared to the NLO QCD calculations [4] using the cteq6.6M PDFs [27] (solid line). The predictions from sherpa [18], pythia [19] and the kT
-factorization approach [28, 29] are also shown.
light+b(c)-jets, etc) are small and are subtracted from the data. The fractions of these rarer jet contributions are estimated from sherpa simulation (which has been found to provide a good description of the data), and vary in the range (5 − 10)%. The difference in the values of these fractions obtained from sherpa and pythia, (2 − 4)%, is assigned as a systematic uncertainty on the background estimate. The fraction of 2 b-jet events are determined by performing a two-dimensional (corre-sponding to the 2 b-jet candidates) maximum likelihood fit of DMJL distributions of 2 jet events in data using the corresponding templates for 2 b-jets and 2 c-jets. These jet flavor templates are obtained from MC simulations. As an example, the result of one of these maximum like-lihood fits to DMJLtemplates is presented in Fig. 2 (with χ2/ndf = 6.80/5 for data/MC agreement). This shows the one-dimensional projection onto the highest pT jet DMJL axis of the 2D fit, normalized to the number of events in data, for photons with 30 < pγT < 40 GeV. An independent fit is performed in each pγT bin, result-ing in extracted fractions of 2 b-jet events between 76% and 87%, as shown in Fig. 3. The relative uncertainties of the estimated 2 b-jet fractions range from 5% to 14%, increasing at higher pγT and are dominated by the limited data statistics.
The estimated numbers of signal events in each pγT bin are corrected for the geometric and kinematic
(GeV) γ T p 0 20 40 60 80 100 120 140 160 180 200 Ratio to NLO 0.2 0.4 0.6 0.8 1 1.2 1.4 1.6 1.8 2 2.2 Data/NLO PYTHIA/NLO fact./NLO T k SHERPA/NLO NLO scale uncertainty
fact. scale uncertainty
T k -1
DØ, L = 8.7 fb
|<1.0 γ |y >15 GeV jet T |<1.5, p jet |y+2b
γ
FIG. 5: (Color online) The ratio of the measured γ + 2 b-jet production cross sections to the reference NLO predic-tions. The uncertainties on the data include both statis-tical (inner error bar) and total uncertainties (full error bar). Similar ratios to NLO calculations for predictions with sherpa[18], pythia [19] and kT-factorization [28, 29] are also
presented along with the scale uncertainties on NLO and kT
-factorization predictions.
ceptance of the photon and jets. The combined accep-tance for photon and jets are calculated using sherpa MC events. The acceptance is calculated for the pho-tons satisfying pγT > 30 GeV, |yγ| < 1.0 at particle level. The particle level includes all stable particles as defined in Ref. [24]. The jets are required to have pjetT > 15 GeV and |yjet| < 1.5. As in Refs. [3, 6], in the accep-tance calculations, the photon is required to be isolated by Eiso
T = EtotT (0.4) − E γ
T < 2.5 GeV, where ETtot(0.4) is the total transverse energy of particles within a cone of radius R = p(∆η)2+ (∆φ)2 = 0.4 centered on the photon direction and ETγ is the photon transverse energy. The sum of transverse energy in the cone includes all sta-ble particles. [24]. The acceptance is driven by selection requirements in |ηdet| (applied to avoid edge effects in the calorimeter regions used for the measurement) and |φdet| (to avoid periodic calorimeter module boundaries), pho-ton |ηγ| and pγ
T, and bin-to-bin migration effects due to the finite energy resolution of the EM calorimeter. The combined photon and jets acceptance with respect to the pT and rapidity selections varies between 66% and 77% in different pγT bins. Uncertainties on the acceptance due to the jet energy scale [25], jet energy resolution, and the difference between results obtained with sherpa and pythiaare in the range of (8 − 12)%.
reconstruction efficiencies and the admixture of back-ground events, are presented at the particle level by un-folding for effects of detector resolution, photon and b-jet detection inefficiencies. The differential cross sections of γ + 2 b-jet production are extracted in five bins of pγT. They are given in Table I. The data points are plotted at the values of pγT for which the value of a smooth func-tion describing the dependence of the cross secfunc-tion on pγT equals the averaged cross section in the bin [26].
The cross sections fall by more than two orders of mag-nitude in the range 30 < pγT < 200 GeV. The statistical uncertainty on the results ranges from 4.3% in the first pγT bin to 9% in the last pγT bin, while the total systematic uncertainty ranges up to 20%. Main sources of system-atic uncertainty are the photon purity (up to 8%), photon and two b-jet acceptance (up to 14%), b-jet fraction (up to 13%), and integrated luminosity (6%) [10]. At higher pγT, the uncertainty is dominated by the fractions of b-jet events and their selection efficiencies.
NLO perturbative QCD predictions, with the renor-malization scale µR, factorization scale µF, and fragmen-tation scale µf all set to pγT, are also given in Table I. The uncertainty from the scale choice is (15 − 20)% and is estimated through a simultaneous variation of all three scales by a factor of two, i.e., for µR,F,f = 0.5pγT and 2pγT. The predictions utilize cteq6.6M PDFs [27] and are corrected for non-perturbative effects of parton-to-hadron fragmentation and multiple parton interactions. The latter are evaluated using sherpa and pythia MC samples with their standard settings [18, 19]. The overall correction varies from about 0.90 at 30 < pγT < 40 GeV to about 0.95 at high pγT, and an uncertainty of . 2% is assigned to account for differences between the two MC generators.
The predictions based on the kT-factorization ap-proach [28, 29] and unintegrated parton distributions [30] are also given in Table I. The kT-factorization formalism contains additional contributions to the cross sections due to resummation of gluon radiation diagrams with k2
T above a scale µ2 of O(1 GeV), where kT denotes the transverse momentum of the radiated gluon. Apart from this resummation, the non-vanishing transverse momen-tum distribution of the colliding partons are taken into account. These effects lead to a broadening of the photon transverse momentum distribution in this approach [28]. The scale uncertainties on these predictions vary from about 31% at 30 < pγT < 40 GeV to about 50% in the highest pγT bin.
Table I also contains predictions from the pythia [19] MC event generator with the cteq6.1L PDF set. It in-cludes only 2 → 2 matrix elements (ME) with gb → γb and q ¯q → γg scatterings (defined at LO) and with g → b¯b splitting in the parton shower (PS). We also provide pre-dictions of the sherpa MC event generator [18] with the cteq6.6M PDF set [27]. For γ + b production, sherpa includes all the MEs with one photon and up to three
(GeV) γ T p 0 20 40 60 80 100 120 140 160 180 200 (pb/GeV) γ T /dp σ d -2 10 -1 10 1 Data
NLO (Hartanto, Reina) fact. (Lipatov, Zotov)
T k SHERPA, v1.3.1 PYTHIA, v6.420 >15 GeV jet T |<1.5, p jet |y |<1.0 γ |y -1
DØ, L = 8.7 fb
+b
γ
FIG. 6: (Color online) The γ + b-jet differential production cross sections as a function of pγT. The uncertainties on the data points include statistical and systematic contributions added in quadrature. The measurements are compared to the NLO QCD calculations [4] using the cteq6.6M PDFs [27] (solid line). The predictions from sherpa [18], pythia [19] and kT-factorization [28, 29] are also shown.
jets, with at least one b-jet in our kinematic region. In particular, it accounts for an additional hard jet that ac-companies the photon associated with 2 b jets. Compared to an NLO calculation, there is an additional benefit of imposing resummation (further emissions) through the consistent combination with the PS. Matching between the ME partons and the PS jets follows the prescrip-tion given in Ref. [31]. Systematic uncertainties are esti-mated by varying the ME-PS matching scale by ±5 GeV around the chosen central value [32]. As a result, the sherpacross sections vary up to ±7%, the uncertainty being largest in the first pγT bin.
All the theoretical predictions are obtained including the isolation requirement on the photon Eiso
T < 2.5 GeV. The predictions are compared to data in Fig. 4 as a func-tion of pγT. The ratios of data to the NLO QCD calcula-tions and of different QCD prediccalcula-tions or MC simulation to the same NLO QCD calculations are shown in Fig. 5 as a function of pγT.
The measured cross sections are well described by the NLO QCD calculations and the predictions from the kT-factorization approach in the full studied pγT region considering the experimental and theoretical uncertain-ties. Both of these predictions show consistent behavior, although the predictions from the kT-factorization ap-proach suffer from larger uncertainties. pythia predicts significantly lower production rates and a more steeply
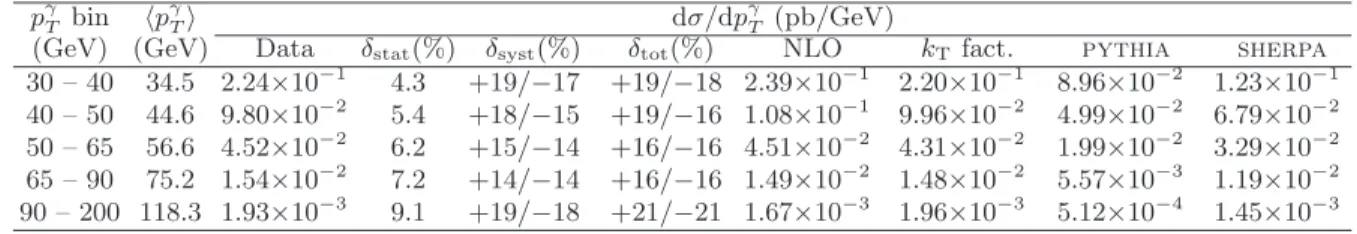
TABLE I: The differential γ + 2 b-jet production cross sections dσ/dpγ T in bins of p γ T for |η γ | < 1.0, pjet T > 15 GeV and |yjet
| < 1.5 together with statistical uncertainties (δstat), total systematic uncertainties (δsyst) and total uncertainties (δtot)
which are obtained by adding δstat and δsyst in quadrature. The last four columns show theoretical predictions obtained with
NLO QCD, kTfactorization, and with the pythia and the sherpa event generators.
pγT bin hp γ
Ti dσ/dp
γ
T (pb/GeV)
(GeV) (GeV) Data δstat(%) δsyst(%) δtot(%) NLO kT fact. pythia sherpa
30 – 40 34.5 2.24×10⁻¹ 4.3 +19/−17 +19/−18 2.39×10⁻¹ 2.20×10⁻¹ 8.96×10⁻² 1.23×10⁻¹
40 – 50 44.6 9.80×10⁻² 5.4 +18/−15 +19/−16 1.08×10⁻¹ 9.96×10⁻² 4.99×10⁻² 6.79×10⁻²
50 – 65 56.6 4.52×10⁻² 6.2 +15/−14 +16/−16 4.51×10⁻² 4.31×10⁻² 1.99×10⁻² 3.29×10⁻²
65 – 90 75.2 1.54×10⁻² 7.2 +14/−14 +16/−16 1.49×10⁻² 1.48×10⁻² 5.57×10⁻³ 1.19×10⁻²
90 – 200 118.3 1.93×10⁻³ 9.1 +19/−18 +21/−21 1.67×10⁻³ 1.96×10⁻³ 5.12×10⁻⁴ 1.45×10⁻³
TABLE II: The differential γ + b-jet production cross sections dσ/dpγ
T in bins of p γ T for |η γ | < 1.0, pjet T > 15 GeV and |yjet
| < 1.5 together with statistical uncertainties (δstat), total systematic uncertainties (δsyst), and total uncertainties (δtot) that
are obtained by adding δstat and δsyst in quadrature. The last four columns show theoretical predictions obtained with NLO
QCD, kT-factorization, and with the pythia and the sherpa event generators.
pγT bin hp γ
Ti dσ/dp
γ
T (pb/GeV)
(GeV) (GeV) Data δstat(%) δsyst(%) δtot(%) NLO kTfact. pythia sherpa
30 – 40 34.5 1.51 2.3 12 12 1.52 1.69 1.23 1.46 40 – 50 44.6 5.83×10⁻¹ 2.4 11 12 5.06×10⁻¹ 5.70×10⁻¹ 4.23×10⁻¹ 5.65×10⁻¹ 50 – 65 56.6 1.92×10⁻¹ 2.8 9 10 1.75×10⁻¹ 1.98×10⁻¹ 1.63×10⁻¹ 2.02×10⁻¹ 65 – 90 75.2 6.06×10⁻² 3.3 9 9 4.93×10⁻² 5.43×10⁻² 4.27×10⁻² 5.41×10⁻² 90 – 200 118.3 6.15×10⁻³ 3.3 13 13 4.83×10⁻³ 5.68×10⁻³ 3.76×10⁻³ 5.05×10⁻³ (GeV) γ T p 0 20 40 60 80 100 120 140 160 180 200 Ratio to NLO 0.4 0.6 0.8 1 1.2 1.4 1.6 1.8 2 2.2 2.4 Data/NLO SHERPA/NLO PYTHIA /NLO fact./NLO T k
NLO scale uncertainty fact. scale uncertainty
T k -1
DØ, L = 8.7 fb
|<1.0 γ |y >15 GeV jet T |<1.5, p jet |y+b
γ
FIG. 7: (Color online) The ratio of γ + b-jet production cross sections to NLO predictions for data and theoretical predic-tions. The uncertainties on the data include both statisti-cal (inner error bar) and total uncertainties (full error bar). The ratios to the NLO calculations with predictions from sherpa [18], pythia [19] and kT-factorization [28, 29] are
also presented along with the scale uncertainties on NLO and kT-factorization predictions.
falling pγT distribution than observed in data. sherpa performs better in describing the normalization at high pγT, but underestimates production rates compared to that observed in data at low pγT.
In addition to measuring the γ + 2 b-jet cross sections, we also obtain results for the inclusive γ + b-jet cross section in the same pγT bins. Here we follow the same procedure as described in the previous similar D0 mea-surement [3]. However, as for the γ + 2 b-jet cross section measurement, we now use the most recent HF tagging al-gorithm [13]. The measured cross sections are shown in Fig. 6, and are compared to various predictions in Fig. 7. Data and predictions are also presented in Table II. The values of the obtained γ+b-jet cross section are consistent with our previously published results [3].
We use σ(γ + 2 b-jet) and σ(γ + b-jet) cross sections to calculate their ratio in bins of pγT. Figure 8 shows the pγT spectrum of the measured ratio. The system-atic uncertainties on the ratio vary within (11 − 15)%, being largest at high pγT. The major sources of sys-tematic uncertainties are attributed to the jet accep-tances and the estimation of b-jet and 2 b-jet fractions obtained from the template fits to the data. Figure 8 also shows comparisons with various predictions. The mea-surements are well described by the calculations done by NLO QCD and kT-factorization predictions taking into account the experimental and theoretical uncertainties. The scale uncertainties on the NLO calculations are typ-ically . 15%, while they vary uptp 35% at high pγT for the kT-factorization approach. The predictions from sherpa
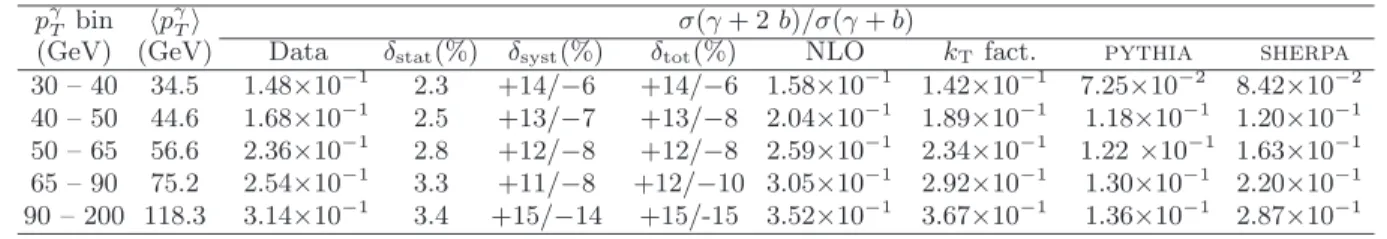
TABLE III: The σ(γ + 2 b-jet)/σ(γ + b-jet) cross section ratio in bins of pγ T for |η γ | < 1.0, pjet T > 15 GeV and |y jet | < 1.5 together with statistical uncertainties (δstat), total systematic uncertainties (δsyst) and total uncertainties (δtot) which are obtained
by adding δstat and δsyst in quadrature. The last four columns show theoretical predictions obtained with NLO QCD, kT
factorization, and with the pythia and the sherpa event generators. pγT bin hp
γ
Ti σ(γ + 2 b)/σ(γ + b)
(GeV) (GeV) Data δstat(%) δsyst(%) δtot(%) NLO kTfact. pythia sherpa
30 – 40 34.5 1.48×10⁻¹ 2.3 +14/−6 +14/−6 1.58×10⁻¹ 1.42×10⁻¹ 7.25×10⁻² 8.42×10⁻² 40 – 50 44.6 1.68×10⁻¹ 2.5 +13/−7 +13/−8 2.04×10⁻¹ 1.89×10⁻¹ 1.18×10⁻¹ 1.20×10⁻¹ 50 – 65 56.6 2.36×10⁻¹ 2.8 +12/−8 +12/−8 2.59×10⁻¹ 2.34×10⁻¹ 1.22 ×10⁻¹ 1.63×10⁻¹ 65 – 90 75.2 2.54×10⁻¹ 3.3 +11/−8 +12/−10 3.05×10⁻¹ 2.92×10⁻¹ 1.30×10⁻¹ 2.20×10⁻¹ 90 – 200 118.3 3.14×10⁻¹ 3.4 +15/−14 +15/-15 3.52×10⁻¹ 3.67×10⁻¹ 1.36×10⁻¹ 2.87×10⁻¹ (GeV) γ T p 0 20 40 60 80 100 120 140 160 180 200 +b) γ ( σ +2b)/ γ ( σ 0.1 0.2 0.3 0.4 0.5 0.6 Data PYTHIA, v6.420 SHERPA, v1.3.1 NLO (Hartanto, Reina)
fact. (Lipatov, Zotov)
T
k
NLO scale uncertainty fact. scale uncertainty
T k -1
DØ, L = 8.7 fb
|<1.0 γ |y >15 GeV jet T |<1.5, p jet |yFIG. 8: (Color online) The ratio of measured cross sections for γ + 2 b-jet to γ + b-jet production as a function of pγ T
compared to theoretical predictions. The uncertainties on the data points include both statistical (inner error bar) and the full uncertainties (full error bar). The measurements are compared to the NLO QCD calculations [4]. The predictions from sherpa [18], pythia [19] and kT-factorization [28, 29]
are also shown along with the scale uncertainties on NLO and kT-factorization predictions.
describe the shape, but underestimate the ratio for most of the pγT bins. The Pythia model does not perform well in describing the shape and underestimates ratios across all the bins. Experimental results as well as theoretical predictions for the ratios are presented in Table III.
In summary, we have presented the first measurement of the differential cross section of inclusive production of a photon in association with two b-quark jets as a func-tion of pγT at the Fermilab Tevatron p¯p Collider. The results cover the kinematic range 30 < pγT < 200 GeV, |yγ| < 1.0, pjet
T > 15 GeV, and |yjet|<1.5. The measured cross sections are in agreement with the NLO QCD
cal-culations and predictions from the kT-factorization ap-proach. We have also measured the ratio of differential σ(γ + 2 b-jet)/σ(γ + b-jet) in the same pγT range. The ra-tio agrees with the predicra-tions from NLO QCD and kT -factorization approach within the theoretical and exper-imental uncertainties in the full studied pγT range. These results can be used to further tune theory, MC event gen-erators and improve the description of background pro-cesses in studies of the Higgs boson and searches for new phenomena beyond the Standard Model at the Tevatron and the LHC in final states involving the production of vector bosons in association with two b-quark jets.
We are grateful to the authors of the theoretical calcu-lations, H. B. Hartanto, L. Reina, A. Lipatov and N. Zo-tov, for providing predictions and for many useful discus-sions.
We thank the staffs at Fermilab and collaborating institutions, and acknowledge support from the DOE and NSF (USA); CEA and CNRS/IN2P3 (France); MON, Rosatom and RFBR (Russia); CNPq, FAPERJ, FAPESP and FUNDUNESP (Brazil); DAE and DST (In-dia); Colciencias (Colombia); CONACyT (Mexico); NRF (Korea); FOM (The Netherlands); STFC and the Royal Society (United Kingdom); MSMT and GACR (Czech Republic); BMBF and DFG (Germany); SFI (Ireland); The Swedish Research Council (Sweden); and CAS and CNSF (China).
[1] J. F. Owens, Rev. Mod. Phys. 59, 465 (1987).
[2] T. Stavreva and J. F. Owens, Phys. Rev. D 79, 054017 (2009).
[3] V. M. Abazov et al. (D0 Collaboration), Phys. Lett. B 714, 32 (2012).
[4] H. B. Hartanto and L. Reina, Phys. Rev. D 89, 074001 (2014).
[5] U. Baur, A. Juste, L. Orr, and D. Rainwater, Phys. Rev. D 71, 054013 (2005).
[6] V. M. Abazov et al. (D0 Collaboration), Phys. Rev. Lett. 102, 192002 (2009).
[7] V. M. Abazov et al. (D0 Collaboration), Phys. Lett. B 719, 354 (2013).
[8] T. Aaltonen et al. (CDF Collaboration), Phys. Rev. D 81, 052006 (2010).
[9] T. Aaltonen et al. (CDF Collaboration), Phys. Rev. Lett. 111, 042003 (2013).
[10] T. Andeen et al., FERMILAB-TM-2365 (2007).
[11] V. M. Abazov et al. (D0 Collaboration), Nucl. Instrum. Methods Phys. Res. A 750, 78 (2014)
[12] V. M. Abazov et al. (D0 Collaboration), Phys. Rev. Lett. 102, 231801 (2009).
[13] V. M. Abazov et al. (D0 Collaboration), arXiv:1312.7623 (submitted to Nucl. Instrum. Methods Phys. Res. A). [14] V. M. Abazov et al. (D0 Collaboration), Nucl. Instrum.
Methods Phys. Res. A 565, 463 (2006); R. Angstadt et al., Nucl. Instrum. Methods Phys. Res. A 622, 298 (2010); M. Abolins et al., Nucl. Instrum. Methods Phys. Res. A 584, 75 (2008).
[15] The polar angle θ and the azimuthal angle φ are defined with respect to the positive z axis, which is along the proton beam direction. Pseudorapidity is defined as η = − ln[tan(θ/2)]. Also, ηdetand φdetare the pseudorapidity
and the azimuthal angle measured with respect to the center of the detector.
[16] R. Brun and F. Carminati, CERN Program Library Long Writeup, W5013, (1993); we use geant version v3.21. [17] V. M. Abazov et al. (D0 Collaboration), Nucl. Instrum.
Methods Phys. Res. A 620, 490 (2010).
[18] T. Gleisberg et al., J. High Energy Phys. 02, 007 (2009). We use sherpa version v1.3.1.
[19] T. Sj¨ostrand, S. Mrenna, and P. Z. Skands, J. High En-ergy Phys. 05, 026 (2006). We use pythia version v6.420 with tune A.
[20] G. C. Blazey et al., arXiv:hep-ex/0005012 (2000). [21] V. M. Abazov et al. (D0 Collaboration), Phys. Lett. B
639, 151 (2006).
[22] T. Binoth et al., Eur. Phys. J. C 4, 7 (2002).
[23] V. M. Abazov et al. (D0 Collaboration), Phys. Lett. B 718, 1314 (2013).
[24] C. Buttar et al., arXiv:0803.0678 [hep-ph], section 9. [25] V. M. Abazov et al. (D0 Collaboration), arXiv:1312.6873
(accepted by Nucl. Instrum. Methods).
[26] G. D. Lafferty and T. R. Wyatt, Nucl. Instrum. Methods Phys. Res. A 355, 541 (1995).
[27] W. K. Tung et al., J. High Energy Phys. 02, 052 (2007). [28] A. V. Lipatov and N. P. Zotov, J. Phys. G 34, 219 (2007); S. P. Baranov, A. V. Lipatov, and N. P. Zotov, Eur. Phys. J. C 56, 371 (2008).
[29] A. V. Lipatov and N. P. Zotov, paper in preparation. [30] M. A. Kimber, A. D. Martin, and M. G. Ryskin, Phys.
Rev. D 63, 114027 (2001).
[31] A. D. Martin, W. J. Stirling, R. S. Thorne, and G. Watt, Eur. Phys. J. C 63, 189 (2009).
[32] We choose the following ME-PS matching parameters: the energy scale Q0= 15 GeV and the spatial scale D =
0.4, where D is taken to be of the radius of the photon isolation cone.

![Table I also contains predictions from the pythia [19]](https://thumb-eu.123doks.com/thumbv2/123doknet/14078195.463277/7.918.482.816.114.427/table-i-contains-predictions-pythia.webp)