EUROPEAN ORGANISATION FOR NUCLEAR RESEARCH (CERN)
Eur. Phys. J. C 80 (2020) 73
DOI:10.1140/epjc/s10052-020-7624-4
CERN-EP-2019-217 19th March 2020
Transverse momentum and process dependent
azimuthal anisotropies in
√
s
NN
= 8.16 TeV p+Pb
collisions with the ATLAS detector
The ATLAS Collaboration
The azimuthal anisotropy of charged particles produced in √
sNN = 8.16 TeV p+Pb collisions is measured with the ATLAS detector at the LHC. The data correspond to an integrated luminosity of 165 nb−1that was collected in 2016. Azimuthal anisotropy coefficients, elliptic v2and triangular v3, extracted using two-particle correlations with a non-flow template fit
procedure, are presented as a function of particle transverse momentum (pT) between 0.5
and 50 GeV. The v2 results are also reported as a function of centrality in three different
particle pT intervals. The results are reported from minimum-bias events and jet-triggered
events, where two jet pT thresholds are used. The anisotropies for particles with pT less
than about 2 GeV are consistent with hydrodynamic flow expectations, while the significant non-zero anisotropies for pTin the range 9–50 GeV are not explained within current theoretical
frameworks. In the pTrange 2–9 GeV, the anisotropies are larger in minimum-bias than in
jet-triggered events. Possible origins of these effects, such as the changing admixture of particles from hard scattering and the underlying event, are discussed.
© 2020 CERN for the benefit of the ATLAS Collaboration.
Reproduction of this article or parts of it is allowed as specified in the CC-BY-4.0 license.
1 Introduction
The collisions of heavy nuclei at relativistic speeds generate hot and dense droplets of matter composed of deconfined quarks and gluons known as the quark–gluon plasma (QGP) [1,2]. Studies of the QGP at the Relativistic Heavy Ion Collider (RHIC) and the Large Hadron Collider (LHC) have yielded a wealth of surprising results that reveal a complex set of QGP-related phenomena. Bulk hadron production, occurring mainly at low transverse momentum (pT . 3 GeV), exhibits significant azimuthal anisotropies
that are well described in terms of nearly inviscid hydrodynamic flow of the QGP [1]. The final hadron momentum anisotropies arise from inhomogeneities in the initial spatial distribution of the QGP translated to momentum space via strong differential pressure gradients. These anisotropies are characterised in terms of a Fourier decomposition:
Y (φ) = G h 1 + 2 ∞ Õ n=1 vncos(n(φ − Ψn))i,
where vn are the anisotropy coefficients, Ψn is the nth-order orientation of the anisotropy, and the normalization, G, is set by the integral of the distribution. In particular, v2and v3are referred to as the
elliptic and triangular coefficients, respectively.
In addition, the production of high transverse momentum hadrons (pT & 10 GeV) is highly suppressed
relative to the yields expected from nuclear thickness scaling of proton–proton collision yields [3]. This suppression is understood to result from high momentum transfer parton–parton interactions followed by the outgoing partons losing energy via radiative and collisional processes in the QGP – processes referred to as jet quenching [4–6]. These high-pT hadrons and associated jets are also observed to have a non-zero
azimuthal anisotropy [7–9], despite being well outside the nominal domain where the anisotropies are interpreted in terms of hydrodynamic flow. Instead, these anisotropies are understood to also arise from inhomogeneities in the initial spatial distribution of the QGP, but in this case, where the jet quenching effect is stronger for partons traversing longer paths through the QGP and weaker for partons traversing shorter paths [10]. In this way, low- and high-pThadrons have a common orientation of their azimuthal anisotropy
in a given event, because both are correlated with the orientation of the initial geometry of the colliding nucleons. It is notable that, for more than a decade, an outstanding and challenging theoretical puzzle has been how to quantitatively describe both high-pT hadron suppression and azimuthal anisotropy in
Pb+Pb collisions [11]. There are a number of proposed explanations for resolving this puzzle in heavy-ion collisions – see Refs. [12–17] for examples.
Measurements in smaller collision systems, pp and p+Pb collisions at the LHC [18–23] and p+Au, d+Au, and3He+Au at RHIC [24], indicate significant azimuthal anisotropies for low-pThadrons with patterns
quite similar to those observed in the larger heavy-ion collision systems. For a recent review see Ref. [25]. These observations have raised the question of whether smaller and shorter-lived droplets of QGP are formed in these smaller collision systems. Indeed, models employing nearly inviscid hydrodynamics for the QGP provide a quantitative description of this large body of data at low pT[26].
In contrast, measurements aimed at observing signatures of jet quenching in small collision systems have found no such effect. Measurements of hadron and jet pTspectra at high pT indicate production yields
consistent with those in pp collisions scaled up by the expected nuclear thickness in p+Pb [27–29] and d+Au collisions [30], and that the pT-balance between dijets or hadron–jet pairs is unmodified in p+Pb
collisions within uncertainties [31,32]. The ATLAS experiment has also published results for the hadron azimuthal anisotropy up to pT ≈ 12 GeV that hint at a non-zero anisotropy extending into the region beyond
the usual hydrodynamic interpretation and into the regime of jet quenching [33]. However, it is unlikely that there can be differential jet quenching as a function of orientation relative to the QGP geometry if there is no jet quenching in p+Pb collisions as observed in the spectra. Thus, there are two related outstanding puzzles, one being the lack of jet quenching observed in the spectra, if indeed small droplets of QGP are formed, and the other being what mechanism can lead to high-pThadron anisotropies other than differential
jet quenching.
This paper presents a measurement of the azimuthal anisotropy of unidentified hadrons as a function of pTand centrality in√sNN = 8.16 TeV p+Pb collisions with the ATLAS detector. The measurement is made using two-particle correlations, measured separately for minimum-bias triggered (MBT) events and events requiring a jet with pT greater than either 75 GeV or 100 GeV. There are contributions to the
azimuthal correlations from particle decays, jets, dijets, and global momentum conservation, which have traditionally been referred to as ‘non-flow’ [34]. Using this nomenclature, a standard template fitting procedure is applied to subtract non-flow contributions [19,20]. To decrease the residual influence of the non-flow correlation in the jet events, a novel procedure is used to restrict the acceptance of particles according to the location of jets in the event. Assuming that the two-particle anisotropy coefficients are the products of the corresponding single-particle coefficients (factorisation), the elliptic and triangular anisotropy coefficients, v2and v3, are reported as a function of pT. Additionally, v2results are presented as
a function of centrality in three different pTranges. Finally, the fractional contribution to the correlation
functions from jet particles is determined as a function of pT.
2 ATLAS detector
The ATLAS experiment [35] at the LHC is a multipurpose particle detector with a forward–backward symmetric cylindrical geometry and nearly 4π coverage.1 This analysis relies on the inner detector, the calorimeter, and the data acquisition and trigger system.
The inner detector (ID) comprises three major subsystems: the pixel detector and the silicon microstrip tracker, which extend up to |η| = 2.5, and the transition radiation tracker, which extends to |η| = 2.0. The inner detector covers the full azimuth and is immersed in a 2 T axial magnetic field. The pixel detector consists of four cylindrical layers in the barrel region and three discs in each endcap region. A new innermost layer, the insertable B-layer [36,37], has been operating as a part of the pixel detector since 2015. The silicon microstrip tracker comprises four cylindrical layers (nine discs) of silicon strip detectors in the barrel (endcap) region. The minimum-bias trigger scintillator detects charged particles over 2.07 < |η| < 3.86 using two hodoscopes of 12 counters positioned at |z| = 3.6 m.
The calorimeter is a large-acceptance, longitudinally segmented sampling detector covering |η| < 4.9 with electromagnetic (EM) and hadronic sections. The EM calorimeter is a lead/liquid-argon sampling calorimeter with an accordion-shaped geometry. It is divided into a barrel region, covering |η| < 1.475, and two endcap regions, covering 1.375 < |η| < 3.2. The hadronic calorimeter surrounds the EM calorimeter. It consists of a steel/scintillator-tile sampling calorimeter covering |η| < 1.7 and a liquid-argon calorimeter with copper absorber covering 1.5 < |η| < 3.2. The forward calorimeter (FCal) is a liquid-argon sampling
1ATLAS uses a right-handed coordinate system with its origin at the nominal interaction point (IP) in the centre of the detector
and the z-axis along the beam pipe. The x-axis points from the IP to the centre of the LHC ring, and the y-axis points upward. Cylindrical coordinates (r, φ) are used in the transverse plane, φ being the azimuthal angle around the z-axis. The pseudorapidity is defined in terms of the polar angle θ as η = − ln tan(θ/2). Transverse momentum and transverse energy are defined as pT= p sin θ and ET= E sin θ, respectively. Angular distance ∆R is defined as
p
calorimeter located on either side of the interaction point. It covers 3.1 < |η| < 4.9 and each half is composed of one EM and two hadronic sections, with copper and tungsten serving as the absorber material, respectively. The FCal is used to characterise the centrality of p+Pb collisions as described below. In this analysis, a two-level trigger system was used to select events, with a first-level (L1) trigger implemented in hardware followed by a software-based high-level trigger (HLT) which reconstructs the event in a manner similar to the final offline reconstruction. Events used for the measurements presented in this paper were selected using several triggers. MBT events were selected by a trigger that requires a signal in at least one minimum-bias trigger scintillator counter at L1 [38] followed by the requirement of at least one reconstructed track at the HLT stage. Events with a high-pTjet were acquired using a high-level jet
trigger covering the central region (|η| < 3.2). These events were first required to have energy deposits at L1 that are compatible with the presence of a jet and then to pass various thresholds for the jet transverse energy at the HLT stage.
3 Data and event selection
During p+Pb data-taking in 2016, the LHC was configured with a beam composed of protons with an energy of 6.5 TeV and a beam of lead ions with an energy per nucleon of 2.51 TeV. This resulted in a collision system with proton–nucleon centre-of-mass energy√sNN = 8.16 TeV and a rapidity shift of the
centre of mass by +0.465 units in the proton-going direction relative to the laboratory frame. The data were taken over two running periods with different configurations of the LHC beam directions. In the first period of data-taking, comprising a total integrated luminosity of 57 nb−1, the lead ions circulated clockwise in beam 1, while the protons circulated counterclockwise in beam 2. For the second period of data-taking, which comprised 108 nb−1, the beam species were interchanged. The analysed data were provided by the minimum-bias trigger described above, which was prescaled and sampled 0.079 nb−1of luminosity. In addition, data were selected by the high-level jet triggers with transverse energy thresholds of 75 GeV and 100 GeV, which sampled 26 nb−1and the full 165 nb−1of p+Pb luminosity, respectively. Events selected by the triggers described above were reconstructed offline following procedures that were optimised for the Run-2 detector configuration [39]. Events are required to have at least one reconstructed vertex. To reduce the contribution from events with multiple in-time p+Pb interactions, events with more than one vertex are used only if the additional vertices have fewer than seven associated reconstructed tracks with pT > 0.4 GeV. That is, events are only allowed to have one vertex with seven or more associated tracks.
Two classes of jet events were defined by requiring an offline jet with pT > 75 GeV or pT > 100 GeV
respectively, and were drawn from the jet-triggered event samples with the analogous online thresholds. The trigger efficiency, given this offline selection, was greater than 97% for both jet samples.
Events were further characterised by the sum of the transverse energy in the FCal module in the direction of the Pb beam, ΣETPb. The event centrality is defined as the ΣETPbpercentile of the events in minimum-bias collisions, after accounting for the inefficiency introduced by the trigger and event selection criteria, and was determined in a way similar to previous analyses of Run-1 p+Pb data at√sNN = 5.02 TeV [27,40]. Events
within the 0–90% centrality range were used in this analysis, with low (high) values corresponding to high-ΣEPb
T (low-ΣE Pb
T ) events with large (small) overall particle multiplicity. Since the acceptance of the FCal is
separate from that of the ID, this centrality definition has the benefit of reducing event-selection-induced biases in the measured quantities [41].
4 Track and jet reconstruction
The reconstruction, selection, and calibration of charged-particle tracks and calorimetric jets, and their performance as determined using Monte Carlo (MC) simulations, are described below.
Charged-particle tracks and collision vertices are reconstructed in the ID using the algorithms described in Ref. [39]. Inner detector tracks with pT > 0.4 GeV and |η| < 2.5 were required to satisfy a set of quality
criteria similar to those described in Ref. [19]. The total number of reconstructed ID tracks satisfying these selection criteria in a given event is called the multiplicity or Nchrec. The reconstruction and selection efficiency for primary [42] charged hadrons to meet these criteria was determined using a sample of 3 million minimum-bias p+Pb events simulated by the Hijing generator [43]. Events were generated with both beam configurations. The ATLAS detector response to the generated events was determined through a full Geant4 simulation [44,45], and the simulated events were reconstructed in the same way as the data. Over the measured kinematic range, the efficiency varies from approximately 50% for the lowest-pT
hadrons at large pseudorapidity, to greater than 90% for hadrons with pT > 3 GeV at mid-rapidity.
Jets are reconstructed using energy deposits in the calorimeter system, |η| < 4.9, in a range partially overlapping with both the ID and the FCal used to determine centrality. The reconstruction closely follows the procedure used in other measurements for Pb+Pb and pp collisions [46,47]. Jets are measured by applying the anti-ktalgorithm [48,49] with radius parameter R = 0.4 to energy deposits in the calorimeter. No jets with pT < 15 GeV are considered. An iterative procedure is used to obtain an event-by-event
estimate of the η-dependent underlying-event energy density, while excluding jets from that estimate. The jet kinematics are corrected for this background and for the detector response using an η- and pT-dependent
calibration derived from fully simulated and reconstructed Pythia 8 [50] hard-scattering events configured with the NNPDF23LO parton distribution function set [51] and the A14 set of tuned parameters [52] to model non-perturbative effects. An additional, small correction, based on in situ studies of jets recoiling against photons, Z bosons, and jets in other regions of the calorimeter, is applied [53,54]. Simulation studies show that for jets with pT > 75 GeV, the average reconstructed jet pTis within 1% of the generator
level jet pTand has a relative pTresolution below 10% after the calibration procedure.
5 Analysis procedure
This analysis is based on previous ATLAS two-particle correlation studies [19, 20]. To construct the two-particle correlation functions, the selected inner-detector tracks with pT > 0.4 GeV are divided into two
sets, referred to as A- and B-particles in this paper, although they are sometimes referred to as trigger and associated particles in the literature. To reduce the contribution of non-flow correlations from decays and jets, two restrictions are placed on A–B particle pairs drawn from the two sets. First, as was done in previous analyses [19,20], the particles are required to be separated in pseudorapidity with |∆ηAB|= |ηB−ηA| > 2. This requirement removes the short-range decay and jet fragmentation structure, while emphasising global, early-time correlations. Due to the enhanced contribution from jet correlations in the jet-triggered events, an additional constraint was developed for this analysis. Namely, B-particles are required to be separated in pseudorapidity by one unit from all reconstructed jets with pjetT > 15 GeV, i.e. |∆ηjB| = |ηB−ηjet| > 1. This latter requirement is only applied to the jet-triggered events, and in this way, the jets act as a source of high-pTA-particles but contribute few B-particles.
The correlation functions, S(∆φ), are defined as the yields of particle pairs passing the above event and pair selection, binned in ∆φ = φA−φB, and normalised by the total number of A-particles. Corrections for the imperfect trigger and tracking efficiencies are applied as weights to the entries of the correlation functions. A mixed-event correction, M(∆φ), is generated by correlating A-particles from one event with B-particles from a different event with a vertex z-position differing by less than 10 mm and a number of reconstructed charged particles (Nchrec) differing by less than 10 for Nchrec < 100 and less than 20 for Nchrec> 100. Thus, the mixed events contain only trivial detector acceptance effects and no physical correlations. To reduce the statistical uncertainty introduced by the correction, each event is mixed with five others meeting the above vertex z and Nchrecconditions. The corrected correlation is, then, Y (∆φ) = S(∆φ)/M(∆φ), where M(∆φ) is normalised such that the ratio preserves the overall integral of S(∆φ). Jet events are mixed with other jet events, and the |∆ηjB| condition is applied with respect to the jets in the A-particle event only. Thus, the B-particle acceptance is consistent between the same- and and mixed-event correlations.
To extract the anisotropy coefficients while accounting for residual non-flow, the ATLAS template fitting procedure, as used for previous results [19,20], is applied to Y (∆φ). In this procedure, Y (∆φ) is found for two different selections of event activity quantified by centrality: a central selection, Ycent(∆φ), and a peripheral selection, Yperi(∆φ). In this analysis, the peripheral selection corresponds to the 60–90% centrality interval. Assuming that the shape of the non-flow correlation is independent of centrality, Ycent(∆φ) is expressed as Ycent(∆φ) = FYperi(∆φ) + Gh 1 + 2 4 Õ n=2 vn,ncos(n∆φ)i , (1)
where F and each vn,nare parameters of a global χ2fit, and G is fixed by the requirement that the integral of the fit model is that of Ycent. The parameter F allows for a linear scaling of the non-flow between the two centrality classes. The fit includes the fourth harmonic, v4,4, but it is not presented in the results
because it is statistically insignificant. The fit χ2function incorporates the statistical uncertainties from both Ycentand the peripheral template, Yperi, although the examples shown in Figures1and2do not show the uncertainties of Yperifor readability. The statistical uncertainties of the extracted vn,nparameters are returned from the MINUIT χ2minimiser [55], accounting for correlations between parameters.
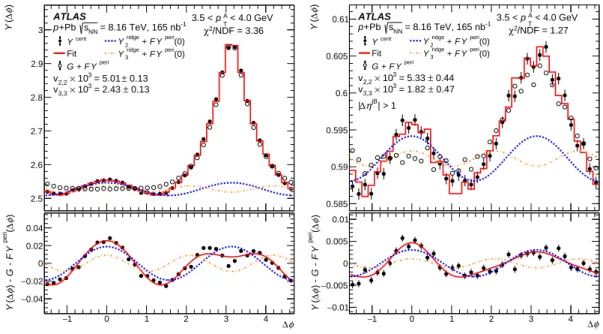
Figure1shows an example of two template fits using jet-triggered events with jet pT > 100 GeV. The
left plot shows the fit for correlations made without the B-particle jet rejection condition, and the right plot shows the same correlation, but with the condition |∆ηjB| > 1 applied. In this figure, YNridgerepresents the Nth-order harmonic component of the fit. The left plot has a dominant non-flow contribution, and a distortion in the resulting subtracted distribution is observed near ∆φ ≈ π. Removing much of the jet correlation in this way reduces the overall sensitivity to the template method assumption that the shape of the non-flow contribution is the same for the central and peripheral selections. However, violation of this assumption will introduce distortions that could potentially bias the harmonic coefficients. This is explicitly tested by varying the centrality selection of the peripheral template, as discussed further in Section6. Two additional examples of template fits from the jet-triggered events with jet pT > 100 GeV
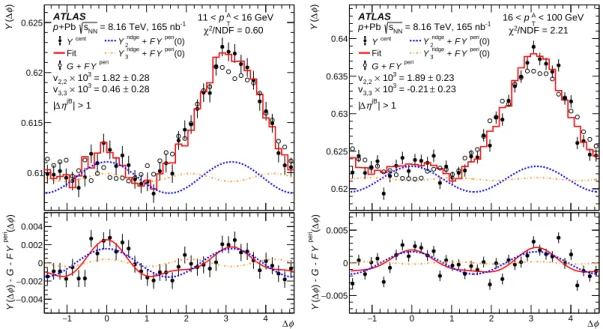
and with the B-particle jet rejection are plotted in Figure2. These show the behaviour of the template fits for high A-particle pT.
If the particle momentum correlations originate from a global field, as is the case for collective expansion, the vn,n will factorise such that vn,n(pAT, pBT) = vn(pAT) · vn(pBT). By assuming this relation and making
specific pTselections on A- and B-particles, the single-particle vn(pAT) can be obtained from
vn(pAT)= vn,n(pAT, pBT)/
q
vn,n(pBT, pBT),
1 − 0 1 2 3 4 φ ∆ 2.5 2.6 2.7 2.8 2.9 3 ) φ ∆ ( Y cent Y Fit peri Y F + G (0) peri Y F + ridge 2 Y (0) peri Y F + ridge 3 Y ATLAS -1 = 8.16 TeV, 165 nb NN s +Pb p < 4.0 GeV A T p 3.5 < 0.13 ± = 5.01 3 10 × 2,2 v 0.13 ± = 2.43 3 10 × 3,3 v /NDF = 3.36 2 χ 1 − 0 1 2 3 4 ∆φ 0.04 − 0.02 − 0 0.02 0.04 ) φ∆ ( peri Y F - G ) - φ∆ ( Y 1 − 0 1 2 3 4 φ ∆ 0.585 0.59 0.595 0.6 0.605 0.61 ) φ ∆ ( Y cent Y Fit peri Y F + G (0) peri Y F + ridge 2 Y (0) peri Y F + ridge 3 Y ATLAS -1 = 8.16 TeV, 165 nb NN s +Pb p < 4.0 GeV A T p 3.5 < 0.44 ± = 5.33 3 10 × 2,2 v 0.47 ± = 1.82 3 10 × 3,3 v /NDF = 1.27 2 χ | > 1 jB η ∆ | 1 − 0 1 2 3 4 ∆φ 0.01 − 0.005 − 0 0.005 0.01 ) φ ∆ ( peri Y F - G ) - φ ∆ ( Y
Figure 1: Template fitting output for events with jet pT > 100 GeV. Both require 3.5 < pAT < 4.0 GeV and are
made with 60–90% peripheral selection and 0–5% central selection. The left plot is made with no selection on the B-particles and the right plot is made requiring the B-particles to have |∆ηjB| > 1 relative to all jets with pjet
T > 15 GeV in the event. In the upper panels, the open circles show the scaled and shifted peripheral template
with uncertainties omitted, the closed circles show the central data, and the red line shows the fit (template and harmonic functions). The blue dashed line shows the second-order harmonic component, Y2ridge, and the orange dotted line shows the third-order harmonic component, Y3ridge(the n = 2 and n = 3 contributions to the sum in Eq.1, respectively). The lower panels show the difference between the central data and the peripheral template along with the second and third harmonic functions. The resulting v2,2, v3,3, and global fit χ2/NDF values are reported in the
legends. In these fits, NDF= 35.
where vn,n(pA T, p
B
T) is determined with A- and B-particles having pTin range p A T and p
B
T, respectively, and
vn,n(pBT, pBT) is determined with A- and B-particles both having pT in range pBT. In this analysis, this range
is nominally pBT > 0.4 GeV, although the dependence of the extracted anisotropy on this choice is explored in Section7.
The relative yield of particle pairs entering the correlation functions is estimated assuming a simple, two-component model of particle production. Particles are assumed to be produced either by hard scattering (HS) processes, such as jet production, or by soft underlying event (UE) processes. With this assumption, the correlation functions are constructed from pairs pulled from a mixture of the two sources. Particle pairs can be formed in the following four A–B combinations: UE–UE, UE–HS, HS–UE, and HS–HS. The event-by-event yields of the UE and HS processes are estimated by classifying the charged particles according to their azimuthal orientation relative to the leading jet or, in the case of MBT events that contain no jets with pT > 15 GeV and |η| < 4.9, relative to the leading hadron. The following regions are defined
relative to this leading vector: • towards: (|φB−φjet| < π 4) ∪ (|φB−φjet| > 3π 4 ) • transverse: π4 < |φB−φjet| < 3π4 .
1 − 0 1 2 3 4 φ ∆ 0.61 0.615 0.62 0.625 ) φ ∆ ( Y cent Y Fit peri Y F + G (0) peri Y F + ridge 2 Y (0) peri Y F + ridge 3 Y ATLAS -1 = 8.16 TeV, 165 nb NN s +Pb p < 16 GeV A T p 11 < 0.28 ± = 1.82 3 10 × 2,2 v 0.28 ± = 0.46 3 10 × 3,3 v /NDF = 0.60 2 χ | > 1 jB η ∆ | 1 − 0 1 2 3 4 ∆φ 0.004 − 0.002 − 0 0.002 0.004 ) φ ∆ ( peri Y F - G ) - φ ∆ ( Y 1 − 0 1 2 3 4 φ ∆ 0.62 0.625 0.63 0.635 0.64 ) φ ∆ ( Y cent Y Fit peri Y F + G (0) peri Y F + ridge 2 Y (0) peri Y F + ridge 3 Y ATLAS -1 = 8.16 TeV, 165 nb NN s +Pb p < 100 GeV A T p 16 < 0.23 ± = 1.89 3 10 × 2,2 v 0.23 ± = -0.21 3 10 × 3,3 v /NDF = 2.21 2 χ | > 1 jB η ∆ | 1 − 0 1 2 3 4 ∆φ 0.005 − 0 0.005 ) φ ∆ ( peri Y F - G ) - φ ∆ ( Y
Figure 2: Template fitting output for events with jet pT> 100 GeV with 60–90% peripheral selection and 0–5%
central selection. The left plot is made with 11 < pAT < 16 GeV and the right plot with 16 < pAT < 100 GeV. In the upper panels, the open circles show the scaled and shifted peripheral template with uncertainties omitted, the closed circles show the central data, and the red line shows the fit (template and harmonic functions). The blue dashed line shows the second-order harmonic component, Y2ridge, and the orange dotted line shows the third-order harmonic component, Y3ridge(the n = 2 and n = 3 contributions to the sum in Eq.1, respectively). The lower panels show the difference between the central data and the peripheral template along with the second and third harmonic functions. The resulting v2,2, v3,3, and global fit χ2/NDF values are reported in the legends. In these fits, NDF= 35.
Then, assuming that HS particles are completely contained in the towards region and the UE particles are distributed uniformly in azimuth, the following relations are inferred:
NUE = 2Ntrans,
NHS = Ntoward− Ntrans,
where NUEand NHSare the single-particle yields from UE and HS processes, respectively, and Ntransand
Ntowardare the particle yields in the transverse and toward regions, respectively. The quantities NUEand
NHS are statistically determined from the event averaged Ntrans and Ntoward and are, thus, insensitive to event-by-event fluctuations. However, it is not possible to classify individual particles. It should be noted that the assumptions used in this derivation are likely not perfect; for example, the UE is not uniformly distributed in φ, event by event, due to the presence of azimuthal anisotropy. The leading object may be more likely to be oriented with the anisotropy, in which case the UE yield would be underestimated and the HS yield overestimated. However, the analysis proceeds with the assumptions as given and includes no additional uncertainty for this potential effect.
The ∆ηABand ∆ηjBrejections produce a geometric correlation between the yields of A- and B-particles and, thus, the number of pairs is not the simple product of the two individual yields. Accounting for the dependencies, the total yield of particle pairs can be expressed in the following way
YX–Z= ∫ 2.5 −2.5 dNXA(ηA) dηA " ∫ 5 2 d2NZB(ηA, |∆ηAB|) dηAd|∆ηAB| d|∆η AB| # dηA, (2)
where X–Z could be any pairwise combination of UE and HS. In the case of jet events, the ∆ηjB condition is enforced when filling the ηAand ∆ηABdistributions so it’s effects are taken into account.
6 Systematic uncertainties
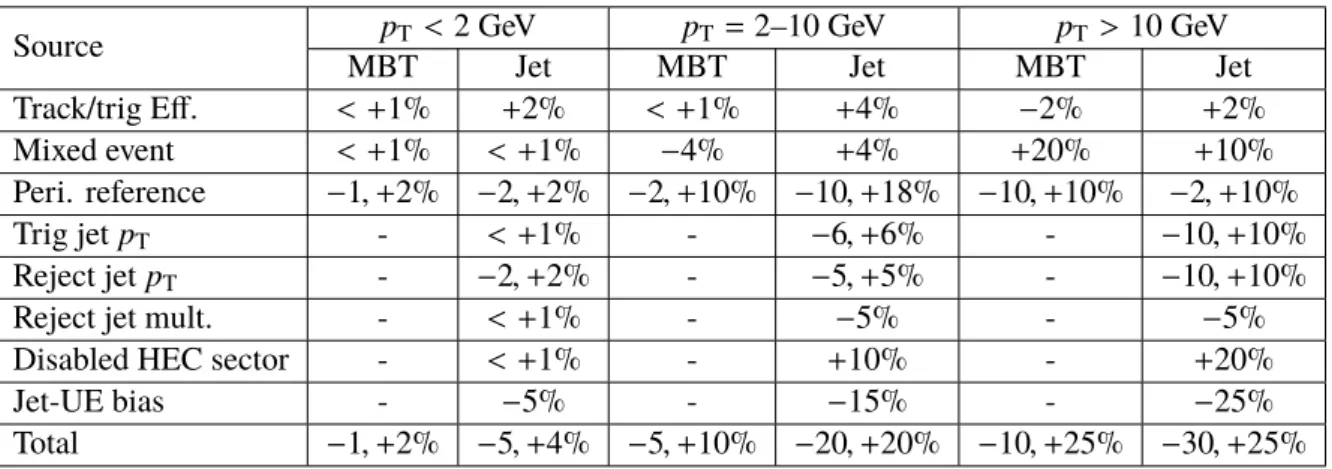
The systematic uncertainties fall into two categories: those associated with both the MBT and jet events and those associated with only the jet events. The uncertainties are determined by assessing the difference between the nominal value of v2 or v3 and the value after a given variation. Unless otherwise stated,
the uncertainties are defined as asymmetric one-standard-deviation errors. The final uncertainty is the quadrature sum of the uncertainty from each individual source. The relative downward and upward systematic uncertainties from different sources and all sources combined are shown for v2in Table1and
for v3in Table2. The rest of this section focuses primarily on the systematic uncertainties of v2. While the
absolute uncertainties in v2and v3are of similar magnitude, this represents larger relative uncertainties in
the v3values since they are generally smaller than the v2values at any given pT.
For both the MBT and jet events, the sensitivity to the trigger and tracking efficiency corrections was assessed by removing each. This variation (‘Track/trig Eff.’ in Table1) yields a 0–2% (2–4%) difference for MBT (jet) events, depending on track pT, and is subdominant. In the construction of the correlation
functions, the uncertainty in the mixed-event correction was again found by removing it from the analysis. This variation results in an uncertainty that vanishes at low pT but grows to 20% (10%) at high pT for
MBT (jet) events, but remains subdominant to statistical uncertainties over the whole pTrange. Regarding
the template fitting procedure, the centrality range for the peripheral reference selection was varied from the nominal 60–90% to 50–70% and 70–90%. This variation (‘Peri. reference’) results in an uncertainty of about 2% at low pTand increasing to about 10% or 18% in the mid pTrange between 2 and 10 GeV
depending on the event trigger. This last uncertainty is dominant in this category for most of the pT
range probed in the measurement. At high pT, the sensitivity of the measurements in MBT events to the
mixed event correction and reference selection is significantly higher than in jet events; this is particularly noticeable for the v3values, where the relative uncertainties in the MBT events for pT > 10 GeV are 5–10
times larger than in the jet-triggered events.
The following set of uncertainties is associated with jet events only. To assess the sensitivity to the uncertainty in the jet energy scale and the impact of imperfect trigger efficiency, the jet pT thresholds
used to select events were varied from 75 GeV and 100 GeV to 80 GeV and 105 GeV, respectively. This variation (‘Trig jet pT’) results in a symmetric uncertainty that is smaller than 1% at low particle pTand
that increases to about 10% with increasing pT. It is subdominant to other sources in this category. The
jets used in the B-particle jet rejection were varied to include only jets with pTgreater than 20 GeV instead
of the nominal 15 GeV (‘Reject jet pT’). The 2% and 10% differences at low and high pTare incorporated
as a symmetric uncertainty that is subdominant to other sources in this category. The ∆ηjB rejection allows jets to be composed of only a single particle that may originate in the tail of the UE particle pT
spectrum. Thus, the jets used in this rejection were varied to require at least three tracks in a ∆R = 0.4 cone around the jet axis (‘Reject jet mult.’). The uncertainty associated with this variation is about 5%
Table 1: Systematic uncertainty summary for anisotropy coefficients v2. The values are approximate, as they represent
the average variation in each pTrange, and are reported relative to v2. Negative and positive values indicate downward
and upward uncertainties respectively. Commas separate the downward and upward uncertainty where applicable.
Source pT < 2 GeV pT= 2–10 GeV pT > 10 GeV
MBT Jet MBT Jet MBT Jet
Track/trig Eff. < +1% +2% < +1% +4% −2% +2%
Mixed event < +1% < +1% −4% +4% +20% +10%
Peri. reference −1, +2% −2, +2% −2, +10% −10, +18% −10, +10% −2, +10%
Trig jet pT - < +1% - −6, +6% - −10, +10%
Reject jet pT - −2, +2% - −5, +5% - −10, +10%
Reject jet mult. - < +1% - −5% - −5%
Disabled HEC sector - < +1% - +10% - +20%
Jet-UE bias - −5% - −15% - −25%
Total −1, +2% −5, +4% −5, +10% −20, +20% −10, +25% −30, +25%
and subdominant to the others in this category. An additional uncertainty is used to cover the impact of a sector of the hadronic endcap calorimeter (HEC) being disabled for the running period. The disabled sector was in the range 1.5 < η < 3.2 and −π < φ < −π/2. This uncertainty (‘Disabled HEC sector’) was assessed by requiring all B-particles to be outside the pseudorapidity region of the disabled HEC. The difference was found to be less than 1% at low pT and about 20% at high pT, where it is the dominant
positive uncertainty. Finally, an uncertainty is assigned to account for the potential of the UE to bias the event selection. The azimuthal modulation of the UE increases the reconstructed pT of jets aligned
with the flow orientation, and, thus, the event-wise jet-pTthreshold will bias the events to have more jets
correlated with the flow plane. The impact of this effect on the measured results was assessed in simulation by mixing jet events with a realistic UE containing azimuthal anisotropy. The resulting uncertainty only affects v2, is the dominant negative uncertainty for track pT greater than 3 GeV, and is about 30% (20%)
for jet-triggered events with jet pT > 75 GeV (100 GeV). The effect is larger for lower-pTjets because the
UE energy contribution is independent of jet energy. For a power-law spectrum, a given threshold change has a greater fractional effect on the yield for smaller values of the threshold.
In summary, the uncertainty in v2from the peripheral reference selection was found to be dominant for pT
less than 10 GeV for MBT events, above which, the mixed event correction uncertainty is dominant, and between 2 and 5 GeV for jet events. The uncertainties associated with the jet selection were found to be dominant for pT & 10 GeV in jet events. The total uncertainty in MBT events ranges from (−1%, +2%) at
low pTto about (−10%, +25%) at high pT. For jet events, the total uncertainty ranges from about (−5%,
+4%) at low pT to about (−35%, +50%) and (−30%, +25%) at high pTfor events with jet pT > 75 GeV
and jet pT > 100 GeV respectively.
The uncertainties associated with the measurement of particle pair yields are generated from some of the variations discussed above, namely the track and trigger efficiency variation, the trigger jet pTthreshold
variation, and each B-particle jet rejection variation. An additional variation was made to test the assumption that the toward region contains all HS particles. The two transverse region sides were tagged as having the minimum and maximum number of tracks out of the two. The pair yields were, then, calculated using the minimum and maximum sides only, as separate variations. This variation produces the dominant uncertainty in the relative pair yields, defined in Eq. (2), for all particle combinations at all pT.
Table 2: Systematic uncertainty summary for anisotropy coefficients v3. The values are approximate, as they represent
the average variation in each pTrange, and are reported relative to v3. Negative and positive values indicate downward
and upward uncertainties respectively. Commas separate the downward and upward uncertainty where applicable.
Source pT < 2 GeV pT = 2–10 GeV pT > 10 GeV
MBT Jet MBT Jet MBT Jet
Track/trig Eff. +1% +4% < +6% −7% −5% −7%
Mixed event < +1% −4% −20% +6% −200% +20%
Peri. reference −2, +2% −7, +10% −8, +8% −20, +10% −150, +100% −30, +30%
Trig jet pT - < +1% - −10, +10% - −40, +40%
Reject jet pT - −2, +2% - −15, +15% - −15, +15%
Reject jet mult. - < +1% - +5% - +20%
Disabled HEC sector - −2% - −5% - −10%
Total −2, +2% −10, +10% −20, +10% −30, +20% −250, +100% −50, +50%
7 Results
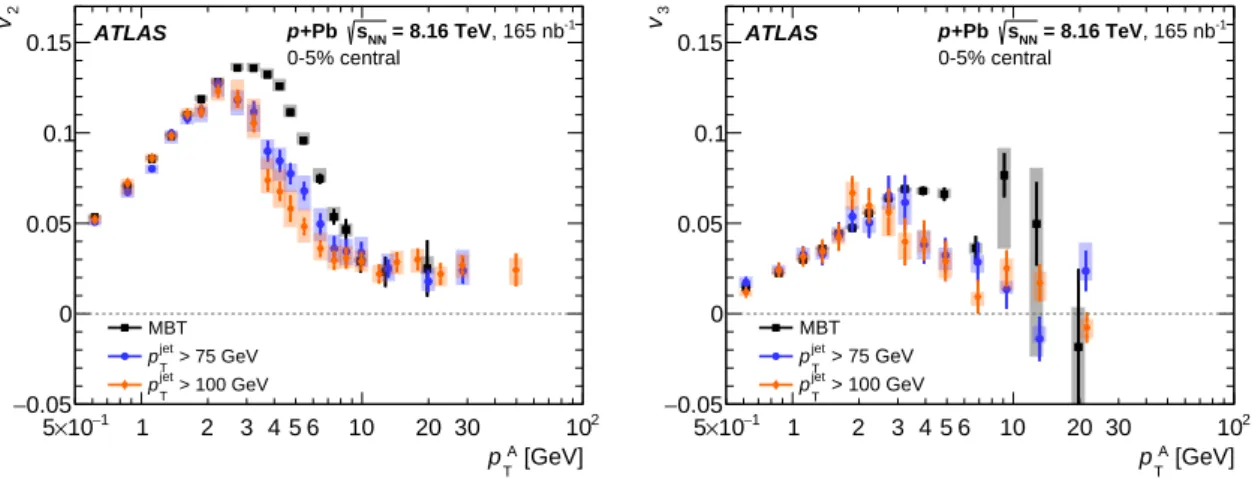
Figure3shows the extracted second- (v2) and third-order (v3) anisotropy coefficients for the MBT events
compared to those from both selections of jet events plotted as a function of A-particle pT in the range
0.5 < pT < 100 GeV. Each set of values is from events with the same 0–5% centrality selection. Points
are located on the horizontal axis at the mean pTof tracks within any given bin. The v2and v3coefficients
increase as a function of pT in the low pTregion (pT < 2–3 GeV), then decrease (2–3 < pT < 9 GeV), and
finally plateau for high pT(pT > 9 GeV). The v2coefficients are consistent with being independent of pT
for pT > 9 GeV, while the larger uncertainties in the values of v3preclude any strong conclusion.
1 − 10 × 5 1 2 3 4 5 6 10 20 30 102 [GeV] A T p 0.05 − 0 0.05 0.1 0.15 2 v MBT > 75 GeV jet T p > 100 GeV jet T p ATLAS p+Pb sNN = 8.16 TeV, 165 nb-1 0-5% central 1 − 10 × 5 1 2 3 4 5 6 10 20 30 102 [GeV] A T p 0.05 − 0 0.05 0.1 0.15 3 v MBT > 75 GeV jet T p > 100 GeV jet T p ATLAS p+Pb sNN = 8.16 TeV, 165 nb-1 0-5% central
Figure 3: Distribution of v2(left) and v3(right) plotted as a function of the A-particle pT. Values from MBT events
are plotted as black squares, and those from events with jet pT > 75 GeV and events with jet pT > 100 GeV are
plotted as blue circles and orange diamonds respectively. Statistical uncertainties are shown as narrow vertical lines on each point, and systematic uncertainties are presented as coloured boxes behind the points.
The v2 results show agreement within uncertainties between the MBT and jet events for the low pT
(pT . 2 GeV) and high pT (pT & 9 GeV) regions. For the intermediate pTregion, the MBT events yield a
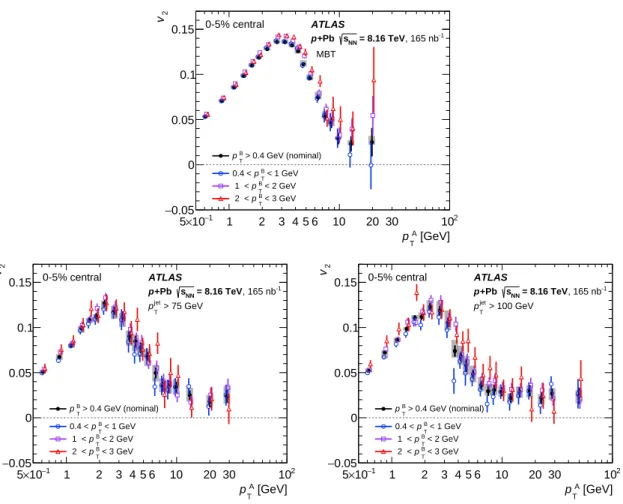
show agreement between the MBT and jet events for pT < 2 GeV, and higher values from MBT events for pT> 2 GeV. 1 − 10 × 5 1 2 3 4 5 6 10 20 30 102 [GeV] A T p 0.05 − 0 0.05 0.1 0.15 2 v < 1 GeV B T p 0.4 < < 2 GeV B T p 1 < < 3 GeV B T p 2 < > 0.4 GeV (nominal) B T p ATLAS -1 , 165 nb = 8.16 TeV NN s +Pb p 0-5% central MBT 1 − 10 × 5 1 2 3 4 5 6 10 20 30 102 [GeV] A T p 0.05 − 0 0.05 0.1 0.15 2 v < 1 GeV B T p 0.4 < < 2 GeV B T p 1 < < 3 GeV B T p 2 < > 0.4 GeV (nominal) B T p ATLAS -1 , 165 nb = 8.16 TeV NN s +Pb p 0-5% central > 75 GeV jet T p 1 − 10 × 5 1 2 3 4 5 6 10 20 30 102 [GeV] A T p 0.05 − 0 0.05 0.1 0.15 2 v < 1 GeV B T p 0.4 < < 2 GeV B T p 1 < < 3 GeV B T p 2 < > 0.4 GeV (nominal) B T p ATLAS -1 , 165 nb = 8.16 TeV NN s +Pb p 0-5% central > 100 GeV jet T p
Figure 4: Measured v2 values plotted as a function of the A-particle pTfor MBT events (top), events with jet
pT> 75 GeV (bottom left), and events with jet pT> 100 GeV (bottom right). The nominal values (closed black circles) are overlaid with points generated by making different B-particle pTselections: 0.4 < pBT< 1 GeV (blue open
circles), 1 < pBT< 2 GeV (open violet squares), and 2 < pBT< 3 GeV (open red triangles). The points with different B-particle pTselections are offset slightly from the nominal horizontal-axis positions to make the uncertainties
visible. For clarity, systematic uncertainties are omitted from the three sets of restricted B-particle pTranges; they
are, however, consistent with those from the inclusive results and are highly correlated between the selections.
As mentioned in Section5, if the measured anisotropy originates from a global momentum field, the v2
and v3values, extracted for a given pAT range, will be independent of B-particle selection. This assumption
of factorisation is explicitly tested by carrying out the analysis for different selections of pBT. Figure4
shows the v2values, from each event trigger, for the nominal results using pBT > 0.4 GeV overlaid with
results using 0.4 < pBT < 1 GeV, 1 < pBT < 2 GeV, and 2 < pBT < 3 GeV. The test shows factorisation breaking at the level of 5% for pAT < 5 GeV in MBT events. However, at higher pAT, the differences grow with pAT to be 10–100% from the nominal values. For jet events, factorisation holds within about 10–20% for all values of pAT, except for 4 < pAT < 9 GeV in pjetT > 100 GeV events, where it is within about 30–40%. Although the large uncertainties prevent strong conclusions from being drawn, there is a hint of a difference in behaviour at high pAT where the factorisation breaking is greater for MBT events than for jet
events. This result could be due to the B-particle jet rejection scheme used for the jet events. Correlations resulting from hard-process, e.g. from back-to-back jets, specifically violate the factorisation assumption, and the B-particle jet rejection dramatically limits the contribution from these processes from entering the correlation functions in jet events. However, the correlations from MBT events have no such rejection, and could, therefore, be more susceptible to hard-process correlations at high pAT.
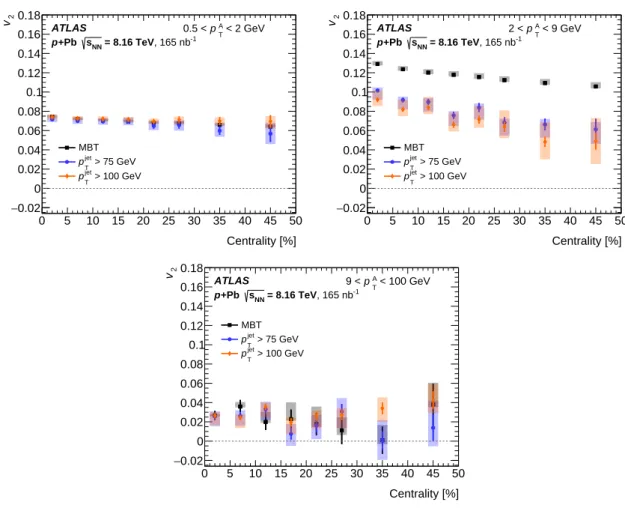
0 5 10 15 20 25 30 35 40 45 50 Centrality [%] 0.02 − 0 0.02 0.04 0.06 0.08 0.1 0.12 0.14 0.16 0.18 2 v MBT > 75 GeV jet T p > 100 GeV jet T p ATLAS -1 , 165 nb = 8.16 TeV NN s +Pb p < 2 GeV A T p 0.5 < 0 5 10 15 20 25 30 35 40 45 50 Centrality [%] 0.02 − 0 0.02 0.04 0.06 0.08 0.1 0.12 0.14 0.16 0.18 2 v MBT > 75 GeV jet T p > 100 GeV jet T p ATLAS -1 , 165 nb = 8.16 TeV NN s +Pb p < 9 GeV A T p 2 < 0 5 10 15 20 25 30 35 40 45 50 Centrality [%] 0.02 − 0 0.02 0.04 0.06 0.08 0.1 0.12 0.14 0.16 0.18 2 v MBT > 75 GeV jet T p > 100 GeV jet T p ATLAS -1 , 165 nb = 8.16 TeV NN s +Pb p < 100 GeV A T p 9 <
Figure 5: Distribution of v2 plotted as a function of centrality for MBT events (black squares), events with jet
pT > 75 GeV (blue circles), and events with jet pT > 100 GeV (orange diamonds). The results are obtained in three different selections of the A-particle pT: 0.5 < pT < 2 GeV (top left), 2 < pT < 9 GeV (top right), and
9 < pT< 100 GeV (bottom). Statistical uncertainties are shown as narrow vertical lines on each point, and systematic
uncertainties are presented as coloured boxes behind the points.
Figure 5 shows v2 plotted as a function of centrality for MBT events and both classes of jet events.
The results are divided into three regions in A-particle pT: 0.5 < pT < 2 GeV, 2 < pT < 9 GeV, and
9 < pT < 100 GeV. The v2 results show agreement, within uncertainties, between the MBT and jet
events for pTselections 0.5 < pT < 2 GeV and pT > 9 GeV for all centralities and are found to be nearly
independent of centrality. For 2 < pT < 9 GeV, the MBT events give a higher v2value than the jet events,
and all three sets show a trend to lower values of v2as the collisions become more peripheral.
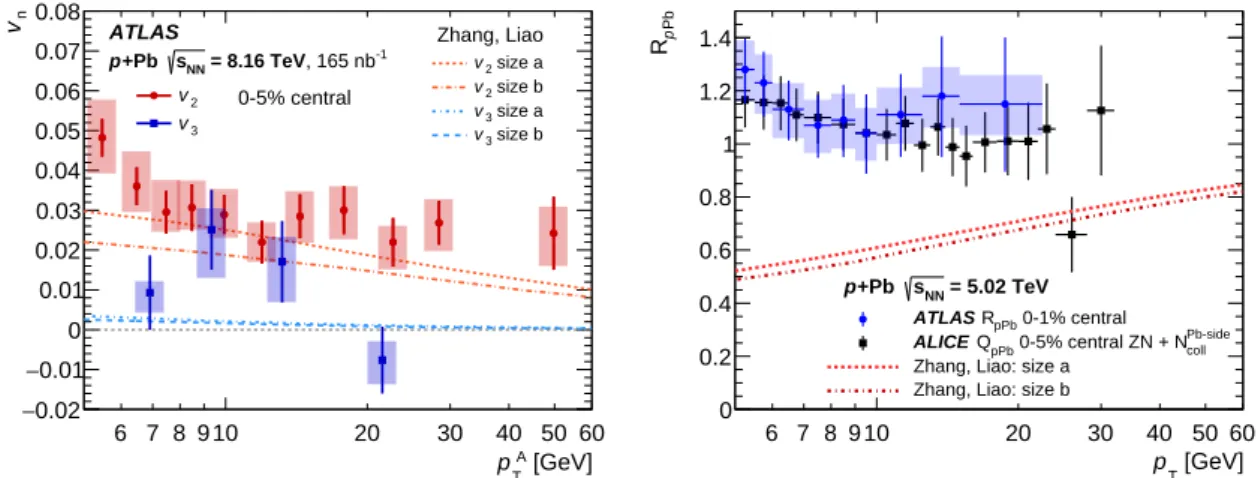
Focusing on the overall pTdependence of the anisotropies, Figure6(left panel) shows v2and v3coefficients
from events with jet pT > 100 GeV compared with theoretical calculations from Ref. [14]. This theoretical
6 7 8 9 10 20 30 40 50 60 [GeV] A T p 0.02 − 0.01 − 0 0.01 0.02 0.03 0.04 0.05 0.06 0.07 0.08 n v Zhang, Liao size a 2 v size b 2 v size a 3 v size b 3 v 2 v 3 v ATLAS -1 , 165 nb = 8.16 TeV NN s +Pb p 0-5% central 6 7 8 9 10 20 30 40 50 60 [GeV] T p 0 0.2 0.4 0.6 0.8 1 1.2 1.4 Pb p R = 5.02 TeV NN s +Pb p
= 5.02 TeV
NN
s
p+Pb
ATLAS RpPb 0-1% central Pb-side coll 0-5% central ZN + N pPb Q ALICEZhang, Liao: size a Zhang, Liao: size b
Figure 6: Coefficients v2 and v3 (left panel) and RpPb(right panel) plotted as a function of particle pTfor p+Pb
collisions. The left panel is for central 0–5% events from the jet pT> 100 GeV event sample. Statistical uncertainties
are shown as narrow vertical lines on each point, and systematic uncertainties are presented as coloured boxes behind the points. The left panel has two sets of curves showing theoretical predictions from a jet quenching framework with two different initial geometries in 0–4% central collisions [14]; the upper two (red/orange) are v2for ‘size a’ (dotted)
and ‘size b’ (dash-dotted) configurations, and the lower two (blue) are v3where the ‘size a’ (dash-dotted) and ‘size b’
(dashed) curves are nearly indistinguishable from each other. The right panel shows RpPbdata from ATLAS [57] and QpPbdata from ALICE [41]. Theoretical calculations (red/orange lines) from Ref. [14] are also shown in this panel; the dotted line gives the results of the ‘size a’ configuration and the dash-dotted line gives the results of the ‘size b’ configuration.
transition temperature, which helps to reduce the tension in simultaneously matching the nucleus–nucleus high-pThadron spectrum suppression and the azimuthal anisotropy v2. The calculation tests two different
initial p+Pb geometries referred to as ‘size a’ and ‘size b’, where the latter has a smaller initial QGP volume. The predictions are slightly lower than the data for both v2and v3, and the ‘size a’ curve is within two standard
deviations of all points. However, in the right panel of Figure6, the same calculation predicts a substantial suppression of high-pThadrons, as expressed by the quantity RpPb = d2NpPb/dpTdy/(TpPb×d2σp p/dpTdy)
where TpPbrepresents the nuclear thickness of the Pb nucleus, as determined via a Monte Carlo Glauber calculation [56]. Shown in comparison are published experimental results from ATLAS and ALICE for RpPb in central events that are consistent with no nuclear suppression, i.e. RpPb = 1 [41, 57]. The ALICE experiment uses the notation QpPbfor the same quantity to describe a bias that may exist due to the centrality categorisation. There are uncertainties in the experimental measurements related to the centrality or multiplicity selection in p+Pb collisions, particularly in determining the nuclear thickness value TpPb. However, there is no indication of the large RpPbsuppression predicted by the jet quenching calculation. Thus, the jet quenching calculation is disfavoured as it cannot simultaneously describe the non-zero high-pTazimuthal anisotropy and the lack of yield suppression.
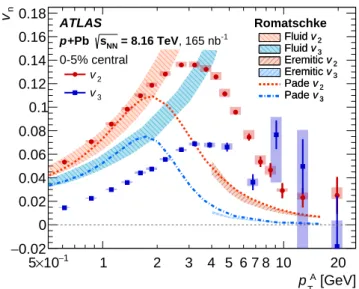
Figure7shows the MBT v2 and v3 coefficients compared with theoretical calculations from Ref. [26].
The calculations are derived from two opposite limits of kinetic theory. The low momentum bands represent zeroth-order hydrodynamic calculations for high-multiplicity p+Pb events that give quantitative agreement with v2 up to pT = 2 GeV while predicting values of v3 that are too high. Above some high
pTthreshold, hadrons are expected to result, not from hydrodynamics, but instead from jets where the resulting partons have the opposite limit than in hydrodynamics, i.e. a large mean free path. To model this region, a non-hydrodynamic ‘eremitic’ expansion calculation (see Ref. [26] for the detailed calculation), shown as the bands at high pT, indicates slowly declining v2and v3coefficients. The dashed lines are a
simple Padé-type fit connecting the two regimes [26]. The trends are qualitatively similar to those in the data, although there is not quantitative agreement. In particular, the calculation predicts values of v2and
v3substantially below the experimental results for pT = 4–15 GeV. It should be noted that calculations
presented in Ref. [26] are performed, consistently between the hydrodynamic and eremitic components, only for massless partons and with an ideal equation of state. Thus, one does not expect quantitative agreement and is looking for rather qualitative trends. More sophisticated treatments in the hydrodynamic regime result in better quantitative agreement with the anisotropy coefficients at low pT[58,59]. It is worth
highlighting that traditional parton energy-loss calculations connect the high-pTv2with a suppression in
the overall yield of high-pTparticles. The same is true with this eremitic calculation, and thus, it should
also be in contradistinction to p+Pb high-pTexperimental data indicating almost no suppression, i.e. jet
quenching.
Another possible source of the high-pTanisotropies could lie in an initial-state effect, potentially encoded
in a model such as Pythia 8. Shown in Figure8is a Pythia 8 calculation with hard2 pp events overlaid on minimum-bias p+Pb events generated in the default Angantyr framework [60]. It is emphasised that this version of Pythia does not include the recently developed string–string, or so-called string shoving, implementation [61]. The generator-level charged particles are then processed with the entire analysis procedure, including the non-flow template fit. The result is a negative v2,2 for all momenta,
in contradistinction to the experimental data. Further investigation reveals that Pythia 8 run in ‘hard’ scattering mode has correlations with large pseudorapidity separation between particle pairs as a result of the specific implementation of initial-state radiation. This correlation is reduced in high-multiplicity
2The term ‘hard’ refers to Pythia 8 run with the following settings: HardQCD:all=on, PartonLevel:MPI=off, and containing
a jet with pT> 100 GeV.
1 − 10 × 5 1 2 3 4 5 6 7 8 10 20 [GeV] A T p 0.02 − 0 0.02 0.04 0.06 0.08 0.1 0.12 0.14 0.16 0.18 n v Romatschke 2 v Fluid 3 v Fluid 2 v Eremitic 3 v Eremitic 2 v Pade 3 v Pade 2 v Fluid 3 v Fluid 2 v Eremitic 3 v Eremitic 2 v Pade 3 v Pade 2 v 3 v ATLAS -1 , 165 nb = 8.16 TeV NN s +Pb p 0-5% central
Figure 7: Coefficients v2and v3plotted as a function of pTfor central 0–5% p+Pb collisions from the MBT event
sample. Theoretical calculations relevant to the low-pTregime from hydrodynamics and to the high-pTregime from
an ‘eremitic’ framework from Romatschke [26] are also shown. The lines are Padé-type fits connecting the two regimes, where the red dotted line is for v2and the blue dash-dotted line is for v3. Statistical uncertainties are shown
events because of the large number of uncorrelated UE particles, and thus results in a negative v2,2after
subtracting the non-flow contribution.
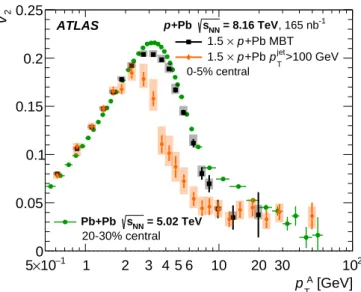
Figure9shows the published Pb+Pb results for v2as a function of pTin the 20–30% centrality selection [62]
1 − 0 1 2 3 4 φ ∆ 103.5 104 104.5 105 105.5 ) φ ∆ ( Y cent Y Fit peri Y F + G (0) peri Y F + ridge 2 Y (0) peri Y F + ridge 3 Y PYTHIA8 = 8.16 TeV NN s +Pb p < 1.75 GeV A T p 1.50 < 0.11 ± = -5.05 3 10 × 2,2 v 0.05 ± = 0.69 3 10 × 3,3 v /NDF = 1.20 2 χ | > 1 jB η ∆ | 1 − 0 1 2 3 4 ∆φ 0.5 − 0 0.5 ) φ ∆ ( peri Y F - G ) - φ ∆ ( Y 1 − 0 1 2 3 4 φ ∆ 141 142 143 144 145 ) φ ∆ ( Y cent Y Fit peri Y F + G (0) peri Y F + ridge 2 Y (0) peri Y F + ridge 3 Y PYTHIA8 = 8.16 TeV NN s +Pb p < 100 GeV A T p 45 < 0.10 ± = -0.10 3 10 × 2,2 v 0.10 ± = -0.20 3 10 × 3,3 v /NDF = 1.04 2 χ | > 1 jB η ∆ | 1 − 0 1 2 3 4 ∆φ 0.2 − 0 0.2 ) φ ∆ ( peri Y F - G ) - φ ∆ ( Y 1 − 10 × 5 1 2 3 4 5 6 10 20 30 102 [GeV] A T p 0.008 − 0.007 − 0.006 − 0.005 − 0.004 − 0.003 − 0.002 − 0.001 − 0 0.001 2,2 v 0-5% central = 8.16 TeV NN s PYTHIA8 +Pb Angantyr UE p > 100 GeV jet T p hard pp
Figure 8: Predictions of azimuthal anisotropy from Pythia 8 using the same two-particle formalism used for the data results. The events combine minimum-bias p+Pb underlying events generated in the Angantyr framework with hard pp events that require the presence of a jet with pT> 100 GeV. The two top plots show example correlation
functions, with template fits, from a low particle-pTselection (top left) and a high particle-pTselection (top right).
In the upper panels of the two top plots, the open circles show the scaled and shifted peripheral template with uncertainties omitted, the closed circles show the central data, and the red histogram shows the fit (template and harmonic functions). The blue dashed line shows the second-order harmonic component, Y2ridge, and the orange dashed line shows the third-order harmonic component, Y3ridge(the n = 2 and n = 3 contributions to the sum in Eq.1, respectively). The lower panels show the difference between the central data and the peripheral template along with the second and third harmonic functions. The resulting v2,2, v3,3, and global fit χ2/NDF values are reported in the
legends, where NDF = 35. The bottom plot shows the extracted v2,2values as a function of A-particle pT.
compared to the v2from both the MBT p+Pb data and p+Pb containing a jet with pT > 100 GeV. This
Pb+Pb centrality range is selected because the spatial elliptic eccentricity is approximately the same as in 0–5% centrality p+Pb collisions [63], despite having a much larger total particle multiplicity. The overall trends for Pb+Pb v2 as a function of pTare qualitatively similar to those presented here for p+Pb from
MBT events and the jet events with jet pT > 100 GeV. Both sets of the p+Pb values are scaled by a
single multiplicative factor (1.5) to match the Pb+Pb rise at low pT. After scaling, the MBT p+Pb results
quantitatively agree with those from the Pb+Pb system for 0.5 < pT < 8 GeV, except for a slight difference
in the peak value near pT ≈ 3 GeV. For pTabove about 8 GeV, the Pb+Pb results indicate a slow decline
of v2values with increasing pT, while the p+Pb results exhibit more of a plateau. Strikingly, the overall
behaviour of the v2values are quite similar.
As described above, the physics interpretations of the Pb+Pb elliptic anisotropies are hydrodynamic flow at low pT, differential jet quenching at high pT, and a transition between the two in the intermediate
region of approximately 2 < pT < 10 GeV. Since these effects all relate to the initial QGP geometric
inhomogeneities, a common shape with a single scaling factor for p+Pb could indicate a common physics interpretation. This scaling factor of 1.5, as empirically determined, may be the result of slightly different initial spatial deformations, or from the much larger Pb+Pb overall multiplicity, which enables a stronger translation of spatial deformations into momentum space. For the high pTregion, this presents a conundrum
in that it is difficult for differential jet quenching to cause the v2anisotropy in p+Pb collisions when there
is no evidence for jet quenching overall. These measurements showing non-zero high pT v2 in p+Pb
collisions in the absence the jet quenching observed in Pb+Pb collisions suggest there might be additional contributions to v2at high pT in Pb+Pb collisions.
1 − 10 × 5 1 2 3 4 5 6 10 20 30 102 [GeV] A T p 0 0.05 0.1 0.15 0.2 0.25 2 v 20-30% central -1 , 165 nb = 8.16 TeV NN s +Pb p 0-5% central ATLAS = 5.02 TeV NN s Pb+Pb +Pb MBT p × 1.5 >100 GeV jet T p +Pb p × 1.5
Figure 9: Scaled p+Pb v2values plotted as a function of the A-particle pToverlaid with v2 from 20–30% central
Pb+Pb data at√sNN = 5.02 TeV [62]. Results from MBT and jet pT> 100 GeV p+Pb events are plotted as black
squares and orange diamonds, respectively, and those from Pb+Pb are plotted as green circles. Statistical uncertainties are shown as narrow vertical lines on each point, and systematic uncertainties are presented as coloured boxes behind the points.
Returning to the issue of the difference in the intermediate pTregion between the p+Pb MBT and jet event
simplified picture one can classify hadrons as originating from hard scatterings (HS) or from the underlying event (UE). Thus, pairs of particles of A and B types can come from the combinations HS–HS, HS–UE, UE–HS, and UE–UE. Figure10presents the measured pair fractions for both MBT and jet, 0–5% central events plotted as a function of the A-particle pT. UE–UE pairs dominate the correlation functions at low
pTin each case, and HS–UE combinations dominate at high pT. Combinations with HS B-particles are
sub-dominant, because there are fewer jet particles than UE particles in central events; for the jet selected events, these combinations are further suppressed by the B-particle jet rejection condition. Figure11shows the dominant contributions from the MBT and jet events overlaid. Although the same qualitative behaviour is found in each case, the point at which the HS–UE pairs become dominant over the other combinations is at a lower pTfor jet events than for MBT events.
This behaviour can also be seen in Figure12, in which the pair fractions are plotted as a function of centrality, and again, the values for MBT and jet events are overlaid. The centrality-dependent results are plotted for low, medium, and high A-particle pT ranges in the same way as in Figure5. At low pT, pair
fractions from MBT and jet events agree, and in the mid-pTtransition region, MBT events have a larger
UE–UE contribution and smaller HS–UE contribution compared to jet events. At high pT, central events
show a difference between UE–UE and HS–UE that is reduced in more-peripheral events and absent for more peripheral than 25% centrality. The overall trend of the pair fractions with centrality is quite similar to that of v2shown in Figure5; little centrality dependence for low and high pT, and significant centrality
dependence in addition to MBT–jet event ordering in the mid-pTtransition region.
Thus, a potential explanation for the lower v2and v3in the intermediate pTregion is simply that, in that
region, the HS particles have lower anisotropy coefficients than UE particles, and MBT events have a larger fraction of UE–UE pairs than jet-triggered events. In the low and high pTregions, the same types of pairs
dominate in both the MBT and jet-triggered events, namely UE–UE and HS–UE respectively, and hence the anisotropy coefficients agree between the event samples. If this explanation is correct, it also aids in understanding Figure9in which there is a significant difference between the p+Pb jet event v2 and the
Pb+Pb v2in the intermediate pT region, because the relative pair fractions are potentially significantly
different.
This particle mixing picture is attractive in that it naturally explains the general shape of the v2(pT) and
v3(pT) distributions as well as the ordering of the different event samples. However, it is noted that the correspondence between the differences in the flow coefficients and pair fractions is not quantitative; the differences in the flow coefficients are fractionally much larger than the differences in the pair fractions. Thus, there are either additional sources of correlation or our assumptions are violated in some way (e.g. the two assumed HS and UE sources are too simplistic or the measured pair fractions do not accurately represent the sources, as is discussed in Section5). That said, for particle pT > 20 GeV, where particle
production in any model is thought to arise mainly from jet fragmentation, the non-zero v2demonstrates
that a positive correlation exists between hard (high pT) and soft (low pT) particles, irrespective of the pair
fractions.
1 − 10 × 5 1 2 3 4 5 6 10 20 30 102 [GeV] A T p 0 0.2 0.4 0.6 0.8 1 1.2 Pair fraction ATLAS = 8.16 TeV NN s +Pb p MBT, 0-5% central UE - UE pairs HS - UE pairs HS - HS pairs UE - HS pairs -1 = 165 nb int L 1 − 10 × 5 1 2 3 4 5 6 10 20 30 102 [GeV] A T p 0 0.2 0.4 0.6 0.8 1 1.2 Pair fraction ATLAS = 8.16 TeV NN s +Pb p > 75 GeV jet T p 0-5% central -1 = 165 nb int L UE - UE pairs HS - UE pairs HS - HS pairs UE - HS pairs 1 − 10 × 5 1 2 3 4 5 6 10 20 30 102 [GeV] A T p 0 0.2 0.4 0.6 0.8 1 1.2 Pair fraction ATLAS = 8.16 TeV NN s +Pb p > 100 GeV jet T p 0-5% central -1 = 165 nb int L UE - UE pairs HS - UE pairs HS - HS pairs UE - HS pairs
Figure 10: Particle pair yield composition fractions for MBT events (top), events with jet pT> 75 GeV (bottom left),
and events with jet pT> 100 GeV (bottom right) plotted as a function of the A-particle pT. Green and blue open
circles represent HS–HS and UE–HS pairs, respectively, and red and violet closed circles represent UE–UE and HS–UE pairs, respectively. Statistical uncertainties are shown as narrow vertical lines on each point, and systematic uncertainties are presented as coloured boxes behind the points.
1 − 10 × 5 1 2 3 4 5 6 10 20 30 102 [GeV] A T p 0 0.2 0.4 0.6 0.8 1 1.2 Pair fraction ATLAS = 8.16 TeV NN s +Pb p 0-5% central -1 = 165 nb int L MBT > 75 GeV jet T p > 100 GeV jet T p UE - UE pairs HS - UE pairs
Figure 11: Underlying event–underlying event (UE–UE) (open circles) and hard scatter–underlying event (HS–UE) (open squares) particle-pair yield composition fractions for MBT events (black), events with jet pT> 75 GeV (blue),
and events with jet pT> 100 GeV (orange) plotted as a function of the A-particle pT. Statistical uncertainties are
shown as narrow vertical lines on each point, and systematic uncertainties are presented as coloured boxes behind the points.
0 10 20 30 40 50 60 Centrality [%] 0 0.2 0.4 0.6 0.8 1 1.2 Pair fraction ATLAS -1 , 165 nb = 8.16 TeV NN s +Pb p 0-5% central MBT > 75 GeV jet T p > 100 GeV jet T p < 2 GeV A T p 0.5 < UE - UE pairs HS - UE pairs 0 10 20 30 40 50 60 Centrality [%] 0 0.2 0.4 0.6 0.8 1 1.2 Pair fraction ATLAS -1 , 165 nb = 8.16 TeV NN s +Pb p 0-5% central MBT > 75 GeV jet T p > 100 GeV jet T p < 9 GeV A T p 2 < UE - UE pairs HS - UE pairs 0 10 20 30 40 50 60 Centrality [%] 0 0.2 0.4 0.6 0.8 1 1.2 Pair fraction ATLAS -1 , 165 nb = 8.16 TeV NN s +Pb p 0-5% central MBT > 75 GeV jet T p > 100 GeV jet T p < 100 GeV A T p 9 < UE - UE pairs HS - UE pairs
Figure 12: Underlying event–underlying event (UE–UE) (open circles) and hard scatter–underlying event (HS–UE) (open squares) particle-pair yield composition fractions for MBT events (black), events with jet pT> 75 GeV (blue),
and events with jet pT> 100 GeV (orange) plotted as a function of event centrality. The results are obtained in
three different selections of the A-particle pT: 0.5 < pT < 2 GeV (top left), 2 < pT < 9 GeV (top right), and
9 < pT< 100 GeV (bottom). Statistical uncertainties are shown as narrow vertical lines on each point, and systematic
8 Conclusion
This paper presents Fourier coefficients of the azimuthal distribution of unidentified charged particles from 165 nb−1of√sNN = 8.16 TeV p+Pb collisions at the LHC and measured with the ATLAS detector. Results
are presented separately for minimum-bias and jet events, with jet pTthresholds of 75 and 100 GeV, as a
function of particle pTand centrality. The results are extracted using two-particle azimuthal correlations
combined with a non-flow template fit procedure. The charged particle pTdependence of v2and v3is found
assuming the factorisation of vn,n. The v2results are presented for charged-particle transverse momentum
pT= 0.5–20 GeV for minimum-bias events and pT= 0.5–50 GeV for jet-triggered events, and the v3results
are for pT= 0.5–20 GeV in both cases.
For charged particles with pT between 0.5 and 2 GeV, the vn results from each event selection are
quantitatively consistent with each other, rising steadily with pT, and the v2 coefficients are roughly
independent of centrality. The v2values at 0–5% centrality agree with those predicted by hydrodynamic
calculations.
Between charged particle pT of 2 and 9 GeV, the vn values drop in each case, but are ordered with
minimum-bias events yielding the highest vnvalues and the jet events with jet pT> 100 GeV the lowest.
Charged particles in this pTrange exhibit a significant centrality-dependent v2, monotonically decreasing
from central to peripheral events. This behaviour can be qualitatively explained within a simplified two-component model of particle production, in which the magnitude of the correlation in this region is determined by the admixture of charged particles originating from soft and hard processes in the given event selection. The measured particle pair yields support this qualitative argument.
For charged particles with pTabove 9 GeV, the vnresults are again consistent between MBT and jet events.
Although the uncertainties in the v3values make any quantitative statement difficult, v2plateaus at a value
of 0.025 up to a pTof 50 GeV. This result cannot be explained in the theoretical context of jet quenching
or eremitic expansion calculations while simultaneously describing the observed lack of suppression of high-pThadron and jet yields in p+Pb collisions.
Acknowledgements
We thank CERN for the very successful operation of the LHC, as well as the support staff from our institutions without whom ATLAS could not be operated efficiently.
We acknowledge the support of ANPCyT, Argentina; YerPhI, Armenia; ARC, Australia; BMWFW and FWF, Austria; ANAS, Azerbaijan; SSTC, Belarus; CNPq and FAPESP, Brazil; NSERC, NRC and CFI, Canada; CERN; CONICYT, Chile; CAS, MOST and NSFC, China; COLCIENCIAS, Colombia; MSMT CR, MPO CR and VSC CR, Czech Republic; DNRF and DNSRC, Denmark; IN2P3-CNRS and CEA-DRF/IRFU, France; SRNSFG, Georgia; BMBF, HGF and MPG, Germany; GSRT, Greece; RGC and Hong Kong SAR, China; ISF and Benoziyo Center, Israel; INFN, Italy; MEXT and JSPS, Japan; CNRST, Morocco; NWO, Netherlands; RCN, Norway; MNiSW and NCN, Poland; FCT, Portugal; MNE/IFA, Romania; MES of Russia and NRC KI, Russia Federation; JINR; MESTD, Serbia; MSSR, Slovakia; ARRS and MIZŠ, Slovenia; DST/NRF, South Africa; MINECO, Spain; SRC and Wallenberg Foundation, Sweden; SERI, SNSF and Cantons of Bern and Geneva, Switzerland; MOST, Taiwan; TAEK, Turkey; STFC, United Kingdom; DOE and NSF, United States of America. In addition, individual groups and members have received support from BCKDF, CANARIE, Compute Canada and CRC, Canada; ERC, ERDF, Horizon
2020, Marie Skłodowska-Curie Actions and COST, European Union; Investissements d’Avenir Labex, Investissements d’Avenir Idex and ANR, France; DFG and AvH Foundation, Germany; Herakleitos, Thales and Aristeia programmes co-financed by EU-ESF and the Greek NSRF, Greece; BSF-NSF and GIF, Israel; CERCA Programme Generalitat de Catalunya and PROMETEO Programme Generalitat Valenciana, Spain; Göran Gustafssons Stiftelse, Sweden; The Royal Society and Leverhulme Trust, United Kingdom. The crucial computing support from all WLCG partners is acknowledged gratefully, in particular from CERN, the ATLAS Tier-1 facilities at TRIUMF (Canada), NDGF (Denmark, Norway, Sweden), CC-IN2P3 (France), KIT/GridKA (Germany), INFN-CNAF (Italy), NL-T1 (Netherlands), PIC (Spain), ASGC (Taiwan), RAL (UK) and BNL (USA), the Tier-2 facilities worldwide and large non-WLCG resource providers. Major contributors of computing resources are listed in Ref. [64].
References
[1] U. Heinz and R. Snellings, Collective Flow and Viscosity in Relativistic Heavy-Ion Collisions,Ann.
Rev. Nucl. Part. Sci. 63 (2013) 123.
[2] B. Muller, J. Schukraft and B. Wyslouch, First Results from Pb+Pb collisions at the LHC,Ann. Rev.
Nucl. Part. Sci. 62 (2012) 361, arXiv:1202.3233 [hep-ex].
[3] M. Connors, C. Nattrass, R. Reed and S. Salur, Jet measurements in heavy ion physics,Rev. Mod.
Phys. 90 (2018) 025005, arXiv:1705.01974 [nucl-ex].
[4] G.-Y. Qin and X.-N. Wang, Jet quenching in high-energy heavy-ion collisions,Int. J. Mod. Phys. E
24 (2015) 1530014, arXiv:1511.00790 [hep-ph].
[5] Y. Mehtar-Tani, J. G. Milhano and K. Tywoniuk, Jet physics in heavy-ion collisions,Int. J. Mod.
Phys. A 28 (2013) 1340013, arXiv:1302.2579 [hep-ph].
[6] J.-P. Blaizot and Y. Mehtar-Tani, Jet structure in heavy ion collisions,Int. J. Mod. Phys. E 24
(2015) 1530012, arXiv:1503.05958 [hep-ph].
[7] CMS Collaboration, Azimuthal anisotropy of charged particles with transverse momentum up to 100 GeV/c in PbPb collisions at
√
sNN = 5.02 TeV,Phys. Lett. B 776 (2018) 195, arXiv:1702.00630
[hep-ex].
[8] ATLAS Collaboration, Measurement of the Azimuthal Angle Dependence of Inclusive Jet Yields in
Pb+Pb Collisions at√sNN= 2.76 TeV with the ATLAS detector,Phys. Rev. Lett. 111 (2013) 152301, arXiv:1306.6469 [hep-ex].
[9] ALICE Collaboration, Energy dependence and fluctuations of anisotropic flow in Pb-Pb collisions
at√sNN = 5.02 and 2.76 TeV,JHEP 07 (2018) 103, arXiv:1804.02944 [nucl-ex].
[10] M. Gyulassy, I. Vitev and X.-N. Wang, High pTAzimuthal Asymmetry in Noncentral A+ A at RHIC,
Phys. Rev. Lett. 86 (12 2001) 2537.
[11] E. V. Shuryak, Azimuthal asymmetry at large pt seem to be too large for a pure “jet quenching”,
Phys. Rev. C 66 (2002) 027902, arXiv:nucl-th/0112042 [nucl-th].
[12] D. Molnar and D. Sun, High-pT suppression and elliptic flow from radiative energy loss with realistic
bulk medium expansion, (2013), arXiv:1305.1046 [nucl-th].
[13] J. Noronha-Hostler, B. Betz, J. Noronha and M. Gyulassy, Event-by-Event Hydrodynamics + Jet
![Figure 9 shows the published Pb+Pb results for v 2 as a function of p T in the 20–30% centrality selection [62]](https://thumb-eu.123doks.com/thumbv2/123doknet/14050512.460114/16.892.158.760.257.840/figure-shows-published-pb-results-function-centrality-selection.webp)