HAL Id: ird-00540602
https://hal.ird.fr/ird-00540602
Submitted on 29 Nov 2010
HAL is a multi-disciplinary open access archive for the deposit and dissemination of sci-entific research documents, whether they are pub-lished or not. The documents may come from teaching and research institutions in France or abroad, or from public or private research centers.
L’archive ouverte pluridisciplinaire HAL, est destinée au dépôt et à la diffusion de documents scientifiques de niveau recherche, publiés ou non, émanant des établissements d’enseignement et de recherche français ou étrangers, des laboratoires publics ou privés.
Common trends model in catch per unit of effort for the
tropical tunas.
Daniel Gaertner
To cite this version:
Daniel Gaertner. Common trends model in catch per unit of effort for the tropical tunas.. Collective Volume of Scientific Papers, ICCAT, 2010, 65 (2), pp.417-429. �ird-00540602�
SCRS/2009/030 Collect. Vol. Sci. Pap. ICCAT, 65(2): 417-429 (2010)
COMMON TRENDS MODEL IN CATCH PER UNIT OF EFFORT
FOR THE TROPICAL TUNAS
Daniel Gaertner1
SUMMARY
We explored the usefulness of Dynamic factor analysis (DFA) to detect common patterns in the sets of CPUEs for Atlantic yellowfin (Thunnus albacares) and for eastern Atlantic skipjack (Katsuwonus pelamis), respectively. For yellowfin, the most appropriate model, in terms of AIC, identified two common trends. The 10 yellowfin CPUE series could be divided into 3 groups based on factor loadings. The grouping corresponds in part to the geographic location of the fisheries (i.e., the western Atlantic area for group 1 and the northeastern tropical Atlantic region for group 2). The fact that the first group is constituted by CPUEs obtained from 3 different fishing gears (pole and line, purse seine and longline), operating at different depth levels, suggests that the regional trend reflects more a sub-population response to a local exploitation rate than to environmental conditions. In light of the present results, the CPUEs should be combined respectively into two regional indices before performing a unique combined index. For skipjack, results are less conclusive and further studies with explanatory factors are required to account for the fact that this species is seldom targeted by the tuna fisheries.
RESUME
Nous analysons la pertinence de l’Analyse factorielle dynamique (DFA) pour détecter des tendances communes dans les jeux de CPUE respectifs pour l’albacore de l’Atlantique
(Thunnus albacores) et pour le listao de l’Atlantique Est (Katsuwonus pelamis). Pour l’albacore, le meilleur modèle, au sens du critère d’AIC, identifie deux tendances communes. Les 10 séries de CPUE de l’albacore se distribuent en trois groupes distincts sur la base du poids des facteurs des tendances. Cette classification repose en partie sur la localisation géographique des pêcheries (ex. l’Atlantique Ouest pour le groupe 1, l’Atlantique tropical Nord-Est pour le groupe 2). Le fait que le premier groupe soit constitué de CPUE provenant d’engins différents (canne, seine et palangre) opérant à différentes profondeurs, suggère que la tendance commune régionale reflète plus la réponse d’une sous-population face à l’exploitation locale qu’une réponse à l’environnement. A la lumière de ces résultats, les CPUE devraient être combinées respectivement dans deux indices régionaux avant le calcul d’un indice d’abondance global. Les résultats du listao sont moins concluants et des analyses supplémentaires, incluant notamment des variables explicatives, devront être faites pour prendre en compte le fait que cette espèce est rarement ciblée par les pêcheries thonières.
RESUMEN
Se analiza la utilidad del análisis factorial dinámico (DFA) para detectar tendencias comunes en los conjuntos de CPUE respectivos para el rabil del Atlántico (Thunnus albacares) y el listado del Atlántico este (Katsuwonus pelamis). Para el rabil, el mejor modelo según el criterio AIC identifica dos tendencias comunes. Las 10 series de CPUE del rabil se distribuyen en 3 grupos distintos en base al peso de los factores de las tendencias. Esta clasificación se basa, en parte, en la localización geográfica de las pesquerías (por ejemplo, el Atlántico oeste para el grupo 1, el Atlántico tropical noreste para el grupo 2). El hecho de que el primer grupo esté constituido por CPUE procedente de diferentes artes (caña y liña, cerco y palangre) que operan en diferentes profundidades, sugiere que la tendencia común regional refleja más la respuesta de una subpoblación frente a la explotación local que una respuesta frente al medio ambiente. A la luz de estos resultados, las CPUE deberían combinarse respectivamente en dos índices regionales antes de calcular un índice de abundancia global. Los resultados para el
listado son mejor concluyentes y deberían hacerse análisis complementarios, que incluyan principalmente variables explicativas, para tener en cuenta el hecho de que esta especie es rara vez el objetivo de las pesquerías atuneras.
KEYWORDS
Catch/effort, abundance, multivariate analysis, yellowfin, skipjack
1. Introduction
During the last tropical tuna stock assessment conducted by the International Commission for the Conservation of Atlantic Tuna (ICCAT) about ten catch per unit of effort (CPUEs) of Atlantic yellowfin (Thunnus albacares) and six CPUEs of eastern Atlantic skipjack (Katsuwonus pelamis), were combined into one common index assumed to be representative of the relative abundance of each species and used to fit surplus production models (Anon. 2009).
Building abundance indices from commercial CPUEs remain problematic for many reasons. Stock assessment assumes that there is a direct proportionality between CPUEs and abundance but forms of non-proportionality, such as hyperdepletion and hyperstability, have been observed in many fishery studies (Hilbom and Walters 1992). Another difficulty concerns the calculation of an overall trend index for change in a spatially structured stock. It makes sense to suppose that over the historic development of a fishery, spatial changes have occurred for different reasons: target switching due to market change, acquisition of new fishing rights with coastal states, reallocation of effort due to localized depletion, etc. But in such a situation what assumptions to use when analyzing long-term data for which changes in the spatial distribution of the fishing effort have been observed (Walters, 2003)? As a rule of thumb, the larger the time series analyzed, the larger is the part of expert knowledge that must be taken into account before performing any statistical analysis. To conclude this brief introduction on the accuracy of CPUEs analyses for gauging the trajectory of the exploited population, the question of the change in catchability over the years, specifically due to an increase in fishing power, is a key issue in stock assessment (Fonteneau et al. 1999).
One of the general rules in statistical inference is that more data leads to less uncertainty. But, as raised by Magnusson and Hilborn (2007) other features of the data also play a role. Consequently, there is no evidence that combining a large number of catch rates to fit population models improves our understanding of the situation since: (1) multiple indices from the same gear, few of which correlated with each other, may reflect only trends in relative biomass for a regional fraction of the stock or for a limited number of age classes, and (2) adding more CPUEs may lead to an unnecessary addition of noise since contradicting information may be embedded in the trajectory of each individual CPUE (Schnute and Hilborn, 1993; Andrade, 2009a).
In this working paper, we will focus only on the exploration of the similarity of multiple CPUEs over time and how to summarize them into a reduced number of common trends. Dynamic factor analysis (DFA) is a technique especially designed for time series data, which enables underlying common patterns to be identified. This methodology allows to model short and nonstationary series in terms of common patterns and explanatory variables. For example, DFA can indicate whether there are any underlying common patterns in the N CPUE series, whether there are interactions between the response variables, and what the effects of explanatory variables are (Zuur et al. 2003).
2. Material and methods 2.1 Data
As mentioned in the Introduction section, depending on the model used, about 10 CPUEs of Atlantic yellowfin and 6 CPUEs of eastern Atlantic skipjack have been used for the stock assessments. Some series were updated during the ICCAT tropical tuna stock assessment (Anon. 2009) but some data were lacking for 1969 and for 2007. Consequently, we restricted the analysis to the period 1970-2006.
For Atlantic yellowfin, the indices were provided by national scientists for:
− JAPLL, the Japanese longline (standardized indices, Okamoto and Satoh, 2009): 1970-2006, − USARR, the U.S. rod and reel (standardized, Cass-Calay, 2009): 1986-2006,
− USALL, the combined Mexico and U.S. longline in the Gulf of Mexico (standardized, Brown and Ramirez-Lopez, 2009): 1987-2006,
− BRZLL, the Brazilian longline (standardized, Travassos et al. 2009): 1986-2006, − URULL, the Uruguayan longline (standardized, Pons and Domingo, 2009):1981-2006,
− VENPS, the Venezuelan purse seine (non-standardized but assuming a constant annual increase in catchability of 1%), 1983-2005,
− BRZBB, the Brazilian baitboats (non-standardized; notice that a standardized CPUE series has recently been submitted to ICCAT by Andrade, 2009a): 1981-2005 (2000 lacking),
− CANBB, the Spanish-Canary Islands baitboats (a non standardized series): 1980-2006,
− ECDKBB, the baitboat fleets (EC-France, EC-Spain, FIS, Senegal) operating from Dakar (Senegal), (non-standardized): 1984-2006,
− ECFADPS, the EC purse seine fishing on FADs mainly in equatorial areas (standardized CPUEs from Soto et al. (2009), then assuming a constant annual increase in catchability of 3%):1991-2005.
For the eastern Atlantic skipjack:
− PORBB, the Portuguese-Azorean fleet (standardized index after omitting the smallest boats fishing in coastal waters of Azores, Cass-Calay and Pereira, 2009): 1970-2006,
− CANBB, the Spanish-Canary Islands baitboats (a non standardized series, tentatively broken down in two periods of time, prior to and following the adoption of the associated school fishing technique in 1992, but due the large variability between successive years we used it as a single time series): 1980-2006,
− ECDK1BB and ECDK2BB, the baitboat fleets (EC-France, EC-Spain, FIS, Senegal) operating from Dakar (Senegal), (standardized by the author for the whole time series, then broken down prior to and following the adoption of the associated school fishing technique in 1984, as suggested by Figure 4 in Fonteneau and Diouf, 1994): 1970-1983 and 1984-2006,
− GHNBB, the Ghanaian vessels (non-standardized CPUE; Wise, 1986): 1969-1982,
− ECDKPS, the EC-purse seiners and associated purse seiners, targeting free schools of skipjack off Senegal during the second quarter of the year (standardized, and then assuming a constant annual increase in catchability of 3%): 1980-2006,
− ECFADPS, the EC purse seiners fishing on FADs mainly in equatorial areas (standardized from Soto et
al. (2009), and then assuming a constant annual increase in catchability of 3%): 1991-2006. 2.2 Methods
The basic idea of dynamic factor analysis is to estimate the underlying common trends among a group of time series. The CPUEs may be modeled in terms of (i) a linear combination of common trends, (ii) explanatory variables, (iii) a level parameter, and (iv) a noise component. For this explanatory analysis we considered a model with M common trends and noise only. The model formulation is as follows:
Yit = Zi1 α1t + Zi2 α2t +, …, + ZiM αMt + eit
where Yit is the value of the ith time series at time t, αjt is the jth common trend, Zij is the factor loading, and eit is
an error term.
From the values of factor loadings and canonical correlations, it can be inferred which common trends are important to a particular CPUE and which group of CPUEs are related to the same common trend. Notice that in contrast to the conventional factorial analysis (FA), the new axes created in DFA (i.e., the common trends) are smooth functions over time, with smoothing estimated automatically as part of a two-step Expectation-Maximisation algorithm. The trends represent the underlying common patterns over time, in such a way that the trends at time t are expressed as a function of the trends at time t-1, plus an assumed normally distributed error
term with mean zero and diagonal matrix R. It should be stressed that using a diagonal matrix for R leads in general to common trends related only to two or three response variables. To overcome this aspect, an alternative symmetric positive-definite covariance matrix can be used (Zuur et al. 2003). In such case, off-diagonal elements of R represent information in two response variables that cannot be explained by the common trends. As for model selection procedure in GLM analysis, different competing models were ranked according to the Akaike information criterion (AIC). The top-ranking model (i.e., smallest AIC) from each set of CPUEs by species was reported as the most parsimonious model, which is the model that best explains the variation in the data while using the fewest parameters (Burnham and Anderson, 2002). AIC is a trade-off between the measure of fit and the number of parameters.
Estimated models presented in this paper were obtained with the software package Brodgar2. Different applications of DFA in fishery studies can be found in Zuur et al. (2003), Erzini et al. (2005) and Azevedo et al. (2008).
3. Results
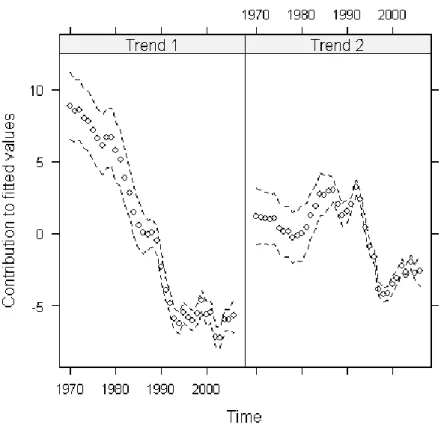
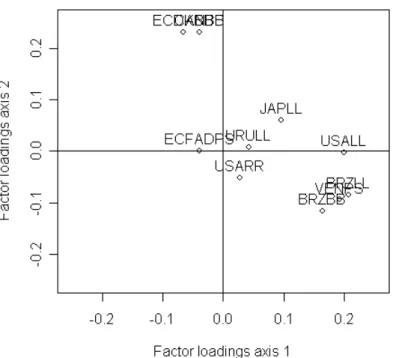
To determine how many common trends to use for each species, the AIC was calculated for candidate models containing 1, 2, 3 and 4 common trends (Table 1). For Atlantic yellowfin, the model containing two common trends and based on a symmetric non-diagonal matrix R is the most appropriate (i.e., smallest AIC value). The underlying common trends estimated by the parsimonious DFA model are presented in Figure 1 and the corresponding factor loadings are given in Figure 2. From this figure it can be seen that the factor loadings discriminate three groups of CPUEs:
− The Brazilian longline, Brazilian baitboat, Venezuelan purse seine and likely US longline, − The baitboat fisheries: Dakar-based and Canary Islands pole and line,
− A group located close to the center of the figure which is composed by the Uruguayan longline, the U.S. rod and reel and the EC purse seiners fishing on FADs. Surprisingly, the Japanese longline index is located between the first and the second group.
This grouping corresponds in part with the location of the fisheries (i.e., the large western Atlantic areas for group 1 and the northeastern tropical region for group 2). The first group, which is constituted by fisheries using 3 different gears, contributes mainly to the first trend (left part of Figure 1) as depicted by the representation of the fitted CPUEs (Figure 3). The first common trend is important for longlines from Brazil and the United States (factor loadings of 0.21 and 0.20, respectively) and in decreasing magnitude for Venezuelan purse seiners and Brazilian baitboats (factor loadings of 0.19 and 0.17, respectively). The second group is characterized by the dome-shaped curve observed in the eastern baitboat CPUEs and is clearly related to the second trend (right part of Figure 1), with a similar factor loading of 0.23 for both fleets (Figure 2). Whatever the link of proportionality between catch rates and the relative abundance of yellowfin in this geographic region, one can admit that these two time series behave similarly over time. A residual plot for the best DFA model fit is given in Figure 4. Relative large residuals, and may be some outliers, can be observed for the Canary Islands baitboats and the Brazilian baitboats.
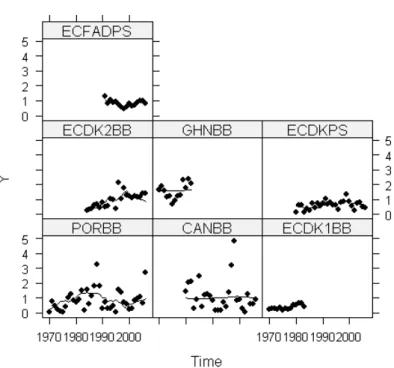
For eastern Atlantic skipjack, the best DFA fits was obtained for two common trends and a symmetric, non-diagonal matrix (AIC = 187.51; Table 1). However this model with the smallest AIC gives an exact fit for one of the response variables (the first time series of the Dakar-based baitboats) which means that the CPUEs are too noisy, and therefore DFA, which is basically a smoothing technique, might be inappropriate (Zuur et al. 2003). As a consequence, we solve this problem by using a non-diagonal matrix for R, and we decided to select the DFA model with only one common trend (AIC = 202.26; Figure 5). The plots of the observed and fitted CPUEs by fisheries indicated, except the Canary Islands and Ghanaian baitboats, good model fit (Figure 6). It must be kept in mind that DFA Dynamic factor analysis is a dimension reduction technique, so it is unlikely that every CPUE is fitted well if a small number of common trends is used.
The factor loadings for the eastern Atlantic skipjack are positive for the Azorean baitboats (0.14) and for the EC purse seine fishery on FADs (0.11) but are negative (-0.15) for the baitboats operating off Senegal since the adoption of the new fishing tactic (Figure 7). This might suggest that these CPUEs are driven by the same process, but behave in an opposite way. In contrast to the situation described previously for the yellowfin, there
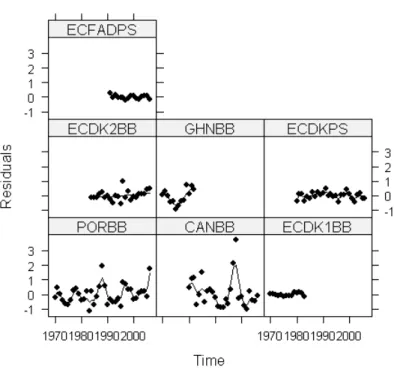
is not a clear discrimination between CPUEs, based on their geographical location. As expected, the plot of the residual values highlights some variability for the Azorean and Canary Islands baitboats (Figure 8). These two peripheral fisheries are affected by year-to-year variation in environmental factors which influence the local catchability of skipjack.
4. Discussion
Our findings suggest some similarities in yellowfin CPUEs between some geographically adjacent fisheries. The existence of regional common trends could be related to environmental factors acting over spatial scales but also to sub-population responses to local exploitation rates (suggesting a relative viscosity of the yellowfin stock). The fact that the three fishing gears concerned (pole and line, purse seine and longline) operate at different depth levels, and consequently are upon the influence of different environmental conditions, might give more support to the second assumption. It must be stressed however than the results could have been different if we have compared different species caught by different gears. Rouyer at al. (2008) stated that at a regional scale, the CPUE of different species of tunas caught with the same gear displayed more common fluctuations than the CPUE of a given species fished with different gears.
In light of the present results, (1) the four indices depicting the first group, in one hand, and (2) the two eastern baitboat catch rates, on the other hand, should be combined respectively in two regional indices before performing a unique combined index. The two extracted common trends indicate a decrease in catch rates from 1970 to the early 1990s and from the late 1980s to the late 1990s for the first and second group, respectively. With respect to the second group, composed by baitboat fleets, since they have adopted a new fishing strategy, which consists in using the boat itself as a FAD, in the early 1980s in Dakar and the early 1990s in the Canary islands (Fonteneau and Diouf, 1994; Hallier and Delgado de Molina, 2000), caution must be taken in the interpretation of these patterns in terms of fluctuation of abundance. It must be stressed, however, that the stabilization and the slow recovery depicted by the two common trends since the early 2000s is in agreement with the knowledge on the situation for this stock (Anon. 2009). For future study, it seems important to redo the DFA analysis after incorporating an apparent abundance index from large yellowfin caught in free school by the EC and associated purse seiners in the eastern Atlantic.
In the case of the eastern Atlantic skipjack, due to the absence of contrasting series, the results are less clear. One of the major challenges with CPUEs of skipjack is due to the fact that this species is seldom targeted (with exception of some baitboat fisheries, as in Brazil in the western Atlantic, or in the Maldives in the Indian Ocean). Consequently, without additional information (e.g., price differential between yellowfin and skipjack) it is not possible to improve our understanding of the response of skipjack population to exploitation solely from observed trends in catch rates.
Among the potential biases associated with the use of commercial data, the needs to account for the increase in fishing power over the years has been widely highlighted (Fonteneau et al., 1999). Notice that in some circumstances, analyzing indices from fishing gears for which the species under study is caught as a by-catch should be considered, since one can reasonably assume that changes in technology affect less indices of by-catch than on the targeted species. For instance, yellowfin can be considered as a secondary species for the Brazilian baitboats which target skipjack.
CPUE is related to relative abundance, that is to say to the proportion of fish, at one particular time and place, vulnerable to the fishing gear (i.e., a sort of “fish at-risk”), and not to the absolute number of fish in the population. It is widely admitted by fishery scientists that CPUE is seldom proportional to abundance over a whole exploitation history and an entire geographic range. Even if CPUE is standardized appropriately, the resulting index of relative abundance, in isolation, provides limited information for management advice or about the effect of fishing (Maunder et al. 2006). In the same lines, the calculation of a weighted combined index does not ensure an automatic success of the procedure. Often different data sets contain contradictory information, so changing the weighting factors can lead to different results (Maunder, 2003). For instance, at first sight it makes sense to give more importance to indices obtained from fisheries covering the major part of the spatial distribution of the species considered than to indices depicting only local fisheries. However, area-weighted CPUEs may overweight fisheries which target only few age classes (e.g., for longline which targets only large yellowfin and capture skipjack incidentally), and conversely may downweight catch rates from small fishing grounds even if these local fisheries are effective in terms of catch or exploit the whole age components of the stock. After performing a sensitivity analysis on the different weights attributed to each CPUE, the calculation of
a combined weight, integrating multiple criteria (fishing area, catch, number of age classes, etc) should be explored.
As mentioned in the introduction section hyperstability and hyperdepletion were evidenced in numerous commercial fisheries. In general, the operational characteristics of fishing will tend to cause hyperstability, whereas the distributional characteristics will tend to cause hyperdepletion. Hyperdepletion is characteristic of longlines, which deplete the “yellowfins-at-risk” during the initial phase of the exploitation. This phenomenon is seen when the abundance index declines substantially faster than the true population abundance (Harley et al. 2001). It was showed that analyzing longline CPUEs without keeping in mind such an effect may provide a misleading picture of the status of large predatory pelagic fishes (Polacheck, 2006). Hyperstability is commonly observed in small pelagic fisheries and/or schooling fish. This is defined as the index of abundance remaining high when the true population abundance decreases (e.g., some purse seine indices). Among the components that contribute to hyperstability, Hilborn and Walters (1992) mentioned non-random search, but it was showed by simulation study that information sharing between vessels reinforces this situation (Gaertner and Dreyfus, 2004). To prevent the effects of hyperstability and hyperdepletion in indices, Walters (2003) suggests the use of gap-filling spatial catch rate approaches. However, in the case of longline fisheries there is evidence of severe hyper-depletion even in the spatially corrected CPUE time series (Ahrens and Walters, 2005). In some circumstances, integrated assessment models, which use many types of information, may be used to show that CPUEs are not consistent with population dynamic for the early years (Maunder et al. 2006).
5. Conclusion
The use of DFA models for reducing multiple CPUEs to a lower number of common trends appears as a promising tool but further studies are required. One of the limitations of this method is the instability of the results when applying DFA models with an R symmetric non-diagonal matrix to CPUEs including a large proportion of missing values. In such a situation the adoption of the R diagonal covariance matrix is relevant (Azevedo at al. 2008). In some circumstances, as seen for the Atlantic eastern skipjack, a common trend may produce an exact fit for one of the response variables. This behavior may also occur in conventional factor analysis and is called a Heywood case. This means that the amount of smoothing is too small, which is an indication that the underlying model is inappropriate. The authors of Brodgar point out that switching to a symmetric, non-diagonal matrix for R solves this problem but it is unclear how to combine this choice with information theoretic criterion approaches in model selection.
With respect to the two species of tropical tunas considered in this paper, it was showed that further studies with explanatory factors, such as price differential between large yellowfin and small size commercial category of tunas, are required to account for the fact that skipjack is seldom targeted by surface tuna fisheries. In the case of yellowfin, statistical analysis such as DFA might give insight on a reduced number of regional common trends which could be used later to perform a combined index of abundance. It is unclear however how to integrate CPUEs which depict non-proportionality phenomena to evaluate the status of a fishery and how to calculate weighting factors which lead to an accurate estimate of the relative importance of each CPUE.
References
Ahrens, R.., Walters C. 2005, Why are there still large pelagic predators in the oceans? Evidence of severe hyper-depletion in longline catch-per-effort. WCPFC-SC1 ME-WP-3, 1-13.
Andrade, H.A. 2009a, Using delta-gamma generalized linear models to standardize catch rates of yellowfin tuna caught by Brazilian bait-boats. Collect. Vol. Sci. Pap. ICCAT, 64(4): 1171-1181.
Andrade, H.A. 2009b, Contradictory catch rates of blue shark caught in the Atlantic Ocean by the Brazilian longline fleet as estimated using Generalized Linear Models. Collect. Vol. Sci. Pap. ICCAT, 64(5): 1537-1545.
Anon. 2009, Report of the 2008 ICCAT Yellowfin and Skipjack Stock Assessments Meeting (Florianopolis, Brazil, July 21 to 29, 2008). Collect. Vol. Sci. Pap., 64(3): 669-927.
Azevedo, M., Duarte, R., Cardador, F., Sousa, P., Fariña C., Sampedro, P., Landa, J., Costas, G. 2008, Application of dynamic factor analysis in the assessment of Iberian anglerfish stocks. ICES Journal of Marine Science 65: 1362-1369.
Brown, C.A. and Ramirez-Lopez, K. 2009, Standardized catch rates for yellowfin tuna (Thunnus albacares) in the Gulf of Mexico longline fishery for 1992-2007 based upon observer programs from Mexico and the United States. Collect. Vol. Sci. Pap. ICCAT, 64(4): 1068-1079.
Burnham, K.P., Anderson, D.R. 2002, Model selection and inference: a practical information-theoretic approach, 2nd edition. Springer-Verlag, New York.
Cass-Calay, S. 2009, Catch rate indices of yellowfin (Thunnus albacares) and skipjack (Katsuwonus pelamis) tunas from the United States recreational fishery in the western North Atlantic Ocean, 1986-2007. Collect. Vol. Sci. Pap. ICCAT, 64(4): 1115-1132.
Cass-Calay, S., Pereira, J. 2009, A catch rate index for skipjack tuna (Katsuwonus pelamis) from landings of the Azorean baitboat fleet.. Collect. Vol. Sci. Pap. ICCAT, 64(4): 1182-1190.
Erzini, K., Inejih, C.A.O., Stobberup, K. A. 2005, An application of two techniques for the analysis of short, multivariate non-stationary time-series of Mauritanian trawl survey data. ICES Journal of Marine Science, 62: 353-359.
Fonteneau, A., Diouf, T. 1994, An efficient way of bait-fishing for tunas recently developed in Senegal. Aquat. Living Res. 7: 139-151.
Fonteneau, A., Gaertner, D., Nordstrom, V. 1999, An overview of problems in the catch per unit of effort and abundance relationship for the tropical purse seine fisheries. Col. Vol. Sci. Pap. ICCAT, 49(3): 258–278. Gaertner, D., Dreyfus-Leon, M. 2004, Analysis of nonlinear relationships between catch per unit of effort and
abundance in a tuna purse seine fishery simulated with artificial neural networks. ICES Journal of Marine Science, 61: 812-820.
Hallier, J.P., Delgado de Molina, A. 2000, Baitboat as a tuna aggregating device. Le canneur: un dispositif de concentration des thons. In: Le Gall, J.Y., Cayré, P., Taquet, M. (eds) Pêche thonière et dispositifs de concentration de poissons. Actes Colloques-IFREMER 28:553-578.
Harley, S.J., Myers, R.A. and Dunn, A. 2001, Is catch-per-unit-effort proportional to abundance? Can. J. Fish. Aquat. Sci. 58:1760-1772.
Hilborn, R., Walters, C.J. 1992, Quantitative Fisheries Stock Assessment. Choice, Dynamics and Uncertainty. Chapman & Hall, New York. 570 pp.
Magnusson, A., Hilborn, R. 2007, What makes fisheries data informative ? Fish and Fisheries 8: 337-358. Maunder, M.N. 2003, Paradigm shifts in fisheries stock assessment: from integrated analysis to Bayesian
analysis and back again natural resource modeling. Natural Resources Modeling 16(4): 465-475.
Maunder, M.N., Sibert, J.R., Fonteneau, A., Hampton, J., Kleiber, P., Harley, S. 2006, Interpreting catch-per-unit-of-effort data to assess the status of individual stocks and communities. ICES Journal of Marine Science, 63: 1373-1385.
Okamoto, H., Satoh, K. 2009, Japanese longline CPUE for yellowfin tuna (Thunnus albacores) in the Atlantic ocean standardized using GLM up to 2006. Collect. Vol. Sci. Pap. ICCAT, 64(3): 960-976.
Polacheck, T. 2006, Tuna longline catch rates in the Indian Ocean: did industrial fishing result in a 90% rapid decline in the abundance of large predatory species? Marine Policy, 30: 470-482.
Pons, M., Domingo A. 2009, Standardized CPUE of yellowfin tuna (Thunnus albacares) caught by the Uruguayan pelagic longline fleet (1981-2007). Collect. Vol. Sci. Pap. ICCAT, 64(3): 988-998.
Rouyer, T., Fromentin, J.-M., Ménard F., Cazelles, B., Briand K., Pianet, R., Planque, B., Stenseth, N.C. 2008, Complex interplays among population dynamics, environmental forcing, and exploitation in fisheries. PNAS, 105 (14): 5420-5425.
Schnute, J.T., Hilborn, R. 1993, Analysis of contradictory data sources in fish stock assessment. Can. J. Fish. Aquat. Sci. 50: 1916-1923.
Soto, M., Pallarés, P., Delgado de Molina, A., Gaertner, D. 2009, Standardized CPUE for juvenile yellowfin, skipjack and bigeye tuna from the European purse seine fleet in the Atlantic Ocean from 1991 to 2006. Collect. Vol. Sci. Pap. ICCAT, 64(4): 1044-1053.
Travassos, P., Hazin, H., Hazin, F., Mourato, B., Carvalho, F. 2009, Standardization of yellowfin tuna, Thunnus
albacores, catch rate series caught by Brazilian longliners in the southwestern Atlantic Ocean. Collect.
Vol. Sci. Pap. ICCAT, 64(3): 1011-1021.
Walters, C. 2003, Folly and fantasy in the analysis of spatial catch rate data. Can. J. Fish. Aquat. Sci. 60: 1433-1436.
Wise, J.P. 1986, The baitboat fishery for skipjack in the Gulf of Guinea, 1969-82. Proc. ICCAT Intl. Skipjack Yr. Progr. 1: 111-117.
Zuur, A.F., Tuck, I.D. and Bailey, N. 2003, Dynamic factor analysis to estimate common trends in fisheries time series. Can. J. Fish. Aquat. Sci. 60: 542-552.
Table 1. Values of Akaike’s information criterion (AIC) for DFA models with a variable number of common trends (M) for the CPUEs of Atlantic yellowfin (YFT) and of eastern Atlantic skipjack (SKJ).
____________________________________________________________________
Species Covariance M common trends
matrix 1 2 3 4 ____________________________________________________________________ YFT Diagonal 420.10 408.58 408.18 417.12 Symmetric, non-diagonal 415.71 401.10 424.95 433.51 SKJ Diagonal 191.09 187.51 197.78 206.87 Symmetric, non-diagonal 202.26 213.92 213.66 211.53 ____________________________________________________________________
Figure 1. First and second common trends detected by the best DFA model and 95% confidence interval for the
Figure 2. Factor loadings corresponding to the first two common trends detected by the best DFA model for the
CPUEs of the Atlantic yellowfin.
Figure 3. Fitted values obtained by the DFA model containing two common trends and a symmetric non-diagonal matrix R for the Atlantic yellowfin. The lines represent the fitted CPUEs obtained by the Kalman smoothing algorithm and the solid circles represent the observed CPUEs. The heading in each graph refers to the fishery. Fitted values are unitless.
Figure 4. Residual plots for the DFA model fit containing two common trends and a symmetric non-diagonal
matrix R for the Atlantic yellowfin. Smoothed residuals are represented by the lines. The heading in each graph refers to the fishery.
Figure 5. First common trend detected by the best DFA model and 95% confidence interval for the CPUEs of
Figure 6. Fitted values obtained by the DFA model containing one common trend and a diagonal matrix R for the eastern Atlantic skipjack. The lines represent the fitted CPUEs obtained by the Kalman smoothing algorithm
and the solid circles represent the observed CPUEs. The heading in each graph refers to the fishery. Fitted values are unitless.
Figure 7. Factor loadings corresponding to the first common trend detected by the selected DFA model for the
CPUEs of the eastern Atlantic skipjack. PO RB B CA NB B ECD K 1 B B ECDK 2 B B G HNB B ECDK PS EC FA DPS F a c tor loadi ngs ax is 1 -0 . 1 0 0 . 1
Figure 8. Residual plots for the DFA model fit containing one common trend and a diagonal matrix R for the
eastern Atlantic skipjack. Smoothed residuals are represented by the lines. The heading in each graph refers to the fishery.