HAL Id: hal-03253166
https://hal.laas.fr/hal-03253166
Submitted on 8 Jun 2021
HAL is a multi-disciplinary open access
archive for the deposit and dissemination of sci-entific research documents, whether they are pub-lished or not. The documents may come from teaching and research institutions in France or abroad, or from public or private research centers.
L’archive ouverte pluridisciplinaire HAL, est destinée au dépôt et à la diffusion de documents scientifiques de niveau recherche, publiés ou non, émanant des établissements d’enseignement et de recherche français ou étrangers, des laboratoires publics ou privés.
Detection of a Macromolecule Denaturation With
Microwave Dielectric Spectroscopy based on Hydration
Modifications
Katia Grenier, Genevieve Pratviel, Hugo Mazur, David Dubuc
To cite this version:
Katia Grenier, Genevieve Pratviel, Hugo Mazur, David Dubuc. Detection of a Macromolecule Denat-uration With Microwave Dielectric Spectroscopy based on Hydration Modifications. 2020 IEEE MTT-S International Microwave Biomedical Conference (IMBioC), Dec 2020, Toulouse (virtual), France. �10.1109/IMBIoC47321.2020.9385022�. �hal-03253166�
Detection of a macromolecule denaturation with
microwave dielectric spectroscopy based on hydration
modifications
Katia Grenier LAAS-CNRS Université de Toulouse, CNRS Toulouse, France [email protected] Geneviève Pratviel LCC Toulouse, France [email protected] Hugo Mazur LAAS-CNRS Université de Toulouse, CNRS Toulouse, France [email protected] David Dubuc LAAS-CNRS Université de Toulouse, CNRS, UPS Toulouse, France [email protected]Abstract— This paper focuses on demonstrating the possible detection with microwave dielectric spectroscopy of the hydration modification of a protein submitted or not to a chaotropic agent. The case study of the denaturation of the large BSA protein with urea is investigated. A hydration contrast is extracted from microwave measurements and presents a linear relationship with the concentration of the denaturing agent. This result demonstrates that microwave dielectric spectroscopy could contribute to evaluate intramolecular change of conformation (structuration/destructuration) of biomacromolecules based on hydration modifications.
Keywords— microwave, dielectric spectroscopy, molecules, hydration, conformation change, denaturation
I. INTRODUCTION
To understand and finally be able to interact with molecular processes, one needs efficient analysis techniques. This applies to any field of chemical sciences including material sciences, supramolecular chemistry and, in particular, to the chemistry of life. In biology, scientists need to know (i) how different partners recognize each other (ligand/receptor, protein/protein interactions, protein/DNA recognition…), (ii) how biological macromolecules acquire their 3D structures in order to be active (protein folding, DNA structuration/destructuration…), (iii) how a drug selectively binds to its pharmacological target in order to fight a disease.
Although various spectroscopic techniques currently exist to follow molecular structuration and interactions (circular dichroism and UV-visible absorbance or fluorescence spectroscopies for instance), microwave dielectric spectroscopy, which has mainly been applied to molecules-solvents systems so far and poorly demonstrated for further molecular interactions, may potentially offer some new attractive and complementary properties such as rapid spectrum acquisition (milliseconds instead of several minutes for a classic circular dichroism spectrum), insights into the involvement of water molecules in the molecular process of interest. Furthermore, the technique does not require any labeling of the studied compounds.
Fig. 1. Schematic of urea impact on BSA molecule.
Microwave dielectric spectroscopy constitutes an attractive characterization technique due to its non-destructive, rapid and non-contacting properties. This method exploits the interaction of the electromagnetic field with matter and probes the reorientational dynamics of molecules, notably water molecules (relaxation phenomenon centered around 20 GHz for bulk water) and the variations between the bulk and bounded contributions. Investigations such as macroscale moisture content measurements in agronomy [1-2], water detection in soils and more recently non-destructive and label-free cellular analysis [3-5] have been successfully carried out. Previous investigations were also conducted on biomolecules-solvent interactions with dielectric spectroscopy [6-11].
Within this context, we are interested in exploring the ability of microwave dielectric spectroscopy to probe (macro)molecular interactions of biological interest. In a first step, the possible detection of the denaturation of a large protein, the Bovine Serum Albumin, BSA, with a denaturing agent (urea in our case) is evaluated. This molecule constitutes a well-known molecule for chemists and is often chosen as a model due to its possible and simple to control denaturation with different techniques (temperature, chaotropic agent notably).
Here the two states, that are expected to afford different microwave dielectric responses, are the fully folded macromolecule and the unfolded coil, as indicated with the schematic of Fig. 1. The unfolding level is directly linked to the concentration of the denaturing agent.
Destructuration
In a first section, the protein under test and the denaturing agent are presented, followed by a description of the microwave sensor, a brief explanation of its fabrication process and the RF test setup developed to perform the microwave dielectric spectroscopy of low volume liquids. Next section is then dedicated to the microwave measurements of the different protein-based solutions and the data treatment specifically developed to highlight the impact of denaturation of the protein on its hydration.
II. MATERIALS AND METHOD
A. Protein under test and denaturation procedure
As a first model, a large 3D protein, BSA, which is commercially available in a large quantity, is chosen.
To perform the denaturation, urea is selected among the different possible chaotropic agents. In sufficient quantity, the chaotropic agent causes indeed a maximum solubility in the medium and therefore causes denaturation. The polarity of water molecules becomes weak in the presence of urea, for example.
All solutions of BSA and urea are prepared in a 50 mM phosphate buffer with a pH of 7.4. The pH is checked with a pH-meter and two calibration solutions of pH 7 and 10 respectively.
Two BSA solutions of 1 and 2 mg / mL are prepared for our experiments.
The different liquid solutions were divided in several replicates and stored at -2°C to allow multiple independent experiments while using the same original liquids. Before the beginning of the RF experiments, the requested ones were placed at room temperature for 30 minutes, while replicates were kept frozen for the other experiments.
B. Microwave sensor for permittivity measurement of low volume liquids, test setup and RF measurement protocole
The microwave sensor used for low volume liquid analysis is presented in Fig. 2. It consists in a coplanar waveguide with a microfluidic channel placed on top. A volume of 1 µL is required within the channel, including the dead zones to allow the insertion of the liquid and its removal.
Fig. 2. Photography of the microwave sensor.
Fig. 3 gives a cross section of the sensor. This latter is realized on a quartz substrate to minimize dielectric losses. The coplanar waveguide is obtained with a lift-off technique and the evaporation of a titanium/gold layer of 0.3 µm thick. To present a 50 Ω impedance at the input of the sensor, the central conductor and the slots exhibit a width of 150 µm and 15 µm respectively. The fluidic walls are then realized with the patterning of a thick SU-8 polymer layer, which has been totally reticulated with a hardcure to avoid any contamination during RF measurements. Finally, a PDMS lid is stuck to the fluidic walls using an oxygen plasma treatment performed on both elements, the sensor wafer and the lid.
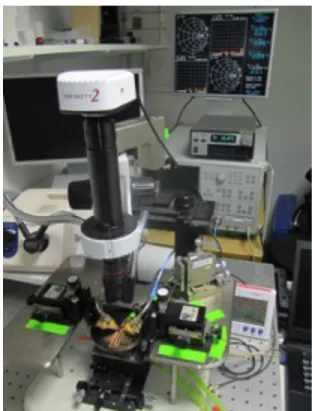
The microwave measurements are performed by connecting a Vector Network Analyzer to the sensor with two coaxial cables and two RF probes, as indicated in Fig. 4. The sensor is located on a probe station, which integrates a thermal chuck for thermal stability during measurements and an anti-vibration table. A microscope permits to visualize the liquid under test in the structure. Fluidic tubes are also connected on both side of the channel to insert the liquids to test.
Fig. 3. Cross section of the schematic of the sensor.
Fig. 4. Photography of the microwave test setup.
1µl 1mm
)))
RF
IN)))
RF
OUT CPW metallization Quartz substrate PDMS lid SU-8 walls Liquid under testA RF measurement protocol is established. It starts with the measurement of the buffer solution, which serves as a reference during the data treatment. Each molecular solution is measured three times.
Then the molecular solutions with increased concentrations are characterized, starting with the BSA solutions (at 1 and 2 mg/ml), followed by the lowest urea concentrated solutions, with then a mixture of BSA and urea. This is repeated with increased concentration of urea, from 3M to 8M, for the two concentration of BSA (1 and 2 mg/ml). Between each liquid solution, the sensor is rinsed three times with the next solution to analyze. Finally, the experiments have been repeated three times independently.
Cross measurements with a traditional optical spectroscopic technique (circular dichroism) have also been applied to confirm the BSA denaturation with a validated method.
III. MICROWAVE MEASUREMENTS AND RESULTS
As mentioned previously, the buffer dielectric response is used as a reference for all permittivity measurement.
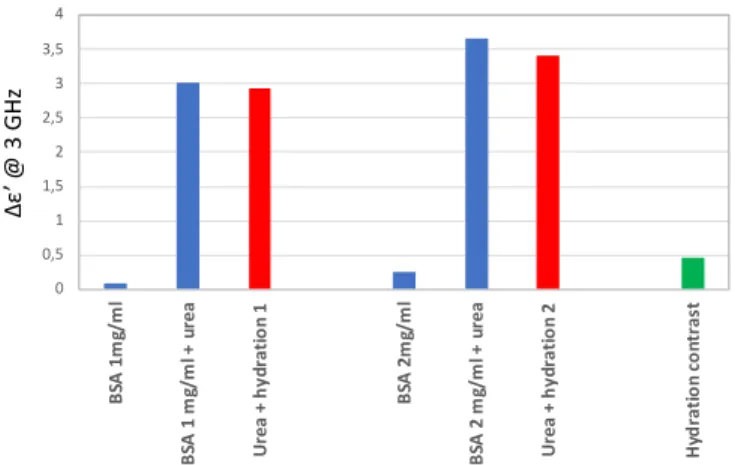
Fig. 5 indicates from the left column to the right one the obtained contrast for the real part of the permittivity of the BSA solution at a concentration 1 mg/ml, then for the mixture of BSA at 1 mg/ml and urea at 3 mol/l. In red is then indicated the contrast between these two dielectric results.
A similar data treatment is performed for the BSA solution with a 2 mg/l concentration value. Once again, the red curve placed at the right side of the mixture response corresponds to the contrast between the mixture of the protein solution with the chaotropic agent and the protein solution itself.
Due to the factor two in concentration between the two BSA solutions, the bounded water molecules are not supposed to be equal for each configuration. Therefore, the contrast between the two red columns of Fig. 5 is calculated and indicated in green on the graph. It corresponds to the hydration contrast between the two configurations.
Fig. 5. Permittivity contrasts (on the real part) at 3 GHz for the different tested solutions.
Fig. 6. Extracted “hydration” contrast for different urea concentrations and for 3 independent experiments (squares, triangles and diamonds correspond to independent experiments).
Finally, this data treatment has been applied for 4 urea solutions, exhibiting concentrations from 3 to 8 mol/l. Fig. 6 presents the hydration contrast obtained for each concentration and for three independent experiments, i.e. performed at different weeks, with different sensors and initial calibration step of the test setup.
One may notice that each independent experiment leads to a similar tendency. This hydration contrast linearly rises, while the urea concentration increases. This result is coherent with the fact that the amount of bounded water molecules increases as the chaotropic agent is more concentrated, leading to a larger proportion of denatured BSA.
IV. CONCLUSIONS
This paper presents rigorous microwave experiments performed on the large BSA protein, which presents different conformations due to the action of a chaotropic agent. After the establishment of a microwave data treatment, the hydration contrast between the different molecular structures of the protein (structured and denatured) is extracted. A linear relationship between this hydration contrast and the urea concentration is obtained. This result demonstrates the ability of microwave dielectric spectroscopy to give access to the study of conformational change.
REFERENCES
[1] S. Trabelsi et al., “New calibration technique for microwave moisture sensors,” IEEE T-Inst. And Meas. 2001, 50, 4, 877-881.
[2] S. Trabelsi et al., “Influence of nonequilibrated water on microwave dielectric properties of wheat and related errors in moisture sensing,” IEEE T-Inst. And Meas. 2007, 56, 1, 194-198.
[3] E. Levy, G. Barshtein, L. Livshitz, P. Ben Ishai1 and Yu. Feldman, “The Vitality of Human RBC and its connection to cytoplasmic water: I. The glucose concentration influence” Journal Physical Chemistry B, 2016, Vol. 120, pp. 10214.
[4] F. Artis, T. Chen, T. Chrétiennot, J-J. Fournié, M. Poupot, D. Dubuc, K. Grenier, ‘Microwaving biological cells - Intracellular analysis with microwave dielectric spectroscopy’, IEEE Microwave Magazine, pp. 87-96, May 2015.
[5] K. Grenier, D. Dubuc, T. Chen, F. Artis, T. Chrétiennot, M. Poupot, J-J. Fournié, ‘Recent Advances in Microwave-based Dielectric Spectroscopy at the Cellular Level for Cancer Investigations’, invited paper in IEEE
0 0,5 1 1,5 2 2,5 3 3,5 4 BS A 1 m g/ m l BS A 1 m g/ m l + u re a Ur ea + h yd ra tio n 1 BS A 2 m g/ m l BS A 2 m g/ m l + u re a Ur ea + h yd ra tio n 2 Hy dr at io n co nt ra st Δε ’ @ 3 G H z 0 0,1 0,2 0,3 0,4 0,5 0,6 0,7 0 2 4 6 8 10
Urea concentration (mol/L)
at 3 GHz « Hy dr at io n » co nt ra st
Trans. on Microwave Theroy and Techniques (T-MTT), Vol. 61, Issue 5, 2013, pp. 2023-2030.
[6] Y. Feldman et al., “Hydration of AMP and ATP Molecules in Aqueous Solution and Solid Films,” Int. J. Mol. Sci., 2013, Vol. 14, pp. 22876-22890.
[7] K. Fuchs, U. Kaatze, “Molecular Dynamics of Carbohydrate Aqueous Solutions. Dielectric Relaxation as a Function of Glucose and Fructose Concentration,” J. Phys. Chem. B, 2001, Vol. 105, pp. 2036-2042. [8] K. Fuchs, U. Kaatze, “Dielectric spectro of mono- and disaccharide
aqueous solutions,” J. Chem. Phys., 2002, Vol. 116, n° 16, 7137-7144.
[9] C. Cametti, S. Marchetti, C.M.C. Gambi, G. Onori, “Dielectric relaxation spectroscopy of lysozyme aqueous solutions: analysis of the δ-dispersion and the contribution of the hydration water,” J. Phys. Chem. B, 2011, Vol. 115, pp. 7144-7153.
[10] Y. Hayashi, I. Oshige, Y. Katsumoto, S. Omori, A. Yasuda, “Protein-solvent interaction in urea-water systems studied by dielectric spectroscopy”, J. Non-Crystalline Solids 2007, Vol. 353, pp. 4492-4496. [11] B.A. Mazzeo, A.J. Flewitt, “Observation of protein-protein interaction by dielectric relaxation spectroscopy of protein solutions for biosensor application,” APL 2007, 90, 123901.