Publisher’s version / Version de l'éditeur:
Vous avez des questions? Nous pouvons vous aider. Pour communiquer directement avec un auteur, consultez la
première page de la revue dans laquelle son article a été publié afin de trouver ses coordonnées. Si vous n’arrivez pas à les repérer, communiquez avec nous à PublicationsArchive-ArchivesPublications@nrc-cnrc.gc.ca.
Questions? Contact the NRC Publications Archive team at
PublicationsArchive-ArchivesPublications@nrc-cnrc.gc.ca. If you wish to email the authors directly, please see the first page of the publication for their contact information.
https://publications-cnrc.canada.ca/fra/droits
L’accès à ce site Web et l’utilisation de son contenu sont assujettis aux conditions présentées dans le site LISEZ CES CONDITIONS ATTENTIVEMENT AVANT D’UTILISER CE SITE WEB.
The Journal of Physical Chemistry C, 123, 47, pp. 28715-28725, 2019-11-05
READ THESE TERMS AND CONDITIONS CAREFULLY BEFORE USING THIS WEBSITE.
https://nrc-publications.canada.ca/eng/copyright
NRC Publications Archive Record / Notice des Archives des publications du CNRC :
https://nrc-publications.canada.ca/eng/view/object/?id=4313d3b2-fc35-4338-adc0-48ec24623b28 https://publications-cnrc.canada.ca/fra/voir/objet/?id=4313d3b2-fc35-4338-adc0-48ec24623b28
NRC Publications Archive
Archives des publications du CNRC
This publication could be one of several versions: author’s original, accepted manuscript or the publisher’s version. / La version de cette publication peut être l’une des suivantes : la version prépublication de l’auteur, la version acceptée du manuscrit ou la version de l’éditeur.
For the publisher’s version, please access the DOI link below./ Pour consulter la version de l’éditeur, utilisez le lien DOI ci-dessous.
https://doi.org/10.1021/acs.jpcc.9b07769
Access and use of this website and the material on it are subject to the Terms and Conditions set forth at
Molecular dynamic simulations of clathrate hydrate anomalous
preservation: the effect of coating clathrate hydrate phases
Naeiji, Parisa; Woo, Tom K.; Alavi, Saman; Ripmeester, John A.
Molecular Dynamic Simulations of Clathrate Hydrate Anomalous
Preservation: The E
ffect of Coating Clathrate Hydrate Phases
Parisa Naeiji,
†Tom K. Woo,
†Saman Alavi,
*
,†,‡and John A. Ripmeester
‡†Department of Chemistry and Biomolecular Sciences, University of Ottawa, Ottawa, Ontario K1N 6N5, Canada ‡National Research Council of Canada, 100 Sussex Dr., Ottawa, Ontario K1A 0R6, Canada
*
S Supporting InformationABSTRACT: In this work, the effect of cyclopentane (CP) clathrate hydrate on the anomalous preservation of tetrahydrofuran (THF) hydrate under conditions outside its stability region is studied by using molecular dynamics simulations. The decompositions of pure structure II THF and CP clathrate hydrate, and also THF hydrate coated by CP hydrate, all with outer (001) surfaces exposed to vacuum, were simulated at different temperatures and characterized by the potential energy, the F3
order parameter, and visual inspection of snapshots of the hydrate system at different times. The upper bounding melting points of THF and the CP hydrate with the employed forcefields were predicted to be 270 and 290 K, respectively, which were close to the experimental values of 277.5 and 281 K. To study the origins of anomalous preservation and superheating effects in hydrates, we placed layers of the higher-decomposition point CP hydrate as a coating on bulk THF hydrate to study the possible superheating of the THF hydrate. Whereas the pure THF hydrate melted at 270 K after a simulation time of about 50 ns, with the CP hydrate layer coating, the
THF hydrate in the simulations did not dissociate at 290 K, corresponding to a superheating temperature of 20 K, up to a simulation time of 120 ns. Upon coating with the CP hydrate, the decomposition of the THF hydrate is transformed from a heterogeneous mechanism at the hydrate−vacuum or hydrate−water interface to a homogeneous mechanism which leads to superheating of the THF hydrate phase. The dissociation of the THF and the CP hydrate layers occurs in a stepwise fashion perpendicular to the hydrate interface from the outer to inner layers, similar to the dissociation of the structure I methane hydrate previously studied.
1. INTRODUCTION
Clathrate hydrates are crystalline porous solid inclusion compounds composed of guest molecules [e.g., methane, carbon dioxide, tetrahydrofuran (THF), and others] encapsu-lated in hydrogen-bonded water molecule cages, which form under suitable thermodynamic conditions.1,2 The clathrate hydrates have attracted a great deal of attention as a medium for transportation of methane or natural gas for energy applications. Many researchers have stated that for distances of around 1000−6000 km, transportation of the gas hydrates is more economical than pressured gas.3,4 Moreover, gas transportation in the form of solid gas hydrate significantly decreases the risk of ignition or accidents in the tanker in comparison with liquefied natural gas.5
To use gas hydrates in the context of gas production, storage, and transportation, knowledge of the hydrate thermodynamic stability range, and how this limits hydrate formation and utilization processes is important. It has been found that clathrate hydrates can be kept under metastable conditions outside their thermodynamic stability zone. It was previously observed that a dense ice crust covers methane and CO2hydrate particle surfaces when they decompose between
243 and 273 K (−30 to 0 °C).6,7This ice“crust” can stabilize the underlying hydrate phase for extended periods of time by
greatly decreasing the hydrate decomposition rate, even when the hydrate is outside the stability region. This condition, where after an initial decomposition, an ice layer forms on the remaining hydrate phase which slows its decomposition in a pressure−temperature region in which it is thermodynamically metastable, is called hydrate self-preservation.8−10Research has been directed toward preventing decomposition of gas hydrates and improving the efficiency of self-preservation in technological uses of hydrates for guest storage and trans-portation. Stern et al. stated that after a short rapid dissociation process, methane hydrate remains preserved in a metastable state for up to 2−3 weeks at up to 75 K above its stability limit of 193 K at 0.1 MPa.11 They found that ice-shielding can explain the self-preservation of residual gas hydrate (less than 8%) in low-temperature rapid-depressurization tests and in temperature-ramping tests.11 In the presence of electrolyte crystals in the aqueous mixture in contact with methane hydrate, the mobility of water molecules is increased, and this causes the formation of a contiguous ice layer, which acts as a barrier to diffusion of methane away from the hydrate phase.12
Received: August 14, 2019 Revised: October 24, 2019 Published: November 5, 2019
pubs.acs.org/JPCC
Cite This:J. Phys. Chem. C 2019, 123, 28715−28725
Downloaded via NATL RESEARCH COUNCIL CANADA on April 6, 2021 at 17:57:04 (UTC).
The self-preservation of the hydrate phase with ice is limited naturally by the melting point of ice. It would be a major advance to overcome the limitation of the melting point of ice as the upper bound of hydrate preservation, with implications for hydrate transport technology.
A number of researchers studied the ice-shielding effect on self-preservation of methane hydrate and other hydrate formers. For example, they studied the effect of hydrate particle size on self-preservation, the degree of preservation, and the crystal textural changes of the ice cover for the preserved gas hydrate. The scanning microscope images of the methane hydrate surface showed that small grains of ice cover the surface after partial dissociation.13 The larger hydrate particles were found to retain more methane gas than smaller ones for equal volumes of hydrate at a given temperature.13On the other hand, Takeya and Ripmeester stated that the different strengths of interaction between water and gases such as CH4, N2, and Ar determine the degree of self-preservation,
such that the hydrates with weaker guest−water interaction showed the strongest preservation effect.14 Falenty and Kuhs studied the self-preservation of CO2 hydrate by scanning
electron microscopy above 240 K. They stated that the phenomenon of self-preservation is related to the permeability of the ice cover, which is governed by the initial microstructure of ice and/or the subsequent annealing of this ice coating.6 The interplay of the ongoing hydrate dissociation process with the microstructure of the newly formed ice and its annealing causes various dissociation paths.6
The hexagonal ice Ihlattice constant formed on the outside of the clathrate hydrate phase is not directly compatible with the lattice constant of the structure I clathrate hydrate phases of methane or CO2guests, and spacing of the water molecules
in the two lattices are not particularly commensurate. However, it is believed that an amorphous water phase connects the clathrate hydrate water framework to the ice framework, and the ice layer shell may therefore form a closed shell around the hydrate phase, which removes the free hydrate interface, provides a diffusion barrier for the released gas from the hydrate, and provides a source of surface pressure on the hydrate phase.
Guests in clathrate hydrate phases are not restricted to small gas molecules and larger molecules in the liquid phase under normal conditions, such as THF and cyclopentane (CP), also form clathrate hydrates. THF is an organic solvent that forms the structure II (sII) hydrate phase at atmospheric pressure and temperatures below the hydrate formation temperature of 277.55 K.15As neither high pressure nor cooling below 273.15 K is required for THF hydrate growth, it has been used in many experimental studies as a model for gas hydrates.16,17 Moreover, natural gases which are the mixtures of methane and other larger molecules like propane, form sII hydrates similar to THF hydrate.1THF hydrate decomposes above the freezing point of water, and to study “anomalous preservation” of the hydrate phase above its thermodynamic decomposition temperature, Sharifi et al. immersed a sample of THF hydrate into CP liquid to form CP hydrate on the outer layer of the THF hydrate crystals. They verified this structure by diffraction-enhanced X-ray imaging.18 The lattice constants of the sII THF and CP hydrates are very close and the CP hydrate layer eliminated the free THF hydrate interface. Using visual inspection under thermostated conditions, they observed that the melting points of THF and CP hydrate at atmospheric pressure are 277.5 and 280.8 K, respectively, whereas the THF
hydrate coated by a thin layer of CP hydrate melted at a temperature about 2 K higher than the uncoated THF hydrate.18Their results proved that the coating of less stable clathrate hydrate with the more stable hydrates is a suitable alternative approach for the anomalous preservation of less stable hydrates at temperatures above the melting point of ice.18In this work, we will study the melting of THF and CP hydrates using molecular dynamics (MD) simulations to determine molecular level details of this anomalous preserva-tion.
The dissociation of the THF hydrate phase using MD simulation has been studied by several research groups. Using a six-site water potential19 and the optimized potential for the liquid state-united atom (OPLS UA) potential,17Nada (2003) found that the growth of THF hydrate from aqueous solution is not isotropic and favors the [100] surface compared to the [111] surface. In his simulations, the hydrate decomposition was not observed at 295 K, which he assumed to be the melting temperature (Tm) of the clathrate at 1 atm.
20
The overestimation of the melting point was related to the specific combination of forcefields used for water and THF. Wu et al. (2015) reported the formation/decomposition temperature between 251.0± 3.0 and 277.5 ± 2.5 K for THF hydrate in contact with aqueous THF solutions using the TIP4P-Ew potential for water and the OPLS AA (all-atom) forcefield for THF and different adjusted parameters for the water−THF interaction potential. To obtain proper solubility results for THF in water, they modified the water−THF Lennard-Jones potential parameters. This modified potential showed the best agreement with the experimental decomposition temperature for THF hydrate. The difference in the dissociation temper-ature between their simulation and experiment can be reduced with the modified force field.21Yagasaki et al. (2016) used MD simulations to determine the formation/decomposition tem-perature of THF hydrate from aqueous THF solution at 1 bar as 275 K,22which is close to the experimental value. They used the TIP4P/ice potential for water23,24 and the OPLS united atom forcefield for THF17,22with scaled charges.
The melting point of CP hydrate using the TIP4P/ice potential for water and the OPLS UA potential for CP with a two-phase water−solid hydrate system was predicted to be Tm = 280 K by Sæthre (2016), which was close to the experimental data on this system.25 On the other hand, the MD simulations of Iwai and Aokawa (2014) using the SPC/E potential for water26 and all-atom OPLS potential for CP,27 determined the decomposition temperatures of CP hydrate to be higher than the experimental data, with the melting point predicted to be 308.5 K for CP hydrate at 10.1 MPa, whereas the experimental decomposition temperature is around 283 K.28 They considered possible reasons: to reduce the computation time, the number of adjustable molecular parameters in the molecular simulation was small and these were not adjusted to optimize the agreement with the experimental dissociation temperature. On the other hand, they simulated the hydrate decomposition with a sample of solid under periodic boundary conditions (PBCs), such that a liquid−hydrate interface was not present in the simulation. It is known that homogeneous solid-state simulations with PBCs overestimate the predicted melting transition compared to simulation with a two-phase liquid−solid hydrate interface.28
In experimental and simulation work, a method similar to the anomalous preservation for the clathrate phases is used for keeping solids, in particular metals, in metastable states. In
experiments and simulations, a nanoparticle or bulk sample of a lower melting point metal, for example, Ag, is coated with a higher melting point metal, for example, Ni. These two metals have a relatively small∼16% lattice mismatch and form a low-energy, semicoherent interface.29−31It was observed that the inner Ag metal phase can be superheated by as much as 40−70 K29,30,32because of being coated by the higher melting metal and not having a free surface. The outer Ni coating removes the heterogeneous Ag−air interface and replaces it with a low energy Ag−Ni interface, which transforms the Ag melting mechanism from heterogeneous to homogeneous melting.33 Upon further heating, the Ag−Ni interface is still the site of heterogeneous nucleation for melting in these nanoparticles, but much higher superheating temperatures for Ag are allowed in this case.
In simulating the melting of solids, including hydrate dissociation, a free solid−vacuum or solid−liquid interface must be included to accurately determine the melting temperature. Ideal solid phases simulated with PBCs have a free energy barrier to melting and can only melt through a homogeneous nucleation mechanism.29,34,35
In this work, we study the anomalous preservation of THF hydrate coated with CP hydrate using MD simulations to study the mechanism of superheating of the THF phase as seen in the results of the recent work by Sharifi et al.18
2. COMPUTATIONAL DETAILS
All MD simulations were performed using the DL_POLY program version 2.20 developed by Smith, Forester, and Todorov.36In the simulations,first, the melting points of pure THF and CP hydrates were determined using a 2× 2 × 2 unit cell replica of the sII hydrate of these guests with each large cage filled with one guest molecule. To study the effect of hydrate sample size on the dissociation time and temperature, the melting point of a 2× 2 × 3 unit cell replica of the sII THF hydrate was also determined. To study anomalous preserva-tion, the 2× 2 × 2 unit cell replica sample of the THF hydrate was coated by two 2× 2 × 1 unit cell replica layers of the CP hydrate in each of the faces in the z-direction. The hydrate samples are placed in the center of the box with vacuum on each side of the hydrate in the z-direction to provide free interfaces on which the heterogeneous decomposition nucleation mechanism is initiated.
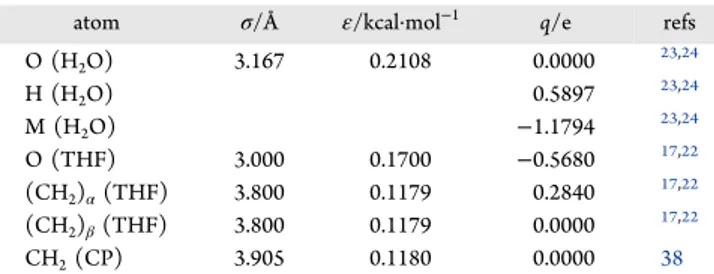
The intermolecular interactions of water molecules were modeled with the TIP4P/ice model, which is a four-site water model for simulations of water/ice near the experimental melting temperature at 1 atm.23,24The OPLS UA model was employed for THF and CP molecules to determine the Lennard-Jones parameters for the van der Waals interactions and the nucleus-centered point charges for the electrostatic interactions.17,37 The charges on the THF molecule were scaled from the OPLS UA defaults according to the recommendation of Yagasaki, Matsumoto, and Tanaka so as to accurately model the water−THF solution properties.22All cross interaction Lennard-Jones parameters between atoms on different molecules were calculated using the Lorentz− Berthelot combining rules.38The Ewald method was used to evaluate the electrostatic interactions with a relative error of 10−6and an overall cutoff of 13 Å. The guest molecules were kept rigid during simulations. The forcefield parameters are given inTable 1.
The temperature of the simulation was maintained constant using a Nosé−Hoover thermostat39
using the NVT ensemble
with a relaxation time of 0.2 ps. The equations of motion were integrated at each time step of 1 fs. After an initial equilibration stage of 50 ps, all the simulations were then continued at the target temperature until the dissociation of the hydrate phase was totally complete or the system was equilibrated with intact hydrate phase with simulation times going up to 100 ns. PBCs were used in three directions. The decompositions of THF, CP, and THF−CP hydrate were simulated in the temperature range of 250−320 K to observe the temperature at which the bulk hydrate decomposition begins. The simulation method-ology is parallel to the experimental measurements used in the work of Sharifi et al.18 For simulations of the THF and CP hydrate phases without free interfaces to compare the energy of the guest−cage interactions, we used 2 × 2 × 2 unit cell replica of the sII hydrate with the respective guests in each large cage, PBCs, and the NPT ensemble to maintain constant pressure.
Figure 1 shows the initial configuration of the pure THF
hydrate phase which is placed in the simulation box with dimensions of 34.62 Å × 34.62 Å × 100 Å and the THF hydrate phase coated with layers of CP hydrate.
When the hydrate slab dissociates during the simulation trajectory, the potential energy of the system suddenly increases. In each case, the dissociation of the hydrate was confirmed by viewing snapshots taken using the VMD molecular visualization software.40 The F3 order parameter
was calculated to characterize the local arrangement of water molecules at different locations of the hydrate phase.41The F3
order parameter is defined as
F cos cos cos 109.47
0.1 liquid water
0.0 solid water (ice, hydrate)
i jik jik j k 3, 2 2 , l m ooo n oo | } ooo ~ oo θ θ = ⟨[ | | + ] ⟩ = ∼ ∼ (1)
whereθjikis the angle between the oxygen atoms of three water
molecules of which atom i is located in the center of a spherical shell of 3.5 Å which includes atoms j and k. The F3parameter
is 0 for highly tetrahedral structures, including ice and clathrate hydrate phases and its value increases to∼0.1 for liquid water. To quantify the spatial extent of hydrate dissociation, the initial hydrate phase was divided into different layers parallel to the z-direction and the F3 parameter was calculated for each layer
separately. Once the hydrate phase starts to dissociate, the F3
parameter gradually increases.
3. RESULTS AND DISCUSSION
3.1. Dissociation of the THF Clathrate Hydrate Phase.
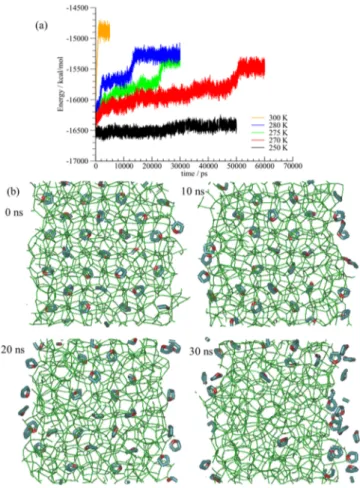
Figure 2a shows the time evolution of the potential energy of
Table 1. Force Field Parameters for Water (TIP4P/Ice), THF, and CP (OPLS UA) Used in This Worka
atom σ/Å ε/kcal·mol−1 q/e refs
O (H2O) 3.167 0.2108 0.0000 23,24 H (H2O) 0.5897 23,24 M (H2O) −1.1794 23,24 O (THF) 3.000 0.1700 −0.5680 17,22 (CH2)α(THF) 3.800 0.1179 0.2840 17,22 (CH2)β(THF) 3.800 0.1179 0.0000 17,22 CH2(CP) 3.905 0.1180 0.0000 38
aUnited atom potentials representing CH
2 groups as one center of
force are used for THF and CP in these simulations.
the simulation of the 2× 2 × 2 slab of THF hydrate exposed to vacuum in the z-direction at temperatures between 250 and 300 K with simulation times up to 60 ns. The solid hydrate phase has a lower total potential energy than that of the aqueous THF solution that forms from the dissociation of the hydrate, so the total system potential energy increases as the solid decomposes to liquid.
For the lowest temperature simulation at 250 K, the potential energy of the system remains nearly constant for the 50 ns duration of the simulation, indicating the stability of the hydrate phase.
At the higher temperatures, the potential energy shows stepwise increases with time, indicating that the hydrate slab begins the process of dissociation. At temperatures above 250 K, within thefirst ∼3 ns of the simulation, the surface hydrate layers which contain partially formed hydrate water cages, quickly dissociate and the potential energy increases suddenly. At a high temperature, namely 300 K, the potential energy of the entire system rapidly increases to reach a final plateau, implying that the hydrate phase has completely melted and an aqueous THF solution phase forms. The 300 K temperature is considerably higher than the experimental melting point of the THF hydrate, which was reported to be about 277.55 K18,42,43 and so there is a large driving force for decomposition at this temperature.
After the surface cages are decomposed, a sharp rise in the potential energy is observed at 270, 275, and 280 K after “induction times” of about 50, 22, and 12 ns, respectively. Snapshots of the simulations at each temperature are shown in
theSupporting InformationSnapshots of the simulation at 275
K are shown inFigure 2b. At 5 ns, the outer layers of THF hydrate dissociate, which corresponds to the first rise in the potential energy curve shown inFigure 2a. After this time, the water molecules in the outer layers are disordered, whereas the configurations of the water molecules in the inner layers remain unchanged in the hydrate phase for about 20 ns, after which the hydrate structure completely collapses, correspond-ing to the stepwise rise in potential energy near 22 ns inFigure 2a. The potential energy of the system plateaus again at the end of the simulation, which in this case corresponds to the water−THF solution with two exposed interfaces by the end of the 30 ns simulations. The results inFigure 2a show that the predicted melting point of the THF hydrate at 1 bar from the simulations is less than 270 K, which is in reasonable with the dissociation temperature of 275−277 K reported in the experimental and other simulation works for THF hydrate.21,22 Snapshots of the hydrate phases for simulations at different temperatures are shown in Figures S1−S5 of theSupporting
Information.
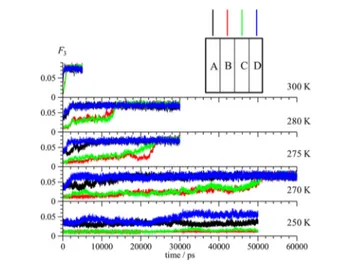
Details of the time evolution of hydrate decomposition at different temperatures can be further quantified by using the F3
order parameter for different cross sections of the slab of the simulation cell parallel to the z-direction. The hydrate phase was divided into four layers, each with a thickness of around 8.8 Å, where layers A and D are the outermost and B and C are the internal layers. Time variations of this parameter for THF hydrate layers along the z-direction at five temperatures
Figure 1.Structures of a (a) 2× 2 × 2 slab of THF hydrate and a (b) 2× 2 × 2 slab of THF coated with 2 × 2 × 1 slabs of CP hydrate on both sides in the z-direction after initial temperature equilibration and prior to large-scale dissociation of the hydrate phases. The simulations have free surfaces in the z-direction. The hydrogen bonded water network in the sII clathrate hydrate is shown by the green lines, the CP molecules are shown in red, and the THF molecule are shown with blue (carbon) and red (oxygen) colors.
Figure 2.(a) Time evolution of the simulation cell potential energy of the THF hydrate at temperatures between 250 and 300 K. (b) Snapshots of THF hydrate decomposition at the melting point at 275 K at different times in the simulation trajectory up to 30 ns.
between 250 and 300 K are shown inFigure 3. At the lowest simulation temperature of 250 K, the outer layers (with
incomplete cages) are partially decomposed as indicated by the increase of F3of the A and D layers up to 0.03−0.05, implying
that the water molecules at these locations in the simulation
cell are in a liquid-like amorphous phase. The F3of the inner layers (B and C) remain nearly constant at around 0.01 after 50 ns. At a temperature of 270 K, the outer layers decompose at times between 2 and 10 ns and their F3values reach around 0.08, whereas F3value of the inner layers do not significantly change up to 50 ns, after which is there is a rise to 0.08, which is characteristic of liquid/amorphous water. For the simulation temperature of 275 K, there is a rapid increase in the F3values
of the outer layers with incomplete cages. The F3values of the
inner layers initially plateau, but begin rising at 17 ns. At about 25 ns, the hydrate phase in these layers is completely decomposed with F3values reaching 0.08, which is
character-istic of liquid/amorphous water. From these results, a bulk decomposition temperature of 270 K is assigned to the THF hydrate.
Upon increasing the temperature, the simulation time for beginning and completing the dissociation of the hydrate phase becomes shorter. At 280 K, the inner layers were disrupted at about 12 ns and for 300 K, the F3 values of both outer and inner hydrate layers change rapidly and approach a constant value of∼0.08 at approximately 1 ns. The time for the onset of changes in the F3parameters of the different hydrate layers is
consistent with the time for changes of the potential energy of the system shown inFigure 2a.
The results ofFigure 3demonstrate the layered dissociation of hydrate in the direction parallel to the hydrate interface, which in this case is the (100) surface. A somewhat similar
Figure 3.F3order parameter for four THF hydrate layers along the
z-direction at different temperatures. As shown, the hydrate phase was divided into four layers, with layers A and D forming the outermost layers with incomplete cages, seeFigure 2.
Figure 4.(a) F3order parameter for six THF hydrate layers of the 2× 2 × 3 unit cell replica along the z-direction, which are labeled according to
the inset. (b) Snapshots of the 2× 2 × 3 unit cell replica of THF hydrate decomposition at 275 K up to 70 ns.
layer-by-layer decomposition mechanism has been observed for the sI methane hydrate phase.44−47The crystal structure of the sII hydrate unit cell does not have a distinct layered structure in the (100) direction as does the sI hydrate, but a similar stepwise dissociation of the hydrate phase is seen for the cages in the THF and CP hydrates parallel to the (100) direction.
To study any possible hydrate sample size effects on the calculated melting point and melting mechanism, Figure 4
shows the F3order parameter and simulation snapshots for the
dissociation process of a 2× 2 × 3 unit cell replica of the THF hydrate at the melting point of 275 K. The outermost layer of hydrate cages in this simulation (A and F) dissociate within the same 5 ns time range as seen in Figure 3. The F3 order
parameter shows that the dissociation of the next outermost layers (B and E) occurs within the range of 20−30 ns, which is consistent with the time scale for the dissociation of the layers seen inFigure 3. The dissociation of the innermost layers (C and D) begins at∼45 ns. In this system, the dissociation of the hydrate is again seen to occur in a sequential layer-by-layer manner. Snapshots of the THF hydrate dissociation during 70
ns of simulation clearly illustrate the layer by layer decomposition of hydrate in the (100) surface.
Wu et al.21 studied the dissociation of the√2 × √2 × 3 replica of the THF hydrate unit cell exposed on both sides in the z-direction to aqueous solutions of THF. In their simulations, times between 200 and 500 ns are required to observe the dissociation of the THF hydrate at temperature higher than the hydrate stability zone. In the present simulations, the slabs of the THF clathrate hydrate are exposed to vacuum in the z-directions on both sides. The aqueous solution in the simulations of Wu et al. stabilizes the dangling hydrogen bonds on the surface of the clathrate hydrate phase and so prolongs the process of hydrate dissociation and increases the induction time in the liquid− hydrate simulations compared to vacuum−hydrate simulations of this work where the surface clathrate hydrate phase hydrogen bonds do not interact with other molecules. The melting of the outer layer of the clathrate phase in the vacuum−hydrate simulation leads to the formation of an aqueous phase that stabilizes the inner layers of the hydrate and so even in the current simulations, dissociation of the inner hydrate layers slows down. Although the times of
Figure 5.(a) Time evolution of the simulation potential energy of the CP hydrate for simulations at temperatures between 275 and 320 K. The rise in the potential energy at around 40 ns followed by a plateauing of the potential energy at 290 K indicated the melting of the hydrate phase. (b) Snapshots of the CP hydrate decomposition at the melting point (290 K) obtained from simulations. (c) Snapshot of the totally decomposed CP hydrate phase at the end of the simulation at 300 K. A phase separation of the water/CP mixture is observed.
simulation for the phase dissociation in between the work of Wu et al. and the current simulation are different, the predicted thermodynamic melting points should be similar, to the extent that the forcefields used in the two studies are different.
3.2. Dissociation of the CP Hydrate Phase.Figure 5a shows the variation of the potential energy with time for the simulation of the 2× 2 × 2 slab CP hydrate dissociation in the temperature range of 275−320 K. For simulations at 275, 280, and 285 K, after the initial decomposition of the outer sections of the CP hydrate phase with incomplete cages, the potential energy does not change significantly and the hydrate slab remains unchanged after about 20, 50, and 100 ns, respectively. At 290 K, with snapshots shown inFigure 5b, the dissociation of inner sections of the hydrate phase starts at about 50 ns and continues over the 100 ns duration of the simulation. The hydrate phases at the end of these simulations are shown in Figures S6−S10 of the Supporting Information. From these results, 290 K is the melting point of the CP hydrate. At 300 K, the hydrate phase dissociates after an induction time of around 50 ns and at 320 K, the energy suddenly increases because the hydrate dissociation occurs almost immediately within less than 1 ns. The literature values for the CP hydrate dissociation temperature is about 280−281 K,18,48−50 which is consistent, with 300 and 320 K being much higher than the experimental melting point of the CP hydrate. A snapshot of the fully dissociated CP hydrate simulation at 300 K is shown inFigure 5c where upon dissociation of the hydrate, CP molecules mostly phase-separate to the surface of the aqueous liquid phase.
The time variations of the F3 order parameter for four
regions of the CP hydrate phase in the simulation parallel to the z-direction are shown in Figure 6. The decomposition
process occurs in the outermost layers with incomplete cages at 275 K but afterward the F3remains constant near 0.04 up to
20 ns, whereas the inner layers remain stable. At 280 K, the order parameter of layers A and D fluctuates and reaches ∼0.07 after 50 ns because of dissociation events in these layers, but the B and C layers have the F3≈ 0.01, which indicates the
ordered water molecules in the hydrate phase. When the temperature increases to 285 K, the decomposition of outer A
and D layers is accelerated but the inner B and C layers are still stable. The decomposition of the inner (B and C) layers of the CP hydrate begins after around 70 ns at 290 K, so this temperature is the predicted melting point for the CP hydrate. At 300 K, the decomposition time of inner B and C hydrate layers begins at about 20 ns. Even at 320 K, the inner layers will not decompose until the outer dissociating hydrate layer has F3≈ 0.08. The hydrate phase is totally decomposed after
only 3 ns at this temperature.
3.3. Comparing Melting Points of THF and CP Hydrates. The CP and THF guest molecules have similar sizes; however, the THF with the ether oxygen may form hydrogen bonds with the water molecules in the sII clathrate hydrate lattice. The radial distribution function (RDF) for oxygen (THF)−hydrogen (water) for the simulation of the pure THF hydrate phase with PBCs at 275 K is shown in
Figure 7. This temperature is above the determined melting
point of the THF hydrate (from the heterogeneous nucleation simulations ofFigures 2−4), but for the periodic simulations and within the time frame of the simulation, the hydrate phase remained stable. Hydrogen bonds are specified by a peak in the RDFs between 1.5 and 1.8 Å.51 As seen in this figure and confirmed in previous work,52,53 the THF molecules form hydrogen bonds with the clathrate hydrate framework water molecules to a small degree. One of the reasons for the lower decomposition temperature for the THF hydrate compared to the CP hydrate could be that the THF−water hydrogen bonding weakens the water framework and leads to the hydrate dissociating at a lower temperature than non-hydrogen-bonding CP guest.
To further compare the THF and CP hydrates, the potential energies per unit cell are calculated at 250, 260, and 270 K for the 2× 2 × 2 supercell of the two hydrates with PBCs (i.e., with no exposed hydrate interfaces) and given inTable 2. In these simulations, dissociation of the THF and CP hydrate phases did not occur so the total potential energies per unit cell given inTable 2are a reflection of the host−guest, host−host, and guest−guest interactions in these systems. As the water frameworks are similar in these hydrate phases, the difference in potential energies in the two simulations should be related to the differences in guest−water and guest−guest interaction strengths.
Figure 6.F3order parameter for four CP hydrate layers along the
z-direction at different temperatures. As shown, the hydrate phase was divided into the four layers that the layers correspond to blue: A; red: B; green: C; black: D.
Figure 7.RDF for the THF oxygen with water hydrogen in the range of 1−6 Å at 275 K where the peak at ∼1.7 Å indicates hydrogen bonding. The RDF is from simulations of the THF hydrate phase with PBCs and no free interface.
The total potential energy of the THF hydrate phase is marginally lower at each temperature than the CP phase, which could be due to the stronger THF−water interactions in the THF hydrate. One the other hand, the water−THF aqueous solution for the water miscible THF is expected to be significantly more stable than the two-phase water−CP system which forms after hydrate dissociation. It is the balance of these factors which could lead to the CP hydrate having a higher dissociation temperature compared to the THF hydrate. 3.4. Dissociation of the CP Hydrate-Coated THF Hydrate Phase. The time evolution of potential energy for the THF hydrate coated by the CP hydrate is shown inFigure 8a. It can be seen that after a slight rise in the potential energy related to the breakup of the outermost incomplete cages of the CP hydrate, the system remains stable at 275 K for 30 ns, whereas the pure THF hydrate would have started to dissociate in this temperature, as previously shown inFigures 2a and4b. The CP hydrate forms a stabilizing layer around the THF hydrate, which increases the observed melting point of the THF hydrate phase. In addition,Figure 2shows that the hydrate clathrate collapses at 280 K after 12 ns, but after the initial rise, the potential energy of the coated THF phase at
280 K remains stable for the 50 ns simulation time shown in
Figure 8a. It is clear from Figure 5a that the CP hydrate is
stable at the 280 K temperature of the simulation.
Snapshots of the simulation system at 290 K, shown in
Figure 8b, illustrate the partial breakup of the layers of the CP
clathrate hydrate coating the THF hydrate. This leads to the formation of a liquid layer on top of the CP−THF hydrate phase, but the remaining hydrate phase in the system remains stable for 120 ns simulation time. The THF hydrate directly exposed to the vacuum phase would decompose at a much shorter time at this temperature. The melting point of the CP hydrate was predicted to be ∼290 K, so coating the THF hydrate by the CP hydrate preserves the metastable THF hydrate up to this temperature as the coating layer effectively removes the interface of the THF hydrate with the vacuum or liquid phase. At a higher temperature, namely 300 K, the potential energy of the simulation system suddenly increases within 40 ns because of the dissociation of all CP hydrate layers and afterward the breakdown of the inner layers of the THF hydrate. Snapshots of the hydrate phases for simulations at different temperatures are shown in Figures S11−S14 of the
Supporting Information.
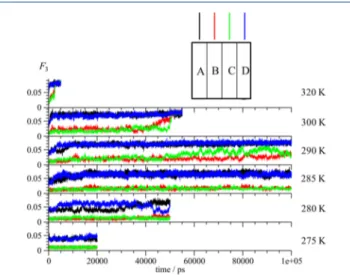
The time dependence of the F3 order parameter for
simulations of the THF hydrate coated with the CP hydrate at different temperatures is shown in Figure 9. The hydrate phase was divided into eight layers (each around 8.8 Å thick) and the F3 order parameter was determined for each layer separately. At 275 K, the F3 value of layers A and H, the
outermost layers, reaches∼0.05 after 25 ns because of partial dissociation of these layers, however, none of the internal layers of the hydrate phases decomposes. All layers of the pure Table 2. Average Potential Energy per Unit Cell for THF
and CP Hydrates at Three Temperatures Prior to Hydrate Dissociation
T/K Epot(THF)/kcal·mol−1 Epot(CP)/kcal·mol−1
250 −2146.6 −2144.6
260 −2136.4 −2134.8
270 −2126.3 −2125.0
Figure 8.(a) Time evolution of the potential energy of CP-coated THF hydrate at different temperatures. (b) Snapshots of THF−CP hydrate decomposition at 290 K.
THF hydrate (Figures 2 and 3) are decomposed at 275 K within this timescale; however, according toFigures 5and 6, the CP hydrate in the layers A and H have not decomposed at this temperature. The stabilizing effect on the outer layer of the CP hydrate is the reason for the preservation of the metastable THF hydrate at higher temperatures. In Figure 9, the dissociation of the inner CP hydrate layers begins at around 40 ns when the temperature is 290 K. This simulation run was continued up to 120 ns but the layers B and G of the CP hydrate only partly decomposed within this time. The CP hydrate layers protect the THF hydrate from dissociation. The simulation indicates that at 285 K, no dissociation of the inner layers of the CP hydrate phase or internal THF hydrate phase occurs.
The results of the current simulations are consistent with previous simulations where a metal of low melting point can be superheated by coating it with a metal with high melting point with a small lattice mismatch.30 This phenomenon is also observable through the use of differential scanning calorimetry (DSC), as the Ag nanoparticles embedded in a Ni matrix are superheated above the equilibrium melting point of the bulk Ag, as much as about 70 K in a DSC measurement.32THF and CP clathrate hydrates have similar lattice constants and so the same analysis applies to the present case. The experimental results showed that the lattice constant are around 17.15− 17.17 Å for the THF hydrate,54−56 and 17.09 Å for the CP hydrate.57
Based on the experimental results reported by Sharifi et al.,18 the conglomerates of THF hydrate crystals which were exposed to CP became encapsulated in the CP hydrate, and as a result the THF hydrate becomes stable for extended periods at a temperature about 2 K higher than the expected equilibrium melting point of the THF hydrate. They found that the preserved hydrates decompose at a temperature close to that of the CP hydrate melting point, implying that THF hydrate is kept metastable outside its usual stability zone for a considerable time.18This is in agreement with results of our simulation work, which showed that the coating of the THF hydrate with the hydrate of greater stability like the CP hydrate
results in a metastability range (superheating) by as much as 10−15 K. The results showed that the THF hydrate dissociated at a temperature of 275 K, whereas the THF− CP hydrate would only dissociate at 290 K, which is similar to that of the CP hydrate.
4. CONCLUSIONS
In this work, the anomalous preservation of the THF hydrate coated by the CP hydrate was studied by using MD simulations at different temperatures. By analysis of system properties (e.g., potential energy, simulation snapshots, and the F3 order parameter), it was found that coating a less stable
clathrate hydrate with a commensurate hydrate structure that is more stable is a suitable approach for the anomalous preservation of the less stable hydrate phase. The time evolution of the potential energy of the THF hydrate showed that the melting point of the THF hydrate at 1 atm is 270 K, while the THF hydrate may be superheated when it is encapsulated with CP hydrate crystals.
Perfect solid phases simulated with PBCs have a free energy barrier to melting as they can only melt through a homogeneous nucleation mechanism. In this work, the THF hydrate phase can be superheated by coating it with layers of the CP hydrate, as the coating effectively removes the sites of heterogeneous nucleation for the THF hydrate, leading to higher superheating temperatures.
The simulation results also demonstrated that the dissociation of the hydrate layers occurs layer by layer parallel to the exposed surface of the hydrate phase, which was the z-direction in these simulations. A rise in the potential energy is observed when a layer completely collapses.
Upon increasing the temperature, the induction time for hydrate dissociation is shorter and the time for completing the dissociation also decreases.
■
ASSOCIATED CONTENT*
S Supporting InformationThe Supporting Information is available free of charge on the
ACS Publications websiteat DOI:10.1021/acs.jpcc.9b07769.
Snapshots of the dissociation of the THF hydrate phase at 250−300 K; snapshots of the dissociation of the CP hydrate phase at 275−320 K; and snapshots of the dissociation of the composite THF−CP hydrate system at 275−300 K (PDF)
■
AUTHOR INFORMATION Corresponding Author *E-mail:salavish@uottawa.ca. ORCID Parisa Naeiji:0000-0003-2206-5510 Tom K. Woo:0000-0003-0073-3901 Saman Alavi:0000-0001-9463-8766 John A. Ripmeester:0000-0002-4091-5120 NotesThe authors declare no competingfinancial interest.
■
ACKNOWLEDGMENTSThe authors thank the University of Ottawa and the National Research Council of Canada for Computational support for this project.
Figure 9. F3 order parameter for eight THF−CP hydrate layers
(labeling shown in the inset) along the z-direction at temperatures (from top to bottom) of 300, 290, 285, 280, and 275 K.
■
REFERENCES(1) Sloan, E. D.; Koh, C. A. Clathrate Hydrates of Natural Gases, 3rd ed.; Taylor & Francis, CRC Press: Boca Raton, FL, 2008.
(2) Giavarini, C.; Hester, K. The structure and formation of gas hydrates. Physical properties of hydrates. Gas Hydrates, Immense Energy Potential and Environmental Challenges; Springer-Verlag: London, 2011.
(3) Nakata, T.; Hirai, K.; Takaoki, T. Study of natural gas hydrate (NGH) carriers. Proceedings of the 6th International Conference on Gas Hydrates: Vancouver; British Columbia, Canada, 2008.
(4) Nakai, S. Development of Natural Gas Hydrate (NGH) Supply Chain, Presented in Gastech 2011, Amsterdam, 2011.
(5) Ota, S.; Uetani, H.; Kawano, H. Use of methane hydrate pellets for transportation of natural gas-III-safety measures and conceptual design of natural gas hydrate pellet carrier. Proceedings of the 4th International Conference on Gas Hydrates, Yokohama, Japan, May 19− 23, 2002.
(6) Falenty, A.; Kuhs, W. F. “Self-Preservation” of CO2 Gas
Hydrates-Surface Microstructure and Ice Perfection. J. Phys. Chem. B 2009, 113, 15975−15988.
(7) Shimada, W.; Takeya, S.; Kamata, Y.; Uchida, T.; Nagao, J.; Ebinuma, T.; Narita, H. Texture Change of Ice on Anomalously Preserved Methane Clathrate Hydrate. J. Phys. Chem. B 2005, 109, 5802−5807.
(8) Stern, L. A.; Circone, S.; Kirby, S. H.; Durham, W. B. Anomalous preservation of pure methane hydrate at 1 atm. J. Phys. Chem. B 2011, 105, 1756−1762.
(9) Istomin, V. A.; Yakushev, V. S. Gas−hydrates self−preservation effect. Physics and Chemistry of Ice; Hokkaido University Press: Sapporo, 1992.
(10) Shimada, W.; Takeya, S.; Kamata, Y.; Uchida, T.; Nagao, J.; Ebinuma, T.; Narita, H. Mechanism of self-preservation during dissociation of methane clathrate hydrate. Proceedings Fifth Interna-tional Conference on Gas Hydrates, Trondheim, Norway, June 13−16, 2005, 1032.
(11) Stern, L. A.; Circone, S.; Kirby, S. H.; Durham, W. B. Temperature, pressure, and compositional effects on anomalous or “self” preservation of gas hydrates. Can. J. Phys. 2003, 81, 271.
(12) Sato, H.; Sakamoto, H.; Ogino, S.; Mimachi, H.; Kinoshita, T.; Iwasaki, T.; Sano, K.; Ohgaki, K. Self-preservation of methane hydrate revealed immediately below the eutectic temperature of the mother electrolyte solution. Chem. Eng. Sci. 2013, 91, 86−89.
(13) Takeya, S.; Uchida, T.; Nagao, J.; Ohmura, R.; Shimada, W.; Kamata, Y.; Ebinuma, T.; Narita, H. Particle size effect of CH4
hydrate for self-preservation. Chem. Eng. Sci. 2005, 60, 1383−1387. (14) Takeya, S.; Ripmeester, J. A. Dissociation behavior of clathrate hydrates to ice and dependence on guest molecules. Angew. Chem., Int. Ed. 2008, 47, 1276−1279.
(15) Bollavaram, P.; Devarakonda, S.; Selim, M. S.; Sloan, E. D. Growth kinetics of single crystal sII hydrates: Elimination of mass and heat transfer effects. Ann. N.Y. Acad. Sci. 2000, 912, 533−543.
(16) Gough, S. R.; Davidson, D. W. Composition of tetrahydrofuran hydrate and the effect of pressure on the decomposition. Can. J. Chem. 1971, 49, 2691−2699.
(17) Yagasaki, T.; Matsumoto, M.; Tanaka, H. Formation of clathrate hydrates of water-soluble guest molecules. J. Phys. Chem. C 2016, 120, 21512−21521.
(18) Sharifi, H.; Yoneyama, A.; Takeya, S.; Ripmeester, J.; Englezos, P. Superheating clathrate hydrates for anomalous preservation. J. Phys. Chem. C 2018, 122, 17019−17023.
(19) Nada, H.; van der Eerden, J. P. J. M. An intermolecular potential model for the simulation of ice and water near the melting point: A six-site model of H2O. Chem. Phys. 2003, 118, 7401−7413.
(20) Nada, H. Anisotropy in growth kinetics of tetrahydrofuran clathrate hydrate: A molecular dynamics study. J. Phys. Chem. B 2009, 113, 4790−4798.
(21) Wu, J.-Y.; Chen, L.-J.; Chen, Y.-P.; Lin, S.-T. Molecular dynamics study on the equilibrium and kinetic properties of
tetrahydrofuran clathrate hydrates. J. Phys. Chem. C 2015, 119, 1400−1409.
(22) Yagasaki, T.; Matsumoto, M.; Tanaka, H. Mechanism of slow crystal growth of tetrahydrofuran clathrate hydrate. J. Phys. Chem. C 2016, 120, 3305−3313.
(23) Abascal, J. L. F.; Sanz, E.; García Fernández, R.; Vega, C. A potential model for the study of ices and amorphous water: TIP4P/ Ice. J. Chem. Phys. 2005, 122, 234511.
(24) Sakamaki, R.; Sum, A. K.; Narumi, T.; Yasuoka, K. Molecular dynamics simulations of vapor/liquid coexistence using the non-polarizable water models. J. Chem. Phys. 2011, 134, 124708.
(25) Sæthre, B. S. Interfacial free energy of the structure II cyclopentane hydrate in cyclopentane liquid from the capillary wave fluctuation method. arXiv:1601.04438. arXiv.org e-Print archive.
https://arxiv.org/abs/1601.04438(accessed Sep 9, 2019).
(26) Berendsen, H. J. C.; Grigera, J. R.; Straatsma, T. P. The missing term in effective pair potentials. J. Phys. Chem. 1987, 91, 6269−6271. (27) Jorgensen, W. L.; Maxwell, D. S.; Tirado-Rives, J. Development and testing of the OPLS all-atom force field on conformational energetics and properties of organic liquids. J. Am. Chem. Soc. 1996, 118, 11225−11236.
(28) Iwai, Y.; Aokawa, R. Stability analysis for binary sII hydrogen− promoter hydrates by molecular dynamics simulation. Mol. Simul. 2015, 41, 735−740.
(29) Mei, Q. S.; Lu, K. Melting and superheating of crystalline solids: From bulk to nanocrystals. Prog. Mater. Sci. 2007, 52, 1175− 1262.
(30) Lu, K.; Jin, Z. H. Melting and superheating of low-dimensional materials. Curr. Opin. Solid State Mater. Sci. 2001, 5, 39−44.
(31) Xu, F.; Zhong, J.; Jin, Z.; Lu, K. Superheating and melting behaviors of Ag clusters with Ni coating studied by molecular dynamics and experiments. Sci. China 2001, 44, 432−440.
(32) Zhong, J.; Zhang, L. H.; Jin, Z. H.; Sui, M. L.; Lu, K. Superheating of Ag nanoparticles embedded in Ni matrix. Acta Mater. 2001, 49, 2897−2904.
(33) Porter, D. A.; Easterling, K. E.; Sherif, M. Y. Phase Transformations in Metals and Alloys, 3rd ed.; CRC Press: Boca Raton, FL, 2009.
(34) Alavi, S.; Thompson, D. L. Simulations of melting of polyatomic solids and nanoparticles. Mol. Simul. 2006, 32, 999−1015. (35) Alavi, S.; Thompson, D. L. Molecular dynamics studies of melting and some liquid-state properties of 1-ethyl-3-methylimidazo-lium hexafluorophosphate [emim][PF6]. J. Chem. Phys. 2005, 122,
154704.
(36) Smith, W.; Forester, T. R. DL_POLY_2.0: A general-purpose parallel molecular dynamics simulation package. J. Mol. Graphics 1996, 14, 136−141.
(37) Serbanovic, S. P.; Mijajlovic, M. L. J.; Radovic, I. R.; Djordjevic, B. D.; Kijevcanin, M. L. J.; Djordjevic, E. M.; Tasic, A. Z. Vapour-liquid equilibrium of the OPLS, optimized potentials for Vapour-liquid simulations, model for binary systems of alkanes and alkanes + alcohols. J. Serb. Chem. Soc. 2005, 70, 527−539.
(38) Docherty, H.; Galindo, A.; Vega, C.; Sanz, E. A potential model for methane in water describing correctly the solubility of the gas and the properties of the methane hydrate. J. Chem. Phys. 2006, 125, 074510.
(39) Hoover, W. G. Canonical dynamics: Equilibrium phase-space distributions. Phys. Rev. A: At., Mol., Opt. Phys. 1985, 31, 1695.
(40) Humphrey, W.; Dalke, A.; Schulten, K. VMD: Visual molecular dynamics. J. Mol. Graphics 1996, 14, 33−38.
(41) Báez, L. A.; Clancy, P. Computer simulation of the crystal growth and dissociation of natural gas hydrates. Ann. N.Y. Acad. Sci. 1994, 715, 177−186.
(42) Naeiji, P.; Arjomandi, A.; Varaminian, F. Amino acids as kinetic inhibitors for tetrahydrofuran hydrate formation: Experimental study and kinetic modeling. J. Nat. Gas Sci. Eng. 2014, 21, 64−70.
(43) Li, G.; Liu, D.; Xie, Y. Study on thermal properties of TBAB-THF hydrate mixture for cold storage by DSC. J. Therm. Anal. Calorim. 2010, 102, 819−826.
(44) Alavi, S.; Ripmeester, J. A. Nonequilibrium adiabatic molecular dynamics simulations of methane clathrate hydrate decomposition. J. Chem. Phys. 2010, 132, 144703.
(45) Bagherzadeh, S. A.; Englezos, P.; Alavi, S.; Ripmeester, J. A. Molecular simulation of non-equilibrium methane hydrate decom-position process. J. Chem. Thermodyn. 2012, 44, 13−19.
(46) Conde, M. M.; Vega, C. Determining the three-phase coexistence line in methane hydrates using computer simulations. J. Chem. Phys. 2010, 133, 064507.
(47) Yan, K.; Li, X.; Chen, Z.; Li, B.; Xu, C. Molecular dynamics simulation of methane hydrate dissociation by depressurisation. Mol. Simul. 2013, 39, 251−260.
(48) Nakajima, M.; Ohmura, R.; Mori, Y. H. Clathrate hydrate formation from cyclopentane-in-water emulsions. Ind. Eng. Chem. Res. 2008, 47, 8933−8939.
(49) Ho-Van, S.; Douzet, J.; Le-Quang, D.; Bouillot, B.; Herri, J. M. Behavior of cyclopentane hydrates formation and dissociation in pure water and in the presence of sodium chloride. International Conference on Integrated Petroleum Engineering (IPE), 2016.
(50) Sojoudi, H.; Walsh, M. R.; Gleason, K. K.; McKinley, G. H. Investigation into the formation and adhesion of cyclopentane hydrates on mechanically-robust vapor-deposited polymeric coatings. Langmuir 2015, 31, 6186−6196.
(51) Alavi, S.; Shin, K.; Ripmeester, J. A. Molecular dynamics simulations of hydrogen bonding in clathrate hydrates with ammonia and methanol guest molecules. J. Chem. Eng. Data 2015, 60, 389−397. (52) Alavi, S.; Susilo, R.; Ripmeester, J. A. Linking microscopic guest properties to macroscopic observables in clathrate hydrates: Guest-host hydrogen bonding. J. Chem. Phys. 2009, 130, 174501.
(53) Alavi, S.; Ripmeester, J. A. Effect of small cage guests on hydrogen bonding of tetrahydrofuran in binary structure II clathrate hydrates. J. Chem. Phys. 2012, 137, 054712.
(54) Mak, T. C. W.; McMullan, R. K. Polyhedral clathrate hydrates. X. Structure of the double hydrate of tetrahydrofuran and hydrogen sulfide. J. Chem. Phys. 1965, 42, 2732−2737.
(55) Tse, J. Thermal expansion of the clathrate hydrates of ethylene oxide and tetrahydrofuran. J. Phys., Colloq. 1987, 48, 543−549.
(56) Bertie, J. E.; Jacobs, S. M. Infrared spectra from 300 to 10 cm‑1 of structure II clathrate hydrates at 4.3 K. J. Chem. Phys. 1978, 69, 4105−4113.
(57) Li, X.-S.; Xu, C.-G.; Chen, Z.-Y.; Cai, J. Synergic effect of cyclopentane and tetra-n-butyl ammonium bromide on hydrate-based carbon dioxide separation from fuel gas mixture by measurements of gas uptake and X-ray diffraction patterns. Int. J. Hydrogen Energy 2012, 37, 720−727.