Publisher’s version / Version de l'éditeur:
Environmental Science & Technology, 39, 7, pp. 2315-2319, 2005-04-01
READ THESE TERMS AND CONDITIONS CAREFULLY BEFORE USING THIS WEBSITE. https://nrc-publications.canada.ca/eng/copyright
Vous avez des questions? Nous pouvons vous aider. Pour communiquer directement avec un auteur, consultez la première page de la revue dans laquelle son article a été publié afin de trouver ses coordonnées. Si vous n’arrivez pas à les repérer, communiquez avec nous à PublicationsArchive-ArchivesPublications@nrc-cnrc.gc.ca.
Questions? Contact the NRC Publications Archive team at
PublicationsArchive-ArchivesPublications@nrc-cnrc.gc.ca. If you wish to email the authors directly, please see the first page of the publication for their contact information.
NRC Publications Archive
Archives des publications du CNRC
This publication could be one of several versions: author’s original, accepted manuscript or the publisher’s version. / La version de cette publication peut être l’une des suivantes : la version prépublication de l’auteur, la version acceptée du manuscrit ou la version de l’éditeur.
For the publisher’s version, please access the DOI link below./ Pour consulter la version de l’éditeur, utilisez le lien DOI ci-dessous.
https://doi.org/10.1021/es049269z
Access and use of this website and the material on it are subject to the Terms and Conditions set forth at
Efficient Recovery of CO2 from Flue Gas by Clathrate Hydrate
Formation in Porous Silica Gels
Seo, Yu-Taek; Moudrakovski, Igor L.; Ripmeester, John A.; Lee, Jong-Won;
Lee, Huen
https://publications-cnrc.canada.ca/fra/droits
L’accès à ce site Web et l’utilisation de son contenu sont assujettis aux conditions présentées dans le site LISEZ CES CONDITIONS ATTENTIVEMENT AVANT D’UTILISER CE SITE WEB.
NRC Publications Record / Notice d'Archives des publications de CNRC:
https://nrc-publications.canada.ca/eng/view/object/?id=6f689213-7add-4abc-90d4-6bc3dd1df0e3
https://publications-cnrc.canada.ca/fra/voir/objet/?id=6f689213-7add-4abc-90d4-6bc3dd1df0e3
Efficient Recovery of CO
2
from Flue
Gas by Clathrate Hydrate Formation
in Porous Silica Gels
Y U - T A E K S E O
Conversion Process Research Center, Korea Institute of Energy Research, P.O. Box 103, Jang-dong, Yuseong-gu,
Daejeon 305-343, Republic of Korea
I G O R L . M O U D R A K O V S K I A N D J O H N A . R I P M E E S T E R *
Steacie Institute for Molecular Sciences, National Research Council of Canada, Ottawa, Ontario, Canada K1A 0R6
J O N G - W O N L E E A N D H U E N L E E
Department of Chemical and Biomolecular Engineering, Korea Advanced Institute of Science and Technology, 373-1 Kuseong-dong, Yuseong-gu,
Daejeon 305-701, Republic of Korea
Thermodynamic measurements and NMR spectroscopic
analysis were used to show that it is possible to recover
CO
2from flue gas by forming a mixed hydrate that removes
CO
2preferentially from CO
2/N
2gas mixtures using water
dispersed in the pores of silica gel. Kinetic studies with
1H
NMR microimaging showed that the dispersed water in
the silica gel pore system reacts readily with the gas, thus
obviating the need for a stirred reactor and excess
water. Hydrate phase equilibria for the ternary CO
2-N
2-water system in silica gel pores were measured, which show
that the three-phase hydrate-water-rich liquid-vapor
equilibrium curves were shifted to higher pressures at a
specific temperature when the concentration of CO
2in the
vapor phase decreased.
13C cross-polarization NMR
spectral analysis and direct measurement of the CO
2content
in the hydrate phase suggested that the mixed hydrate
is structure I at gas compositions of more than 10 mol %
CO
2, and that the CO
2molecules occupy mainly the
more abundant 5
126
2cages. This makes it possible to
achieve concentrations of more than 96 mol % CO
2gas in
the product after three cycles of hydrate formation and
dissociation.
1H NMR microimaging showed that hydrate
yields of better than 85%, based on the amount of water,
could be obtained in 1 h when a steady state was
reached, although ∼90% of this yield was achieved after
∼20 min of reaction time.
Introduction
Even in the 21st century, the energy production industry will rely greatly on fossil fuels and the increasing concentration of atmospheric CO2due to carbon emissions will continue to be a major concern for climate change. One of the major sources of carbon emissions to the atmosphere is flue gas from power plants. To stabilize and reduce concentrations
of this greenhouse gas, it will be necessary to develop CO2 recovery and storage techniques. Gas hydrates should be considered of particular interest to the energy and environ-mental field because each volume of hydrate can contain as much as 170 volumes of gas under standard temperature and pressure conditions (1). The formation of CO2hydrate in the deep ocean was considered as one of the possible strategies for carbon sequestration (2, 3). Accordingly, it may be desirable to recover CO2from flue gas by formation of gas hydrate under certain conditions.
Gas hydrates are nonstoichiometric crystalline com-pounds formed when guest molecules of suitable size and shape are incorporated into well-defined host cages made up of hydrogen-bonded water molecules (4). These com-pounds exist in three distinct structural families termed, structures I, II, and H. Numerous investigations covering macroscopic phase equilibria and microscopic structure identification of pure and mixed hydrates can be found in a variety of sources (5-8). Among the common hydrate formers, CO2is known to form structure I, while N2forms structure II hydrate (1). Since CO2and N2are known as major components of flue gas from power plants, it is necessary to understand the structural characteristics of mixed hydrates formed from gas mixtures of CO2 and N2 for developing recovery processes for CO2by hydrate formation. Despite its industrial importance, only a few studies have focused on the mixed hydrate of CO2and N2. Kang et al. (9). chose THF solutions to capture CO2by forming a mixed hydrate and measured hydrate equilibrium conditions that include the stabilizing effects of THF guest molecules in the lattice. However, the THF molecules will occupy many of the hydrate cages and may well cause a low efficiency of CO2recovery, although their presence greatly reduces the required pressure for hydrate formation. In the present study, we used pure water adsorbed in silica gel pores to form the hydrate. When a bulk water phase is used, hydrate formation is limited by gas-water contact at the interface; however, CO2and N2 molecules can easily penetrate a bed of silica gel particles saturated with water, and the dispersed water presents a huge surface for contacting gas molecules and forming gas hydrate in silica gel pores. To develop the recovery process of CO2from flue gas, dissociation pressures of CO2and N2 hydrates confined in silica gel pores of nominal diameters of 30.0 nm were measured at several CO2vapor compositions and the amount of CO2 occupying hydrate cages was quantified by measuring gas released from hydrate samples formed at various CO2vapor compositions. In addition,13C cross-polarization (CP) NMR spectroscopy was used to identify the structure of the mixed hydrate and the distribu-tion of CO2molecules in both 512and 51262cages. We have used1H magnetic resonance microimaging to monitor the hydrate formation kinetic processes in silica gel pores.
Experimental Section
Silica gel of nominal pore diameter 30.0 nm was purchased from Silicycle (Canada), and the properties of the silica gel were measured on a Micromeritics ASAP 2000 pore size analyzer. The details of the gel properties and pore size distribution are given in a previous study (10). The silica gel used was first dried at 373 K for 24 h before water sorption. Then, pore-saturated silica gel was prepared by placing the dried material in a desiccator containing degassed and distilled water, evacuating the desiccator, and allowing it to stand for more than 5 days. The total amount of sorbed water in the silica gel pores was confirmed by measuring the mass of silica gel before and after saturation and was found to be * Corresponding author phone: (613) 993-2011; fax: (613)
998-7833; e-mail: John.Ripmeester@nrc-cnrc.gc.ca.
Environ. Sci. Technol.2005,39,2315-2319
almost identical with the pore volume in each silica gel. A schematic diagram and detailed description of the experimental apparatus was given in previous papers (8, 10). The experiment for the equilibrium measurements began by charging the equilibrium cell with about 25 cm3of silica gel containing pore water. After the equilibrium cell was pressurized to the desired pressure with a gas mixture of N2 and CO2, the cell was cooled slowly to 263 K. When the pressure reduction due to hydrate formation reached a steady state, the cell temperature was increased at a rate of about 0.1 K/h. The nucleation and dissociation steps were repeated at least two times to reduce possible hysteresis phenomena. The equilibrium pressure and temperature of the three phases (hydrate (H)-water-rich liquid (Lw)-vapor (V)) were deter-mined by tracing the P-T profiles from hydrate formation to dissociation. The dissociation equilibrium point in porous silica gel was chosen as the crossing point between the maximum inclination line and the complete dissociation line in the P-T profiles. In the present work we tested each equilibrium point several times, finally taking a reproducible value. Before we started the experiments associated with gas mixtures, the pure CO2gas was used to check the equilibrium conditions of pure CO2hydrate in both bulk water and 30.0 nm silica gel pores. Also, the reference data for pure CO2 hydrate in silica gel pores have been added and are compared with our results.
The H-Lw-V equilibria were measured at four different CO2vapor compositions of 10.0, 17.0, 35.0, and 50.0 mol %. For composition measurements of gas released from hydrate, a sampling valve with a loop volume of 1 µL was installed and connected to an on-line gas chromatograph, which was previously calibrated for CO2and N2. When the pressure reduction due to hydrate formation reached a steady state, the vapor phase was removed under vacuum at 243.1 K. Then, the valve was quickly closed to isolate the system, and the temperature was increased to induce complete dissociation of the hydrate phase. The evolving gases were analyzed several times at 272.1 K with a gas chromatograph attached directly to the high-pressure cell to eliminate possible errors that might arise during the sampling procedure and to confirm the reproducibility of the data. The composition of released gas from the hydrate sample was measured at a range of 3.8-85.0 mol % CO2to provide the trends of CO2composition in the hydrate phase. The temperature of the cell was measured by a K-type thermocouple probe with a digital thermometer with a resolution of (0.1 K. A Heise tube pressure gauge having a maximum error of (0.1 bar in the full-scale range was used to measure the cell pressure. The experimental composition deviation for the vapor phase was found to be within (0.1%.
The13C CP NMR spectra were recorded on a Bruker DSX 400 NMR spectrometer at a Larmor frequency of 100.6 MHz and were used to identify the crystal structure of the mixed hydrate confined in the silica gel pores. The hydrate samples were placed in a 4 mm o.d. zirconia rotor and were loaded into a variable-temperature probe. The pulse length for protons was 5 µs, and a pulse repetition delay of 3 s was employed with a contact time of 1.0 ms. The downfield carbon resonance peak of adamantane, assigned a chemical shift of 38.3 ppm at 300 K, was used as an external chemical shift reference.
1H NMR microimaging experiments were also performed on a Bruker DSX 400 NMR spectrometer with a specially designed static high-pressure probe built around a 7 mm o.d. ZrO2cell. A single-slice spin-echo imaging technique with Gaussian-selective pulses was used. In the reported set of microimaging experiments a single slice of 250 µm thickness was acquired in the plane along the axis of the cell in a field of view of 10 × 20 mm. Such an orientation of the slice was selected because it proved easier to monitor the
conversion of water to hydrate throughout the sample. The 192 × 192 acquisition matrix was extended before Fourier transformation to 256 × 256. Eight scans were accumulated in most experiments to obtain a good signal-to-noise ratio. The temperature was controlled using a Bruker BVT 3000 temperature control unit during the experiments. Integration of the images was performed using a set of customized NMR imaging graphic tools for the Origin software package.
Results and Discussion
Most power plants use air-fired combustion, a process that exhausts CO2diluted with N2, and often the flue gas from power plants contains 10.0-20.0 mol % CO2. Although it contains small amounts of O2and other trace gases, the flue gas can be treated as a binary mixture of CO2and N2after suitable pretreatment steps. Both CO2and N2are known to form gas hydrate as single guests and should be incorporated together in the hydrate cages when they form mixed hydrate from gas mixtures. Three-phase H-Lw-V equilibria for ternary CO2-N2-water mixtures in 30.0 nm silica gel pores were measured to provide the hydrate formation and dissociation conditions at corresponding vapor phase com-positions of 10.0, 17.0, 35.0, and 50.0 mol % CO2. The results are shown in Figure 1 and suggest that the increase of N2in the gas mixture raises the equilibrium pressure at a specific temperature.
Figure 1 also shows the equilibrium conditions of pure CO2hydrate formed both in bulk water and in water dispersed in 30.0 nm silica gel pores. For comparison, the pore hydrate data reported in the literature (11) were included in Figure 1 and are in good agreement with our data. As expected, the dissociation pressures of CO2hydrate in silica gel pores were shifted to higher pressures when compared with that in bulk water. Accordingly, for purposes of rational process design it is worthwhile to note that the pore system causes inhibition of hydrate formation similar to that observed due to the addition of salts and alcohols, which results to the reduction of water activity. The H-Lw-V equilibrium pressure of 50.0 mol % CO2showed only a small difference from that of pure CO2hydrate at the corresponding temperature, but when the composition of CO2in the gas mixture decreased below 35 mol %, the equilibrium pressure difference became larger, shifting to the high-pressure region. As expected, CO2and N2 molecules compete with each other for optimum oc-cupancy of the hydrate lattice. Accordingly, the equilibrium conditions for the mixed hydrate will be influenced by both the structure of the mixed hydrate and the distribution of guest molecules over the two types of cages. We used NMR spectroscopic analysis, a well-known method for identifying
FIGURE 1. Hydrate phase equilibria for ternary N2+ CO2+ water mixtures with different CO2compositions (10.0, 17.0, 35.0, and 50.0 mol %) in 30.0 nm silica gel pores.
the structural characteristics of gas hydrates (12), and direct gas release measurements were carried out to complement the NMR analysis. Two gas mixture compositions of 10.0 and 17.0 mol % CO2were especially chosen to form the mixed hydrate, the compositions being close to that of flue gas. The 13C CP NMR spectra obtained for mixed hydrate are shown in Figure 2 and are compared with that of a pure CO2hydrate. Figure 2a represents the NMR spectrum of pure CO2hydrate in silica gel pores. Since the 512cages of structure I hydrate have pseudospherical symmetry, the molecular motion is isotropic (13), and only a sharp line is observed at the isotropic chemical shift of 123.1 ppm. The broad powder pattern superimposed on the isotropic line represents the anisotropic motions of CO2molecules in 51262cages of structure I, which are known to be nonspherical (oblate spheroid). These NMR results are in good agreement with the other literature on the bulk hydrate (13, 14) and suggest that the structure of gas hydrate confined in silica gel pores is identical to that of the bulk hydrate. The13C NMR spectrum of mixed hydrate formed from 17.0 mol % CO2, with the balance N2gas, is shown in Figure 2b. The powder pattern reflecting the anisotropic
motion of CO2 molecules in asymmetric 51262 cages is observed in the range of 100.2-188.5 ppm; however, there is no clear isotropic line identifying CO2 molecules in pseudospherical 512cages. The chemical shift anisotropy could be defined as ∆ ) δisoδzz, where δisois the isotropic chemical shift and δzzis the zz component of the chemical
shift tensor; then the observed chemical shift anisotropy value is -55.3 ppm. This implies that the structure of the mixed hydrate is structure I and CO2molecules are distributed only in 51262 cages when the mixed hydrate is formed at a composition of 17.0 mol % CO2. Subsequently, the mixed hydrate was formed with 10 mol % CO2, the balance being N2, and the13C NMR spectrum was obtained. As evident in Figure 2c, the NMR spectrum again showed only the powder pattern without an isotropic line with chemical shift ani-sotropy of -42.2 ppm, suggesting that CO2 molecules primarily occupy the 51262cages of structure I when the mixed hydrate is formed in the range of 10-17 mol % CO2. Recent studies (15) with X-ray diffraction have shown that the mixed hydrate was structure II only below 1.0 mol % CO2. The present NMR approach provides valuable information on hydrate structure and the distribution of CO2molecules in the hydrate cages; however, it could not give the exact amount of CO2occupying the hydrate cages.
The direct measurement of the composition of gas released from mixed hydrate was carried out for various CO2 vapor compositions. Figure 3 represents the resulting CO2 compositions of the hydrate phase at the corresponding compositions of the vapor phase, and shows a trend of increasing CO2content in the hydrate with an increase of CO2in the vapor phase. From the NMR spectroscopy and powder XRD measurements for all the compositions of CO2 used to form mixed hydrate samples, the structure of the mixed hydrate was found to be structure I in gas mixtures containing more than 10 mol % CO2. Therefore, the distri-bution of CO2molecules in the cages could be evaluated using the ideal cage occupancies of N2and CO2molecules in 512 and 51262 cages (2N
2‚6CO2‚46H2O), resulting in a composition of the hydrate phase of 75.0 mol % CO2. At a low CO2concentration in the vapor phase of 3.8 mol % CO2, the amount of CO2occupying the hydrate cages is 15.2 mol % CO2. As the amount of CO2in the vapor phase increases to 34.8 mol % CO2, the CO2molecules occupy only part of the 51262cages and N
2molecules occupy the other 51262cages and most of the 512cages, from the fact that the composition of the hydrate appears to be 46.0, 60.0, and 73.0 mol % CO2 at corresponding gas compositions of 10.0, 17.0, and 34.8 mol % CO2, respectively, which are lower than that for ideal occupancies. However, above a concentration of 50 mol %
FIGURE 2. 13C CP NMR spectra at 243 K: (a) pure CO
2hydrate, (b) mixed N2+ CO2hydrate formed from 17 mol % CO2and the balance N2, (c) mixed N2+ CO2hydrate formed from 10 mol % CO2and the balance N2.
FIGURE 3. Pressure-composition diagram of the ternary N2+ CO2
+ water system measured at 272.1 K. The arrow traces conceptually the three-stage recovery process of CO2from a binary gas mixture.
CO2, the composition of hydrate appears to be 87.9, 92.5, and 96.0 mol % CO2at corresponding gas compositions of 50.6, 67.0, and 85.0 mol % CO2, respectively. This implies that CO2molecules occupy most of the 51262cages and even part of the 512cages of structure I. With increasing numbers of CO2 molecules in hydrate cages, the role of stabilizing both small and large cages was transformed from N2to CO2 molecules, which results in a decrease of the hydrate equilibrium pressure at the corresponding temperature as shown in Figure 1.
The cross-evaluation of the NMR spectroscopic analysis and the direct measurement of released gas provide the fundamental information for developing a CO2 recovery process from flue gas using hydrate formation and dissocia-tion in silica gel pores. The considerable enrichment of CO2 in the hydrate phase occurs for vapor compositions between 10.0 and 67.0 mol % CO2. When we formed mixed hydrate from 10.0 mol % CO2, the resulting concentration of CO2in the hydrate was 46.0 mol %. The gas mixture released from this hydrate can be used to form hydrate again, and following three cycles of formation and dissociation, a recovery of more than 96 mol % CO2in the gas mixture can be achieved, as illustrated in Figure 3.
Since silica gel consists of solid particles, it is easy to contain this material in every type of reactor where flue gas molecules can contact and react with water molecules contained in the pores. However, if hydrate formation and decomposition processes that need to take place in the pores are limited by slow kinetics, it would be a distinct disad-vantage for arriving at a viable process. To clarify this, we used1H NMR microimaging to monitor the conversion of water molecules to the hydrate phase.
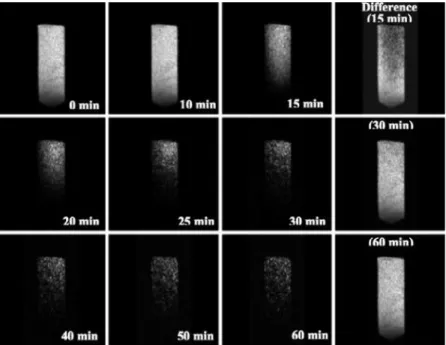
Figure 4 shows results of a microimaging experiment on CO2hydrate formation in silica gel pores. The first three columns in the figure show the proton density of mobile water (light areas) throughout the slice at the corresponding time intervals. The fourth column shows difference images obtained by subtracting images after the hydrate formation started from the image of water in silica gel before loading with CO2. In many instances the difference images give better contrast and allow for the detection of smaller variations in the intensity than can be observed in the direct images. A
higher intensity in the direct images corresponds to a higher proton density of the mobile (nonbound) water. Conversion of water into hydrate greatly reduces its mobility, shortening its spin-spin relaxation time and making it invisible in the images. After 10 min, the image shows silica gel saturated with water packed inside the high-pressure cell. As time progresses over 15 min, the area turning from light to dark corresponds to water converting to hydrate, with the as-sociated1H spin density disappearing from the images. The difference images (fourth column) allow the clear examina-tion of the actual changes with time. It should be noted that the formation of hydrate starts from the bottom of the cell and propagates to the top while upper region barely changes over the same time period. The reaction proceeds to almost complete conversion of water to hydrate in a time of 60 min. Since the intensity in the images is directly proportional to the density of mobile water, the degree of water conversion to hydrate can be found by integrating the images. This was done in five approximately equal regions arbitrarily selected throughout the slice, as shown in the inset of Figure 5. All integrals were consecutively normalized to the area of a selected region, and the time dependence of the integrated intensities for the images of CO2hydrate formation in a silica gel pore is shown in Figure 5. Fitting the experimental data with a single-exponential decay function, y ) y0+ A exp-(-k1x), provides a conversion rate constant of k1 ) 0.185 min-1(this value might be different from that obtained from the macroscopic measurements because of the intrinsic differences between the macroscopic and the microscopic observations), and the average conversion fraction of 84.1% varied from 80.7% to 87.3%. It is quite remarkable that 84.1% of water converted to hydrate within 1 h. Even more impressive is the fact that ∼90% of this yield was achieved after a reaction time of only 20 min. However, we do note that the kinetic rate averaged over the image should be the same as that measured by macroscopic methods such as gas uptake (21).
Recent reports on the kinetics of hydrate formation from ice powders showed 56-70% conversion of ice to hydrate for particles with a grain radius range of 38.5-250 µm at or near the melting point of ice (16, 17). Nearly complete conversion of ice to hydrate was obtained as the temperature of the
FIGURE 4. 1H microimaging data for CO
2hydrate formation in silica gel pores at 273 K and 32 bar. The first three columns show the proton density of the mobile water (light areas) throughout the slice at the time intervals indicated. The fourth column shows the difference images (light areas are hydrate) obtained by subtracting images after hydrate formation started from the image of water in silica gel before loading with CO2. The time indicated on the difference spectra refers to the start of conversion.
sample was cycled through the melting point of ice (18). A complete description of gas hydrate formation from ice powders is still lacking, but is assumed to be a multistage process. The initial stage is the growth of a hydrate film on the ice surface, which is followed by a much slower stage of hydrate growth limited by the gas/water mass transport through the hydrate shells (19). These studies showed ∼70% conversion normally in 15 h while the temperature was maintained and ∼98% conversion in at least 60 h with the temperature cycling method. In the work reported here, we produced CO2hydrate in ∼90% yield within 1 h. Two factors likely contribute to the much more rapid growth. First of all, the degree of dispersion of water is much greater in silica gel, as the average pore size is 15 nm. Also, the confined water does not seem to hinder gas transport. The water layer next to the pore walls generally is classified as surface water which does not undergo the usual freezing transition and is unlikely to participate easily in hydrate formation (20). Thus, it is likely that the formation process of hydrate in silica gel pores must be different from conversion of ice particles as described above. When hydrate formation proceeds inside pores, it is expected that these are filled with hydrate and bound water that does not participate in the formation of hydrate. CO2 molecules are transported from the gas phase and are able to diffuse into the pores through the layer of bound water to participate in the formation of hydrate. Additional experiments are still required to give a complete explanation of the hydrate formation mechanism in silica gel pores. The limiting factors are likely to be very different from those encountered in experiments that use bulk water in stirred reactors, or ice particles.
A further investigation of the effect of the experimental conditions such as temperature and pore size in the silica gel should allow an optimization of both conversion rate and total yield. The combination of thermodynamic analysis and NMR spectroscopy suggests that a higher concentration of CO2could be accommodated in hydrate cages by it being distributed over both 512and 51262cages. In addition, the microimaging study of hydrate formation in silica gel pores shows a fast conversion of water to hydrate with a high yield. On the basis of current experimental results, it is now clear that formation of hydrate in silica gel pores offers the fea-sibility of recovering CO2from flue gases emitted by power plants although the details of the process still need to be
optimized to give improved rates and higher yields. Above all, to meet the scale-up requirements, the hydrate formation reactor must provide enough contact time between the flue gas and silica gel containing water in its pores for formation of gas hydrate and needs to be designed so that the con-centrated gas can readily be collected after dissociation. One of the possible techniques proposed for the hydrate reactor might be a series of reactors for successive formation and dissociation processes. The flue gas is injected into the first reactor, conditioned for hydrate formation, and then con-tacted with water in the silica gel pores to form hydrate. After completion of hydrate formation, the first reactor conditions are changed to give an optimized dissociation process; however, the flue gas is conveyed to the second reactor where the process continues, now for the enriched gas. The required number of reactors is determined by the total volume of flue gas to be treated in a given time as well as the formation/ dissociation kinetic rates. Of course, besides these sufficient conditions, other important external process variables must be considered seriously for scale-up procedures.
Clearly, the processes described can be extended quite generally to the separation of other gas mixtures.
Acknowledgments
This work was supported by Energy Technology R&D funded by the Ministry of Commerce, Industry and Energy of Korea.
Literature Cited
(1) Sloan, E. D. Clathrate Hydrates of Natural Gas, 2nd ed.; Marcel Dekker: New York, 1998.
(2) Teng, H.; Yamasaki, A.; Chun, M. K.; Lee, H. Energy 1997, 22, 1111.
(3) Brewer, P. G.; Friederich, G.; Peltzer, E. T.; Orr, F. M., Jr. Science
1999, 284, 943.
(4) Jeffrey, G. A. Hydrate Inclusion Compounds, Comprehensive
Supramolecular Chemistry; Vol. 6.
(5) Uchida, T.; Takeya, S.; Kamata, Y.; Ikeda, I. Y.; Nagao, J.; Ebinuma, T.; Narita, H.; Zatsepina, O.; Buffett, B. A. J. Phys. Chem. B 2002,
106, 12426. Takeya S.; Hori, A.; Hondoh, T.; Uchida, T. J. Phys. Chem. B 2000, 104, 4164.
(6) Subramanian, S.; Sloan, E. D., Jr. J. Phys. Chem. B 2002, 106, 4348.
(7) Udachin, K. A.; Ratcliffe, C. I.; Ripmeester, J. A. Angew. Chem.,
Int. Ed. 2001, 40, 1303. Seo, Y.-T.; Lee, H.; Moudrakovski, I. L.;
Ripmeester, J. A. ChemPhysChem 2003, 4, 379. (8) Seo, Y.; Lee, H. J. Phys. Chem. B 2003, 107, 889. (9) Kang, S.-P.; Lee, H. Environ. Sci. Technol. 2000, 34, 4397. (10) Seo, Y.; Lee, H.; Uchida, T. Langmuir 2002, 18, 9164. (11) Uchida, T.; Ebinuma, T.; Takeya, S.; Nagano, J.; Narita, H. J.
Phys. Chem. B 2002, 106, 820.
(12) Ripmeester, J. A.; Ratcliffe, C. I. J. Phys. Chem. 1988, 92, 337. (13) Ripmeester, J. A.; Ratcliffe, C. I. Energy Fuels 1998, 12, 197. (14) Udachin, K. A.; Ratcliffe, C. I.; Ripmeester, J. A. J. Phys. Chem.
B 2001, 105, 4200.
(15) Seo, Y.-T.; Lee. H. J. Phys. Chem. B 2004, 108, 530.
(16) Stoykova, D. K.; Kuhs, W. F.; Salamatin, A. N.; Hansen, T. J.
Phys. Chem. B 2003, 107, 10299.
(17) Henning, R. W.; Schultz, A. J.; Thieu, V.; Halpern, Y. J. Phys.
Chem. A 2000, 104, 5066. Wang, X.; Schultz, A. J.; Halpern, Y. J. Phys. Chem. A 2002, 106, 7304.
(18) Circone, S.; Stern, L. A.; Kirby, S. H.; Durham, W. B.; Chakou-makos, B. C.; Rawn, C. J.; Rondinone, A. J.; Ishii, Y. J. Phys.
Chem. B 2003, 107, 5529.
(19) Moudrakovski, I. L.; Sanchez, A. A.; Ratcliffe, C. I.; Ripmeester, J. A. J. Phys. Chem. B 2001, 105, 12338.
(20) Handa, Y. P.; Zakrzewski, M.; Fairbridge, C. J. Phys. Chem. 1992,
96, 8594.
(21) Moudrakovski, I. L; McLaurin, G. E.; Ratcliffe, C. I.; Ripmeester, J. A. J. Phys. Chem. B 2004, 108, 17591.
Received for review May 17, 2004. Revised manuscript re-ceived November 23, 2004. Accepted November 24, 2004.
ES049269Z FIGURE 5. Time dependence of the integrated intensities of the
images of CO2hydrate formation in silica gel pores of nominal size,
15.0 nm at 273 K and 32 bar. The vertical scale is for the intensity normalized to the maximum intensity. Inset: An example of the selection of five integration regions in a microimaging slice.