HAL Id: pastel-00711971
https://pastel.archives-ouvertes.fr/pastel-00711971
Submitted on 26 Jun 2012HAL is a multi-disciplinary open access archive for the deposit and dissemination of sci-entific research documents, whether they are pub-lished or not. The documents may come from teaching and research institutions in France or abroad, or from public or private research centers.
L’archive ouverte pluridisciplinaire HAL, est destinée au dépôt et à la diffusion de documents scientifiques de niveau recherche, publiés ou non, émanant des établissements d’enseignement et de recherche français ou étrangers, des laboratoires publics ou privés.
The impacts of slum policies on households’ welfare: the
case of Medellin (Colombia) and Mumbai (India)
Paula Restrepo Cadavid
To cite this version:
Paula Restrepo Cadavid. The impacts of slum policies on households’ welfare: the case of Medellin (Colombia) and Mumbai (India). Economics and Finance. École Nationale Supérieure des Mines de Paris, 2011. English. �NNT : 2011ENMP0089�. �pastel-00711971�
N°: 2009 ENAM XXXX
MINES ParisTech CERNA
60 Boulevard Saint Michel 75272 Paris Cedex 06
Jury
M. Nicolas JACQUEMET, Maître de conférences, Université Paris 1 Panthéon - Paris School of Economics Président du Jury
M. Alan GILBERT, Professeur, Department of Geography, University College London Rapporteur
M. Pierre-Noël GIRAUD, Professeur, CERNA, Mines ParisTech Examinateur
M. Vincent RENARD, Professeur, Directeur de Recherche CNRS - IDDRI, Sciences-Po Examinateur
M. Harris SELOD, Professeur, Paris School of Economics - The World Bank Rapporteur
École doctorale n° 396 : Economie, organisation, société
Spécialité « Economie et finance »
présentée et soutenue publiquement par
Paula RESTREPO CADAVID
le 2 septembre 2011
The impacts of slum policies on households’ welfare: the case of
Medellin (Colombia) and Mumbai (India)
Doctorat ParisTech
T H È S E
pour obtenir le grade de docteur délivré par
l’École nationale supérieure des mines de Paris
Spécialité “ Economie et finance ”
Directeur de thèse : Pierre-Noël GIRAUD
T
H
È
S
E
ii
La réalisation de cette thèse a été rendue possible par le soutien financier de l‟Agence de l‟Environnement et de la Maîtrise de l‟Energie (ADEME) et du Conseil Français de l‟Energie (CFE).
This thesis was made possible through the financial support from l‟Agence de l‟Environnement et de la Maîtrise de l‟Energie (ADEME) and the Conseil Français de l‟Energie (CFE).
iv
Acknowledgments
I would like to express my gratitude to my supervisor, Pierre-Noël Giraud, who introduced me to this incredible subject and guided me through this adventure during the past three years.
I thank all the PhD and intern students at CERNA who made this journey much fun, especially Gabrielle Moineville, Justus Baron, Jan Eilhard, Michel Berthelemy and Fabienne Vuanda. I thank Sesaria Ferreira (Sesa) for making my ‗coffee-breaks‘ very entertaining and helping me tackle all administrative hurdles. I also thank Ian Cochran and Mathieu Sajout, who accompanied me through the WEC study and ‗groupe ville‟ meetings. I am grateful to Matthieu Glachant and Yann Menière for their support and guidance and their constant battle to make CERNA a better place to learn.
I would also like to thank Mr. Tragler and Del Desouza from the Slum Rehabilitation Society (SRS) in Mumbai for kindly welcoming me to their organization and guiding me through Mumbai slums. I especially thank the wonderful SRS Staff: Laksha (the Chai master), Archana, Pannika, Manohar, Ranjeeta and Sunita. I also thank Alexandra Janos and Shohei Nakamura, my co-volunteers at the SRS. I am very grateful to Del Desouza, who not only taught me a lot about her amazing country (India) but who taught me valuable life lessons of kindness and giving.
I thank the Mars Ltda. team who patiently worked with me preparing and conducting surveys in Mumbai slums, especially Raghu Roy, Sasmita Sahani and N. C. Patel. I thank Vaibhav Gandhi from the
Municipal Corporation of Greater Mumbai (MCGM), and Amita Bhide and RN Sharma from the Tata Institute of Social Sciences (TISS) for their invaluable suggestions. I thank Joel Ruet, who always had some thoughts to
share and some time to hear mine, during his two–day layovers in Paris between India and China.
I would also like to thank María Luisa Zapata of the ACI, Carmenza Barriga from the Medellin Solidaria program, Alexandra Peláez, sub-director of Metroinformación and Martha Ligia Restrepo of the DAP for providing me invaluable information; and the Gerencia de Moravia team for guiding me through the Moravia slum.
I would like to thank my family, who always supported my ideas and rarely questioned my choices; and P.A.T. who during these past three years became a part of it. Without their efforts and unconditional support during my years of studies, I would not have completed this PhD. I especially thank my sister who –from a couple of blocks away–was doing her own PhD in Jussieu. These past three years would have been much more boring without her daily company.
Finally, I am very grateful to all of the families who patiently welcomed me into their homes, those who gave me some of their sugary tea, coffee or cold drinks, and patiently responded to all of my sometimes–intimate questions. I thank you immensely for your kindness and hope that this thesis can somehow help to have a better understanding of your daily lives and the ways in which they can be improved.
vi
Contents
Preface ... xiv Introduction ... 1 1. Justification ... 1 2. Methodology... 43. Structure of the document ... 4
Chapter 1: The Challenge of Slums ... 7
1. Defining slums ... 7
2. Planet of slums ...11
3. From slum eviction to slum upgrading ...17
Part I: Understanding slum formation mechanisms Chapter 2: On the mechanisms of slum formation ... 23
1. General ideas ...23
2. Macro–analysis ...24
3. Economic Theory ...29
4. The link between slum formation and slum absorption policies ...35
5. The mechanisms of slum formation in Medellin (Colombia) and in Mumbai (India) ...37
Chapter 3: The inclusion of the informal city in the urban territory: a comparison between Medellin and Mumbai ... 39
1. Introduction ...40
2. Conceptual framework ...41
3. Urbanization and growth of the informal city ...43
4. Urban policies, inclusion policies and the informal city ...48
5. Social Urbanism vs. Urban Neoliberalism: two answers to a need for action ...52
6. Discussion and conclusions ...58
Chapter 4 : The informal rental housing market in Medellin: written versus oral contracts... 63
1. Introduction ...64
2. Medellin: violence, poverty and spatial inequalities...67
3. Data and methodology ...68
4. Results ...78
vii
Part II: The impacts of slum interventions on households' welfare
Chapter 5: Measuring the effects of slum policie ... 89
1. Introduction ...89
2. Methodological concerns for public policies evaluation ...90
3. Experimental and quasi–experimental approaches ...92
4. Examples of empirical studies of slum upgrading interventions ...98
5. The impacts of slum policies on households welfare: the case of Medellin (Colombia) and Mumbai (India) ... 100
Chapter 6: The effects of Urban Renewal Projects on the level of housing consolidation: the case of Medellin (Colombia) ... 103
1. Introduction ... 104
2. Urban Renewal in Medellin ... 106
3. Methodology... 111
4. Results ... 118
5. Conclusions ... 122
Chapter 7: The Slum Rehabilitation Scheme: What consequences at a city level? ... 129
1. Introduction ... 130
2. Mumbai, the Indian megapolis ... 132
3. Making Mumbai a slum-free city? ... 134
4. Density changes triggered by the SRS ... 139
5. Conclusions ... 143
Chapter 8: Moving in, Selling Out: The Outcomes of Slum Rehabilitation in Mumbai ... 145
1. Introduction ... 146
2. Slum Rehabilitation in Mumbai ... 148
3. Materials and methods ... 150
4. Evidences of residential mobility ... 152
5. Modeling and assessing the causes of moving out ... 154
6. Understanding the reasons for moving out ... 159
7. Conclusions ... 162
Chapter 9: The effects of the Slum Rehabilitation Scheme in Mumbai: on household access to credit and investment in housing ... 165
1. Literature review ... 166
2. Methodology... 168
3. Access to credit ... 168
4. Housing investments ... 171
viii
Chapter 10: The effects of the Slum Rehabilitation Scheme in Mumbai: on household access to
improved and modern basic services ... 175
1. Introduction ... 176
2. The Slum Rehabilitation Scheme ... 177
3. Improving access to modern basic services: formality moving in ... 179
4. Quality of service provision after the SRS: evidences of possible infrastructure bottlenecks ... 182
5. Conclusions ... 187
Conclusions and perspectives ... 190
1. Main results and policy implications... 191
2. Perspectives for future research ... 195
Annex: Summary statistics and other findings, Mumbai SRS Household Survey ... 197
ix
List of Figures
Introduction
Figure 1. Structure of the document ... 6
Chapter 1 Figure 1. London (Left, 1880) and Mumbai (Right, 2009) slums ... 8
Figure 2. Slum population by regions ... 12
Figure 3. Proportion of the urban population living in slums by regions ... 12
Figure 4. Slum indicators by regions in 2003 ... 14
Figure 5. Evolution of a selected number of slum indicators from 1990 to 2003 ... 15
Chapter 2 Figure 1. The mechanisms of slum formation – UN-Habitat ... 25
Figure 2. Rapid urbanization and slum growth ... 26
Figure 3. Slum growth and city population growth in Brazil (left) and slum growth and formal housing stock growth in Brazil (right) between 1980 and 2000 ... 27
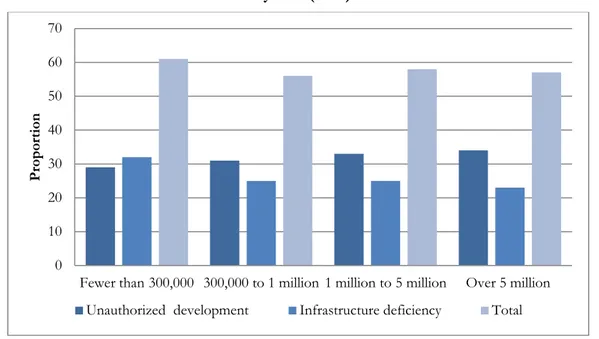
Figure 4. Proportion of unauthorized development or infrastructure deficiency according to city size (1993) ... 28
Figure 5. Proportion of the slum population to the total urban population and proportion of the urban population living in the capital city ... 28
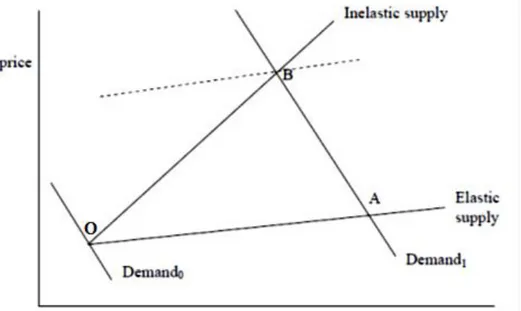
Figure 6. Modeling the effect of regulation on prices and supply ... 30
Chapter 3 Figure 1. The dynamics between urban policies, the formal and informal city, and inclusion policies ... 42
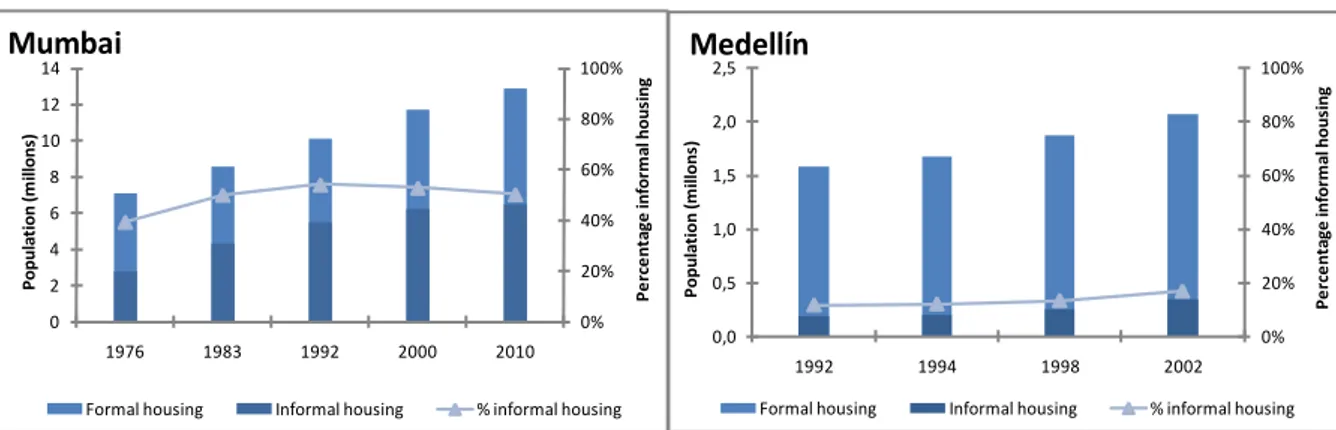
Figure 2. Growth of the formal and informal city in Mumbai and Medellin ... 45
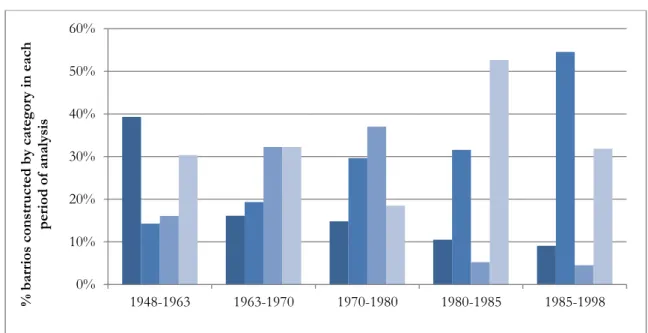
Figure 3. Percentage distribution of barrios by type of settlement in the city of Medellin from 1948 to 1998 ... 46
Figure 4. Distribution of informal settlements in Medellin (left) and Mumbai (right) ... 47
Figure 5. Financing mechanisms of the Mumbai SRS policy ... 57
Figure 6. Housing solutions constructed and proposed under SRS ... 58
Chapter 4 Figure 1. Tenure security of different tenure categories ... 66
Figure 2. Distribution of informal settlements in Medellin ... 68
Figure 3. Medellin Solidaria 2008 and 2009 cohorts ... 70
Figure 4. Spatial distribution of households with rental status according to rental arrangement, and spatial distribution of informal settlements in the city of Medellin ... 74
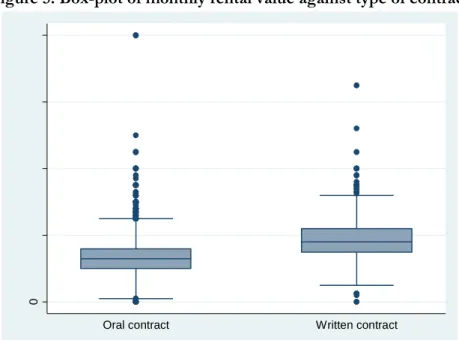
Figure 5. Box-plot of monthly rental value against type of contract ... 76
Figure 6. Box-plot of monthly income against type of contract ... 76
x Chapter 5
Figure 1. Comparison between Before–After (BA), Difference (D) and Difference–in–Difference
(DID) estimators ... 96
Chapter 6 Figure 1. Forms of land occupation in the Santa Cruz and Popular comunas ... 108
Figure 2. Comparison before and after the implementation of UIP (A) ... 110
Figure 3. Comparison before and after the implementation of UIP (B) ... 111
Figure 4. UIP direct area of intervention, UIP control and treated groups ... 116
Chapter 7 Figure 1. Greater Mumbai and its slum distribution ... 133
Figure 2. Slum Rehabilitation Scheme ... 136
Figure 3. Slum Rehabilitation Scheme and Relocation and Rehabilitation of Project Affected Households... 138
Figure 4. Slum Rehabilitation Scheme and Relocation and Rehabilitation of Project Affected Households... 140
Figure 5. Number of Projects Rehabilitated by Ward and Residential Prices (Rs/ sq.mt.)... 141
Figure 6. TDR Generation and Consumption by Ward ... 142
Chapter 8 Figure 1. Residential mobility before rehabilitation ... 154
Figure 2. Original occupants‟ destinations and newcomers‟ origins ... 161
Chapter 10 Figure 1. Time receiving water connection per day ... 183
Figure 2. Water treatment before consumption ... 184
Figure 3. Energy sources used for cooking ... 185
Annex Figure 1. Main income earner daily working hour‘s distribution ... 198
Figure 2. Total household income distribution ... 199
Figure 3. Expenditure by items (mean of percentage expenditure in each item) ... 200
xi
List of Tables
Chapter 1
Table 1. UN-Habitat definition of slums ... 9
Table 2. Issues covered in slum definition ... 10
Table 3. Evolution of slums policies ... 19
Chapter 2 Table 1. Theoretical slum formation models ... 35
Chapter 3 Table 1. Types and levels of informality ... 50
Table 2. Evolution of laws and policies ... 51
Table 3. Urban Integral Projects, UIPs (Proyectos Urbanos Integrales, PUI) ... 55
Table 4. Components of Urban Integral Interventions UIPs ... 56
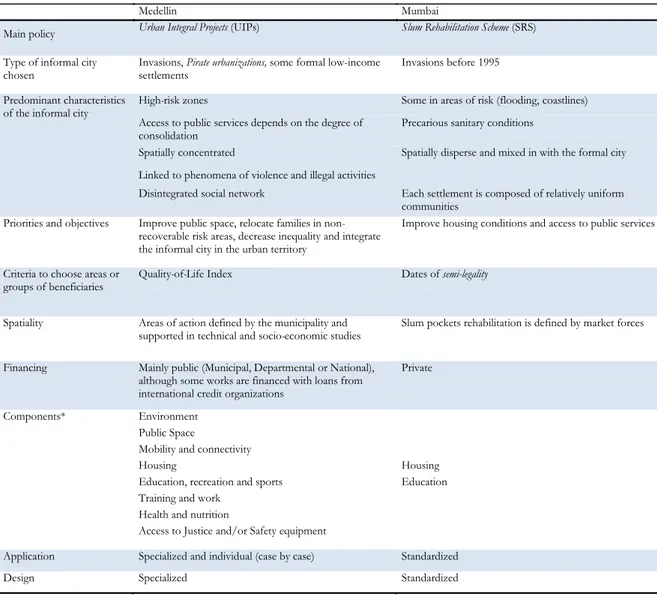
Table 5. The informal city and inclusion policies in Medellin and Mumbai ... 59
Chapter 4 Table 1. Variables used in the hedonic price regression ... 72
Table 2. Summary statistics ... 77
Table 3. OLS Results hedonic price models ... 79
Table 4. Contract clauses and expressed perception of risk ... 81
Table 5. Oral versus written contracts, general results ... 82
Chapter 5 Table 1. Literature review and analysis of relevant empirical studies related to slum or housing upgrading interventions. ... 99
Table 2. Methodologies used for the empirical analysis of the Slum Rehabilitation Scheme in Mumbai and Urban Renewal Intervention in Medellin ... 100
Chapter 6 Table 1. Criteria for the identification of treated and control groups or treatment ... 115
Table 2. Metrocable‘s effect on housing consolidation ... 118
Table 3. Metrocable‘s and UIP‘s effect on housing consolidation ... 120
Table 4. The effects of URP by tenure security and type of occupation–model [2b] ... 122
Table 5. Description of variables ... 124
Table 6. Summary statistics from the 2002-2003 SISBEN database ... 125
Table 7. Metrocable effects using distance to Metrocable line- model [1a] ... 126
Table 8. Metrocable effects for different values of dt‟ - model [1b] ... 126
Table 9.. The effects of URP by tenure security and type of occupation–model [2a] ... 126
Chapter 7 Table 1. General Information on the Slum Rehabilitation Scheme ... 135
xii Chapter 8
Table 1. Residential mobility post–rehabilitation ... 152
Table 2. Changes in housing attributes for treated group following SRS ... 156
Table 3. Differences in mean expenditure between control and treated households ... 157
Table 4. Housing valuation ... 159
Table 5. Original occupants & Newcomers ... 162
Chapter 9 Table 1. Reasons for not taking loans in the period of analysis ... 169
Table 2. Reasons for not taking loans in the period of analysis ... 169
Table 3. Reasons for not taking loans in the period of analysis ... 170
Table 4. Information required, average monthly interest rate and average amount granted by source of loan ... 171
Table 5. Housing investments ... 172
Chapter 10 Table 1. Slum housing deficiencies and SRS provision ... 179
Table 2. Improvement of access to basic services ... 182
Annex Table 1. Summary statistics ... 197
Table 2. All income members and main income members summary statistics ... 198
Table 3. Expenditure by items (mean of percentage expenditure in each item) ... 199
Table 4. Savings, durable goods and shortfalls ... 200
Table 5. Main reasons for moving to slum ... 201
Table 6. Satisfaction with rehabilitated apartments (only for treated) ... 201
Table 7. Satisfaction with rehabilitated tenements by item (most to least important) ... 201
Table 8. Dissatisfaction with rehabilitated tenements by item (most to least disliked) ... 202
Table 9. Satisfaction with the level of cleanliness of the neighborhood and perception of security in neighborhood ... 202
xiv
Preface
This dissertation deals with the evaluation of slum upgrading interventions in developing countries using two cases of studies: the Urban Integral Projects (UIP) in Medellin, Colombia; and the Slum Rehabilitation Scheme (SRS) in Mumbai, India. It contains seven different empirical papers organized in five chapters:
The inclusion of the informal city in the urban territory: a comparison between Medellin and Mumbai [Chapter 3], In Spanish: La inclusión de la ciudad informal en el territorio urbano: una comparación entre Medellín y Mumbai, 2010. Revise and resubmit at Ciudad y Territorio
The informal rental housing market in Medellin: written versus oral contracts [Chapter 4], 2011. CERNA Working Paper.
The effects of Urban Renewal Projects on the level of housing consolidation: the case of Medellin (Colombia) [Chapter 6], 2011. CERNA Working Paper.
The Slum Rehabilitation Scheme: What consequences at a city level? [Chapter 7], 2011. Jointly with Pierre-Noël Giraud. A part of this chapter has been published as: Mumbai, des droits de construire baladeurs au service du renouvellement urbain, Etudes foncières, numéro 150 Mars-Avril.
Moving in, selling out: the outcomes of slum rehabilitation in Mumbai [Chapter 8], 2010. Revise and resubmit at Urban Studies. Early drafts of this paper were presented at the International Conference on Applied Economics in Athens (August, 2010), Réseau d‟Economie et Développement Urbain Durable in Paris (Mai 2011) and in the ENHR conference entitled Mixité: an urban and housing issue? in Toulouse (July 2011)
The effects of the Slum Rehabilitation Scheme in Mumbai: on household access to credit and investment in housing [Chapter 9], 2011. CERNA Working Paper.
The effects of the Slum Rehabilitation Scheme in Mumbai: on household access to improved and modern basic services [Chapter 10], 2011. CERNA Working Paper.
1
Introduction
1. Justification
“There has been a recognition that effective approaches must go beyond addressing the specific problems of slums –whether they are inadequate housing, infrastructure or services– and must deal with the underlying causes of poverty” The Challenge of Slums, UN-Habitat (2003a)
In the past decades the world has continued its urbanization transition. Since the year 2008 half of the world‘s population lives in cities and by 2020, most of the world‘s demographic growth will be occurring in urban areas (UN-Habitat, 2009a). This recent rural–to–urban demographic transition is mostly occurring in developing countries and is being accompanied by an urbanization of poverty. The rural poor, seeking to improve their living conditions, are urbanizing more rapidly than the population in general. By 2035, as the urban share of the urban population is projected to reach 61%, the urban share of poverty will attain the 50% mark (Ravallion, 2001). Not only is most of this urban explosion occurring in developing countries, but about half of it is being absorbed by the informal–housing sector. Slums, favelas, chawls or informal settlements, in their very diverse forms, provide a ‗place to live‘ for those who are denied access to the formal city. In most cases entering the formal market supposes the compliance of construction standards or forced consumption of space and quality that is beyond the payment capacities of some of the population or is unconnected to their individual preferences.
While not all of the people living in slums are poor, most of the poor do live in slums. In light of this situation, slum policies play an important role in poverty–alleviation efforts at the local scale and at the national scale–as poverty becomes increasingly ‗urban‘. Unfortunately, slum policies have not always been articulated with poverty–reduction efforts. In the early 70‘s most local governments‘ implemented ‗eviction‘ policies, which resulted in the demolition of housing structures and expulsion of slum dwellers without any form of compensation. This type of
2
policies, while literally resulting in the elimination of slums in the very short term–as communities sometimes waited for the bulldozes to leave to start reconstructing their huts–lead principally to a further impoverishment of slum households that lost the little physical capital they had in a blink of an eye.
The international community has, however, come a long way from the time in which eviction was the main slum policy implemented. The ‗slum problem‘ has been recognized as one of the world‘s major development challenges and ‗friendlier‘ slum policies have emerged in many developing world cities. In 2000, the improvement of the lives of at least 100 million slum dwellers was set as one the Millennium Development Goals (MDG) targets to be achieved by the year 2015. However, the emergence of ‗friendlier‘ slum policies does not respond to a sudden change in the vision of slums, but is the result of a chain of events. On the one hand, local and national governments began moving away from policies that had proved to be inefficient and moved towards policies that seemed better. After years of implementation, most Site–and–Services programs were abandoned and replaced for titling and/or slum upgrading interventions. On the other hand, the ‗slum problem‘ began to be recognized by policy makers as a strategic component of cities‘ political economy. The inclusion of slum policies in the political agenda, depending on the proportion and rights of the slum population in question, allowed some political parties to access or remain in power. On many occasions, slum policies are designed to target specific areas of concern (i.e. violent favelas) or strategic zones important to the city‘s competiveness (i.e. airports, city centers). Because of this, poverty reduction is rarely set as the main objective of slum policies and, when occurring, is an indirect result of their application.
But how can slum policies affect households‘ welfare? Recent empirical studies have revealed how some slum policies might have substantial welfare gains while others can lead to a reinforcement of poverty. Field (2003, 2005, 2007) found a significant increase in housing investments, a reduction of fertility and an increase in the number of working hours of beneficiary households‘ in Peru, following a massive titling campaign. The indirect means which produced these results reveal the complexity of human behavior under insecure tenure rights. Fertility reduction was associated with the shift in bargaining power inside the household due to the inclusion of spouses‘ names in ownership documents. As women had on average, lower preferences for the number of children, titling leaded indirectly to a reduction in fertility. The increase in the number of working hours was explained through the reallocation of time previously used to ‗protect‘ dwellings–and the physical capital captured in them–to income– generating activities. On the contrary, an empirical study–which compared the welfare effects of two hypothetical slum improvement policies, in-situ upgrading versus upgrading and relocation–
3
suggested that when workplace location is held fixed–meaning that households conserve their initial jobs–relocation can be welfare reducing (Takeuchi et al. 2008).
This thesis focuses on two aspects within the vast field of policy evaluation. The first aspect, covered in Part I of this dissertation, comprehends an analysis of slum formation mechanisms in Medellin and Mumbai. The second aspect, covered here in Part II, comprehends the evaluation of the welfare effects of slum–upgrading intervention using two slum–upgrading interventions as cases of studies: the Urban Integral Projects (UIP) in Medellin, Colombia; and the Slum Rehabilitation Scheme (SRS) in Mumbai, India. The evaluation of these cases of study, as will be discussed in the Chapters following this introduction, is appealing given that both of these policies have been recognized by the international community as successful and have introduced substantial innovations in policy design. The Slum Rehabilitation Scheme (SRS) in Mumbai adapted the use of Additional Development Rights programs–previously used in developed countries to protect heritage buildings, avoid urban sprawl and create incentives to provide public goods- to reconstruct and rehabilitate slum settlements while shifting the burden of financing slum upgrading to the private sector. In Medellin, Urban Integral Projects (UIP) moved away from traditionally applied slum policies by concentrating on everything that is outside the house, instead of targeting one or more of the slum criteria defined by United Nations1. UIP, implemented in most marginalized areas of the city, involve, among others, the improvement of public amenities, neighborhood interconnectivity and mobility.
The purpose of this thesis is to try to go further and solve questions that remain unsolved in the literature related to slum policies, evaluate whether previous empirical findings are confirmed using different methodologies and analyzing different policy frameworks, and respond to specific research questions that are relevant to the local context of these two cities (i.e. stakeholders, policy‘s objectives). The set of questions touched upon in Part I and Part II of this dissertation includes the following: What are the magnitude and causes of post–rehabilitation residential mobility in Mumbai? What are the impacts of slum rehabilitation on households‘ access to credit and housing investments? What are the consequences–at the city level–of the Slum Rehabilitation Scheme on population density distribution? And, what are the effects of Urban Renewal Projects in Medellin on the level of housing consolidation?
1 A slum was defined by UN-Habitat (2009a) as an area that combines the following characteristics: inadequate access
to water, inadequate access to sanitation and other infrastructure, poor structural quality in housing, overcrowding and insecure residential status.
4
2. Methodology
Since the empirical methodology used to solve each of the questions addressed in this dissertation is different and is outlined in each of the Chapters following this introduction, only a general description of the main sources of information is presented here. For more information on the methodology used for each empirical analysis and a comparison to existent methodologies applied in literature, please refer to Chapter 5.
In the case of Mumbai, given the difficulties to obtain relevant information in order to answer the research question delimited, first–hand data was collected by the author in cooperation with an NGO (the Slum Rehabilitation Society) and a market research company that had previous experience working in slums (Mars Ltda.). A household survey was carried out in nine slum pockets, four of which had already been rehabilitated and five that had already started the rehabilitation administrative procedure, but were still slums. This first–hand data is used for the analysis of the household level impacts of slum rehabilitation in Mumbai in Chapter 8 and 9. For the analysis of the effects of slum rehabilitation at a city level, three different sources of information were used. The first corresponds to a database of all the SRS projects obtained from the Slum Rehabilitation Authority of Mumbai. The second corresponds to the ‗Transfer Development Rights‘ database obtained from the Municipal Corporation of Greater Mumbai and the third corresponds to the World Bank Transport and Urban Poverty Survey–which contained information on housing prices and surfaces–provided by the World Bank Washington.
In the case of Medellin, given the availability of good quality data at household level and the possibility of having access to it, no household survey was needed, although a number of informal meetings with the communities involved and other stakeholders were held. Household– level information was obtained from three secondary sources: the Quality of Life Survey (2004, 2005, 2006, 2007 & 2008), the Medellin Solidaria Survey (2008-2009) and SISBEN Surveys (2002, 2003, 2004, 2006 & 2010).
3. Structure of the document
This dissertation is organized in two parts (Part I and Part II) and ten Chapters. Figure 1 presents a graphic description of the dissertation structure. Preceding Part I is Chapter 1, which addresses issues that are essential for the comprehension of the context in which this thesis is placed, such as the definition of slums, the magnitude and recent evolution of slum settlements worldwide and a brief description of the historic evolution of slum policies. Part I entitled ‗Understanding slum formation mechanisms‟ is composed of three chapters. Chapter 2 presents the literature review on slum formation covering the most recurrent myths related to slum formation
5
and the most recent and relevant theoretical and empirical literature related to this subject. Chapter 3 presents a comparative analysis of slum formation and slum policies in Medellin and Mumbai. Chapter 4 evaluates the value that informal renters give to different rental contracts in the city of Medellin, using hedonic prices techniques.
The second part of this thesis (Part II) entitled ‗The impacts of slum interventions on households‟ welfare‟ is composed of five chapters. It covers an evaluation of the effects of two different urban renewal interventions in Medellin on housing investments and a set of studies on the effects of the Slum Rehabilitation Scheme in Mumbai at an individual scale and at the city scale. Chapter 5 presents a brief review of the available methodologies to evaluate slum interventions and relevant examples of slum policies evaluation. Chapter 6 focuses on the effects of Urban Renewal Projects on the level of housing consolidation in Medellin. Chapter 7 evaluates the achievements–in terms of slum absorption–of the Slum Rehabilitation Scheme and its consequences on population–density distribution at the city level. Chapter 8 deals with one of the possible indirect consequences of slum rehabilitation in Mumbai: policy–induced residential mobility. Chapter 9 seeks to evaluate one of the most recurrent myths associated to slum and titling policies: improvement in access to credit and evolution of housing investments. Chapter 10 evaluates if expected improvements in access to modern basic services of the SRS policy were translated into action. Following Chapter 10, general conclusions and perspectives are outlined. The Annex at the end of this dissertation contains a set of summary statistics, product of the SRS household survey that were not included in the other chapters dealing with the policy‘s impacts but that could be used in future publications
While all of the papers deal with very similar research topics, each paper puts forward distinct research question and can be read on its own.
6
Figure 1. Structure of the document
Conclusions and perspectives
Part II: The impact of slum interventions on households’ welfare
Chapter 5: Measuring the effects of slum policies
Chapter 6: The effects of Urban Renewal Projects on the level of housing consolidation: The case of Medellin (Colombia)
Chapter 7: The Slum Rehabilitation Scheme: what consequences at a city level? Chapter 8: Moving in, Selling Out: The Outcomes of Slum Rehabilitation in Mumbai
Chapter 9: The effects of the Slum Rehabilitation Scheme in Mumbai: on household access to credit and investment in housing
Chapter 10: The effects of the Slum Rehabilitation Scheme in Mumbai: on
household access to improved and modern basic services
Part I: Understanding slum formation mechanisms
Chapter 2: On the mechanisms of slum formation
Chapter 3: The inclusion of the informal city in the urban territory: a comparison between Medellin and Mumbai
Chapter 4: The informal rental housing market in Medellin: written versus oral contracts
Introduction
7
Chapter 1
The Challenge of Slums
11. Defining slums
Slums, favelas, bidonvilles, shantytowns, villas miseria, aashwa'i are all different names that describe one of the most common human settlements in developing cities: informal settlements. But what exactly are slums or informal settlements? The first known definition in the English language of the word slum appeared in the Vocabulary of Flash Language in 1812, where it is given as a synonym with ―racket‖ or ―criminal trade‖ (Davis, 2006). At this time slum settlements were associated with urban areas in which the poor lived under precarious sanitary conditions, an idea that is still very accurate to describe today‘s slums, but also referred to areas that concentrated a number of criminal activities. The stigmatization of slums as areas housing criminal populations persisted; in 1894, the US Department of Labor, in its survey entitled The Slums of Great Cities, defined slums as “areas of dirty back streets especially when inhabited by a squalid and criminal population” Davis (2006). Today the Merriam-Webster Dictionary defines slums as ―a densely populated usually urban area marked by crowding, dirty run-down housing, poverty, and social disorganization” (Webster, 2011). The last definition evidences how–despite having moved away from the criminal perception of slums–there are still a number of behavioral characteristics associated with slums (social disorganization).
London, Manhattan, Tokyo and many of today‘s world–class cities were littered with slums at the time of the Industrial Revolution and the beginning of the world‘s urbanization (WB, 2009a). In retrospect, the appearance of slums has almost always been linked to rapid urbanization rates and early processes of urbanization. This idea has led many to think that slums are a normal step in the urbanization process, and that a higher level of urbanization and economic growth will lead to the disappearance of slums in developing cities–as was the case of today‘s developed cities.
1 Expression borrowed from UN-Habitat(2003a) Global Report on Human Settlements 2003 : The Challenge of
8
Some theories of slum formation, including the link between rapid urbanization and slum proliferation, will be discussed in the next chapter. Figure 1 presents photographic evidence of the very similar conditions of the slums of London in 1880 and those in Mumbai today (2009).
Figure 1. London (Left, 1880) and Mumbai (Right, 2009) slums
Source: London (http://affordablehousinginstitute.org/blogs/us/2008/08/how-a-slum-dies-part-2-in-the-21st-century.html), Mumbai (Author‘s, Betwala Chawl)
While slums have been decorating urban areas for quite some time, it was only in 2003, with the publication of the UN-Habitat Global Report on Human Settlements, entitled The Challenge of Slums, that a more precise definition of the word slum was given. The lack of an agreed–upon definition, as explained in UN-Habitat (2003b), resulted in a lack of monitoring and reporting of slums conditions at the local and national level. Hoping to have a more universal and objective definition, an operational definition of slums, that accounted for the heterogeneity of informal settlements, was recommended by UN-Habitat in 2002. A slum was defined as an area that combines the following characteristics: inadequate access to water, inadequate access to sanitation and other infrastructure, poor structural quality in housing, overcrowding and insecure residential status. A slum household, as defined by the United Nations, is a group of individuals living under the same roof and lacking one or more of the following conditions: access to improved water, access to improved sanitation, sufficient living area, structural quality and durability of housing and security of tenure (UN-Habitat, 2009a). The first four criteria correspond to physical expressions of slums conditions (i.e. access to basic services, overcrowding and housing structure) however, the fifth, is related to the law or to the application of the law, which is more difficult to measure. A more detailed description of these indicators and their thresholds can be found in Table 1.
9
Table 1. UN-Habitat definition of slums
Characteristic Indicator Definition
Access to water Inadequate drinking water supply
A settlement has an inadequate drinking water supply if less than 50% of households have an improved water supply:
Household connection Access to public stand pipe Rainwater collection
With at least 20 liters/person/day available within an acceptable collection distance.
Access to sanitation Inadequate sanitation
A settlement has inadequate sanitation if less than 50% of households have improved sanitation:
Public sewer Septic tank Pour-flush latrine
Ventilated improved pit latrine
The excretal disposal system is considered adequate if it is private or shared by a maximum of two households.
Structural quality of housing
a. Location
Proportion of households residing on or near a hazardous site. The following locations should be considered as hazardous.
Housing in geologically hazardous zones (landslide/earthquake and flood areas)
Housing on or under garbage mountains Housing around areas of high industrial pollution
Housing around other unprotected high–risk zones (railroads, airports, energy transmission lines)
b. Permanency of structure
Proportion of households living in temporary and/or dilapidated structures. The following factors should be considered when placing a housing unit in these categories:
Quality of construction (materials used for wall, floor and roof) Compliance with local building codes, standards and bylaws
Overcrowding Overcrowding Proportion of households with more than two persons per room. The alternative is to set a minimum standard for floor area per person (i.e. 5 square meters)
Security of Tenure Security of tenure
Proportion of households with formal title deeds to both land and residence. Proportion of households with formal title deeds to either land or residence. Proportion of households with enforceable agreements or any document as
a proof of tenure.
Source: UN-Habitat (2003a)
Although the UN-Habitat definition identifies the most significant aspects of living conditions, it is, as in the case of most generalizations, incompatible with many of the local or national definitions of informal settlements. For instance, a household that complies with the UN definition of access to improved water could still be considered a slum by local authorities because it does not have a piped–water connection inside the dwelling. In Egypt, slums are known as aashwa'i, which literally means ―random‖ and correspond to deteriorated zones with little or no access to basic services (UN-habitat, 2003b)]. In India three slum definitions were retained for the 2001 census: all specific areas in a town or city notified as ‗slum‘ by state or local government, all areas recognized as ‗slum‘ by the state or local government, housing and slum boars, which may not have been formally notified as slum under any act; and a compact area of at least 300 population or about 60-70 households that live in in precarious constructions and
10
overpopulated dwellings, in unhealthy environments and have bad access to infrastructures (Government of India, 2001).
At the local level, slums are delimited along with national, regional or local definitions of minimum living standards, national laws and urban planning. For instance, zoning, construction and land regulations–which are generally defined locally–delimit what belongs to the planned city and what does not. In some occasions housing solutions located in zones, which are considered industrial according to Master Plans, could still be considered illegal or informal even when complying with construction standards. In the same way, at the national level, private property laws define the rights and duties accorded to private property and in some cases the available forms to enforce them. Table 2 presents some examples of the issues covered in the definition of slum in different cities, which reveal very different visions of slums. Cities like Abidjan and Beirut do not have any definition of slums, while cities like Bangkok delimit their definition of slum using health, crowding, environmental and crime indicators.
Table 2. Issues covered in slum definition
Source: UN-Habitat (2003a)
In the following sections I will briefly discuss the distribution, types and evolution of slums in developing countries. Since this subject has been treated widely in literature, I have favored a
No d efinit io n Co ns t ruct io n mat erials Temp o rary nat ure Co ns t ruct io n leg alit y Land leg alit y Healt h and hyg iene Bas ic
infras t ruct ure Infras t ruct ure Cro wd ing Po vert y Lo w inco me Enviro nment Co mp act nes s Crime and vio lence Ab d ijan X Ahmed ab ad X X X X X X Bang ko k X X X X Barcelo na X Beirut X Bo g o t á X X Cairo X X X X Cheng d u X Co lo mb o X X X X X X Durb an X X X Havana X X X X Ib ad an X X X X J akart a X X Karachi X Ko lkat a X X X X Lo s Ang eles X X X Lus aka X X X X M anila X X X X M exico Cit y X M o s co w X Nairo b i X X Nap les X Newark X Phno m Penh X X Quit o X X X Rab at -Salé X X Rio d e J aneiro X X X X X X São Paulo X X X X Syd ney X
11
more compact description of the challenge of slums that will help understand the context in which the research questions developed in this dissertation are situated. For a more detailed analysis, please refer to the bibliography mentioned, especially to UN-Habitat (2003a). In Section 2 a concise description of the state of the world‘s slums is presented along with an analysis of the evolution of slums indicators in a set of cities between 1993 and 2003. In Section 3 the evolution of the vision of slums and slum policies is presented.
2. Planet of slums
2Based on the slum definition previously discussed and a set of urban indicators, UN-Habitat estimated the slum population in 2001 at 924 million (UN-Habitat, 2003b). With most of the urbanization occurring in developing countries, between 2000 and 2010 the urban population in the developing world increased by an average of 58 million per year and the number of slum dwellers by 28 million per year; therefore, about half of the developing world‘s urbanization is being absorbed by the informal–housing sector (UN-Habitat, 2010). At this pace, projections suggest that the slum population will double its size to reach the two billion mark between 2030 and 2040 (UN, 2007). While, as previously discussed, these numbers might not correspond to the local or national definition of slums in most developing countries, they do serve to identify the extension of the population living with considerable shelter deprivations.
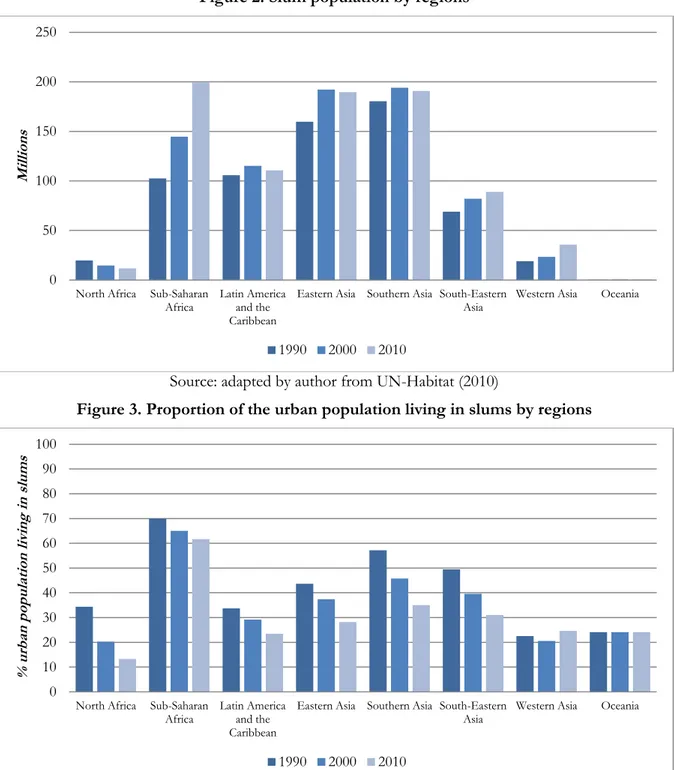
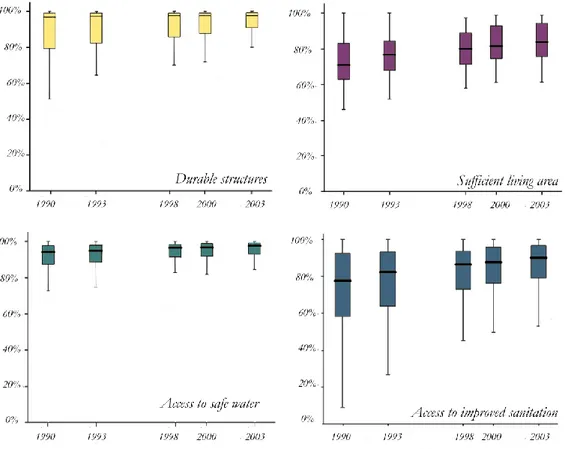
Declining proportions, increasing numbers
Figure 2 and Figure 3 present the distribution of slums by regions in 1990, 2000 and 2010. These figures reveal how the distribution of slums in the world has changed in the past two decades. In the early 1990s, it was Southern Asia followed by Eastern Asia that concentrated the highest numbers of slum dwellers in the world, having 180 and 159 million slums dwellers, respectively, but today it is Sub–Saharan Africa that is taking the lead. In fact, between 2000 and 2010 four of the world‘s developing regions achieved not only a reduction in the proportion of their urban population living in slums but also in the absolute number of slum dwellers. The most troubling trends are present in Sub–Saharan Africa, a region that has almost doubled its slum population in the past two decades, despite having a diminishing trend in relative values. In fact, in relative values, all of the regions except Western Asia presented a diminution in the proportion of households living in slums compared to the total urban population.
12
Figure 2. Slum population by regions
Source: adapted by author from UN-Habitat (2010)
Figure 3. Proportion of the urban population living in slums by regions
Source: adapted by author from UN-Habitat (2010)
According to UN–Habitat (2010), between 2000 and 2010 a total of 227 million people living in developing–world cities achieved substantial improvements in their quality of life and were no longer considered as living in slums. The latter means that governments have not only achieved the Millennium Development Goals (MDG) Target 11 (Goal 7)–which aimed at improving the lives of at least 100 slum dwellers by 2020–five years ahead of the MDG deadlines, but they have also managed to double the target. These figures certainly leave room for optimism but need to be considered carefully. While the proportion of slums to the total urban population is declining,
0 50 100 150 200 250
North Africa Sub-Saharan
Africa Latin America and the Caribbean
Eastern Asia Southern Asia South-Eastern
Asia Western Asia Oceania
Mi lli ons 1990 2000 2010 0 10 20 30 40 50 60 70 80 90 100
North Africa Sub-Saharan
Africa Latin America and the Caribbean
Eastern Asia Southern Asia South-Eastern
Asia Western Asia Oceania
% ur ba n pop ul ation livin g in s lu ms 1990 2000 2010
13
the number of slum dwellers worldwide continues to grow and trends diverge from one region to another and between regions. China, India, Indonesia, Brazil and Colombia are among the most successful countries, achieving together the improvement of the living conditions of around 160 million slum dwellers. On the contrary in countries like Benin, Ethiopia, Zimbabwe and Malawi, slum prevalence remains very high and the slum population continues to increase (UN-Habitat, 2010). Furthermore, the 100 million slum dwellers‘ target set in 2000 for the MDG was selected as a symbolic number. At this time no accurate global estimates of the magnitude of slums existed, and it was only in 2002 that the first estimations of the ‗slum problem‘ appeared based on the five criteria previously discussed.
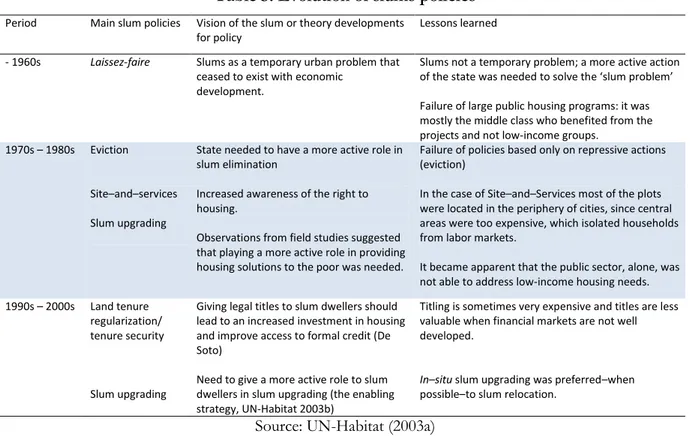
Trends in urban and slum indicators 1990–20033
This sub-section is based on a study done by Martinez et al. (2008) examining the evolution of multiple shelter and slum indicators in 188 cities belonging to eight different regions. Their analysis is based on the UN–Habitat Global Urban Indicators Database (GUID). Of the five UN–Habitat indicators to evaluate shelter deprivations and identify slums (see Table 1), only four are studied due to information constraints: durable structures, sufficient living area, access to safe water and access to improve sanitation. The indicator which refers to security of tenure was not analyzed since no data on tenure were included in the GUID. Results from their analysis are presented in Figure 4 and Figure 5.
Figure 4 presents four box-plots graphics for the indicators studied by regions in 20034. It reveals considerable variations in shelter deprivation between and within regions, which confirm the notion that slums are very heterogeneous. Cities in Sub-Saharan Africa are worse off in all of the indicators when compared to the rest of the regions. A comparison of regional medians for the durable structures indicator suggest that in 2003 there was a relatively high proportion of households living in durable structures, with Sub-Saharan Africa being the exception. The durable structure box–plot also indicates considerable variations within regions, especially in the
3 This sub-section draws heavily from Martínez et al. (2008)
4 The box-plot presented in Figure 4 and Figure 5 are standard box-plots in which the line in the middle of the box
correspond to the median, the lower and upper hinges of the box to the 25th and 75th percentiles respectively, the upper and lower line to the upper and lower adjacent value and the dots outside the lines or whiskers to outside values.
14
Commonwealth of Independent States (CIS) Asia, Southern Asia and Sub-Saharan Africa. The biggest variation between regions, among all indicators, is for sufficient living area and access to improved sanitation.
Figure 4. Slum indicators by regions in 2003
Source: adapted by author from Martinez et al. (2008)
Figure 5 presents the evolution of each of the studied indicators from 1990 to 2003, with all of the merged data from the regions. In all of the indicators there is a visible improvement of shelter deprivations, with median values increasing and variance decreasing. However, improvement in access to safe water and access to improved sanitation, as explained by Martinez et al. (2008), are largely being made through the use of alternative water provision and sanitation forms. When comparing access to safe water indicators to access to piped water indicators, they found that although the median access to safe water was above the 90% threshold for all the period of analysis, the median connection to piped water fluctuated between 56% and 65% in the same period.
While the evaluation of shelter deprivations in developing–world cities based on the GUID made by Martinez et al. (2008) is probably one of the most relevant studies carried out at a global level containing city-level data, it is important to consider these results carefully. First, because
15
not all of the information needed was available for each of the cities and for each year of analysis. If data availability is somehow correlated to the country‘s level of development or to the level of shelter deprivation, the analysis presented might lead to a more optimistic scenario of developing cities conditions. Second, the missing indicator, tenure security, is one of–if not the most– important indicators related to slums. For instance, it is possible that some of the improvements observed in access to basic services are explained by an improvement in households‘ security of tenure; as in many cases, local governments are unwilling to provide basic services to informal settlements, and formalization precedes the arrival of services. Finally, although the shelter indicators used are related to slum characteristics as defined by UN-Habitat, they are aggregated at a city level, which is useful to compare cities but confusing to evaluate the state of the world‘s slums and their evolution in time. Why? Because, it is possible that a given city–which has a small slum population–has very low shelter deprivations, which improve in time in formal areas, and very high shelter deprivations, which worsen in time in informal settlements; an aggregated indicator will give the idea of improving shelter deprivations but the situation underlying this ―improvement‖ is one of increasing spatial inequalities. One example of this situation, using aggregated indicators at different levels inside the same urban area (Medellin) is presented in Box 1.
Figure 5. Evolution of a selected number of slum indicators from 1990 to 2003
16
Slums and poverty
“Slums and poverty are closely related and mutually reinforcing, but the relationship is not always direct or simple.” UN–Habitat, 2003a5
Two phenomena related to today‘s urbanization have led to an increased concentration of the poor in urban areas. The first, introduced by Ravallion (2001) who studied cross-sectional data for 39 countries, suggest that the poor are urbanizing more rapidly than the population as a whole, which might lead to a shift in the rural–urban composition of poverty and a higher spatial concentration of the poor in cities. The second, studied by Fay and Opal (2000), suggests that the urbanization process occurring in developing countries is not always coupled with economic growth. In their study, out of 187 countries reporting annual negative growth over a period of five years, 183 experienced positive urbanization rates. As a large number of the world‘s rural population continues to shift to urban areas, the distribution of the poor among rural and urban areas is changing and poverty–reduction efforts need to account for these phenomena.
5 pp. XXVI
Box 1. Spatial concentration of shelter deprivations: the case of Medellin
In the following table I present an example of the spatial concentration of shelter deprivation in slums, using as an example a slum settlement in the city of Medellin. In it I compare a set of selected indicators at the city level (Medellin), at the district level (Comuna 4) and at the slum level (Moravia). The Moravia slum is located in the Comuna 4, which is a poor neighborhood centrally located in the city of Medellin. While all of the shelter indicators aggregated at a city level give a very positive idea of living conditions in the city, the reality is very different when looking at the shelter deprivation in the scale of the Moravia settlement. For instance, while the city of Medellin only has around 1.73% of its families living in houses with non– consolidated walls, this proportion rises to 2.46% in the Comuna 4 and to 7.72 % in the Moravia settlement.
Selected Indicators and general information Medellín Comuna 4 (District) Moravia (slum) Number of inhabitants 2,228,630 166,876 29,713 Number of dwellings 560,338 38,815 5,970 Number of families 564,785 39,555 6,280
Average household size 3.90 3.96 4.18
Average families per house 1.01 1.02 1.05
% dwellings with non-consolidated floor 0.99% 1.39% 4.88% % dwellings with non-consolidated walls 1.73% 2.46% 7.72% % dwellings without toilets inside house 0.64% 1.52% 3.88% Average number of members per room (sleep) 1.23 1.30 2.08 % non-livable dwellings (dangerous living conditions) 8.73% 19.01% 61.51%
17
Baker‘s study (2008) on urban poverty suggests that, while the characteristics of the urban poor change between and across regions and cities, they all tend to face a number of deprivations, which affect their daily lives: limited access to the labor market, inadequate and insecure living conditions, poor infrastructure and services, risk of natural disasters and environmental hazards and spatial exclusion. Most of these deprivations correspond to the idea or definition of slums presented in the previous section. In the same way, the latest UN–Habitat (2010) report on the State of the World Cities, argues that many of the slums are spatially isolated and disconnected from the rest of the city making it difficult for their inhabitants to access the city‘s labor market and profit from the advantages of living in the city. The physical and social exclusion of many of the poor in some areas could lead to spatial poverty traps. An example of the spatial concentration of shelter deprivations can be found in Box 1.
Slums are for many the urban manifestation of poverty. However, while slums do house the greatest proportion of the urban poor, not all of the poor live in slums and not all of those who live in slums are poor. Nevertheless, with the increased urbanization of the poor and the concentration of poverty in slums, slum policies are increasingly being viewed as a way to diminish poverty. UN–Habitat (2010) states that “Progress in improving the lives of slum dwellers will depend largely on the way governments address slums as part of the broader agenda of reducing urban poverty and inequality”6. In the same way The World Bank (2009) argues that “as urban poverty increases, the focus is shifting from villages to slums”. The higher spatial concentration of the poor in cities, and in slums, calls, on the one hand, for a higher integration of slum policies and poverty reduction efforts and, on the other hand, for a higher understanding of how slum policies can improve welfare.
3. From slum eviction to slum upgrading
7“Un milliard de personnes survivent dans les bidonvilles du monde, lieux de reproduction de la misère, à laquelle les gouvernements n'apportent aucune réponse adaptée » Mike Davis, 2006
“Les villes du Tiers monde ne souffrent pas tant d‟un manque drastique d‟investissement et d‟emplois que d‟une pénurie artificielle de droits de propriété”. Hernando De Soto, 1990
Two authors have considerably influenced the general public view of the ‗slum problem‘ in developing countries. The first, Mike Davis, in his book entitled Planet of Slums, describes slums as the catastrophic result of bad policies and bad institutions and leaves the reader with the idea that little has been done. The second, Hernando De Soto, describes slums as lands of opportunities and suggests that titling policies are the key to include poor households in the economic system.
6 p. 49 (Section 1)
18
While it is true that initially applied slum policies had catastrophic consequences on slum dwellers‘ welfare, today‘s policies have integrated more welfare–improving approaches, which serve both to combat the ‗slum problem‘ and reduce poverty. The latter does not mean that there has been a complete shift from one policy to another or that a one–fits–all policy (i.e. titling) has emerged; rather, there has been a general shift of the vision of slums and of the ―efficiency‖ of a set of policies as the learning–by–doing process evolved and governments or political parties realized that ‗slums‘ could make part of their strategies to access or remain in power.
Table 3 presents predominant slum policies at different time periods, the theory or hypothesis that supported them and some of the lessons learned after years of implementation. Before the 1970s the main policy–the laissez-faire policy–consisted of ignoring slum settlements. Governments, based on observation of developing cities, considered slums a temporary problem related to rapid rural–to–urban migration that cease to exist with economic growth (UN-Habitat, 2003a). Slums were usually absent from city maps and master plans8. Many governments preferred to implement heavily subsidized social housing schemes for the poor rather than improving living conditions in slums. In the 1970s and 1980s governments decided to implement more ‗active‘ policies, as they realized that slums were more permanent than previously thought. Eviction was generalized under the argument of urban renewals, large infrastructure projects, slum criminalization or enforcement of illegal encroaching. In many cases eviction was made without notice with the help of policemen who evacuated slum dwellers, followed by bulldozers that demolished housing structures. As explained by UN-Habitat (2003a) “this approach did not solve the problem of slums: instead, it shifted them to the periphery of the cities–to rural urban fringes–where access to land was easier and planning control non-existent”9.
In the late 1970s and early 1980s, a new set of policies emerged supported on the recognition of the poor to build their own homes and following the failure of both public housing schemes and eviction policies. A study made by John Turner and Robert Fichter (1972) entitled Freedom to Build advocated a more active enrollment of the poor in improving their housing situations (Buckley and Kalarickal, 2006). The World Bank was one of the leading institutions that supported this type of approach, on occasions, by directly financing Site–and–Services projects. Between 1972 and 1986, 71% of the World Bank‘s shelter projects were related to Site–and– Services and slum upgrading, a proportion that decreased to 15% in the 1987–2005 period. In Site–and–Services projects, usually, a plot of land and basic infrastructure (the provision varied
8 This is still the case for many of today‘s slums. 9 pp. 130
19
from one project to another) was given to poor households. In some cases, credits or subsidies were given to households to buy materials, leaving the freedom to build to households.
Table 3. Evolution of slums policies
Period Main slum policies Vision of the slum or theory developments for policy
Lessons learned - 1960s Laissez-faire Slums as a temporary urban problem that
ceased to exist with economic development.
Slums not a temporary problem; a more active action of the state was needed to solve the ‘slum problem’ Failure of large public housing programs: it was mostly the middle class who benefited from the projects and not low-income groups.
1970s – 1980s Eviction State needed to have a more active role in slum elimination
Failure of policies based only on repressive actions (eviction)
Site–and–services Slum upgrading
Increased awareness of the right to housing.
Observations from field studies suggested that playing a more active role in providing housing solutions to the poor was needed.
In the case of Site–and–Services most of the plots were located in the periphery of cities, since central areas were too expensive, which isolated households from labor markets.
It became apparent that the public sector, alone, was not able to address low-income housing needs. 1990s – 2000s Land tenure
regularization/ tenure security
Slum upgrading
Giving legal titles to slum dwellers should lead to an increased investment in housing and improve access to formal credit (De Soto)
Need to give a more active role to slum dwellers in slum upgrading (the enabling strategy, UN-Habitat 2003b)
Titling is sometimes very expensive and titles are less valuable when financial markets are not well developed.
In–situ slum upgrading was preferred–when
possible–to slum relocation.
Source: UN-Habitat (2003a)
Since the mid-1990s most slum policies have focused on slum upgrading–either through resettlement or in–situ upgrading–and land tenure regularization–largely lead by the theory developed by Hernando De Soto (1990, 2000). Slum–upgrading projects generally involved the improvement of one or more of a slum‘s shelter deprivations; some provide slums with basic services and titles, while others involve a complete reconstruction of the slum. Land tenure regularization, on the other hand, is designed to provide only legal titles to slum dwellers but is intended to have indirect effects on housing structures. The theory developed by De Soto (1990, 2000), suggested that housing investments in informal settlements were low, given households‘ insecure tenure and the possible and palpable risk of eviction without any form of compensation. Once households have legal tenure, their investment behavior is expected to change given the reduction of risk of eviction and a higher access to credit, both of which might lead to an improvement of housing structures.
These two policies have, however, suffered a considerable transformation throughout the past two decades. In the case of slum upgrading, the in–situ slum upgrading option has emerged as the better choice when compared to slum upgrading and relocation10, as the latter
has proven to have a set of negative consequences on household‘s welfare. UN-Habitat (2003a)
20
argues that “At worst, resettlement is little better than force eviction with no attempt at consultation or consideration of the social and economic consequences of moving people to distant, often peripheral, sites with no access to urban infrastructure, services or transport”11.
In the case of land tenure regularization, it has become apparent that an improvement in tenure security, not necessarily through the provision of legal titles, is sometimes more adequate. In some cases, where cadastre systems are not well developed, titling policies can be very costly and time consuming and when financial markets are not well developed, the expected benefits of titling–as expected by De Soto–might be lower. According to Buckley and Kalarickal (2006) one of the lessons learned from years of titling policies is that legal tenure is not the most important first step to take in many places. Furthermore, a number of empirical and theoretical studies (Razzaz 1993, Gilbert 2002, Payne 2001, Van Gelder 2007 and Reerink and Van Gelder 2010) suggest that legal titles are not the only way to improve a household‘s conditions and that intermediate or semi–legal forms of tenure can also be beneficial. According to Payne (2001), alternative tenure forms–such as registered leasehold or public rental in which households are not the legal owners but do not face a constant threat of eviction–might also lead to an increase of investments in housing.
Today, a very diverse group of slum policies are being implemented in the world‘s slums. Some countries–like Peru–continue to lead large titling policies at the national level while other countries–like Brazil–have introduced multiple policies that range from legalizing electricity in informal settlement to establishing Special Social–Interest Zones in which land regulations are relaxed for the development of low–income housing. While years of slum–policy implementation have left the international community with a number of lessons, most of today‘s policies are being designed to solve specific shelter deprivations and are a highly connected to a city‘s or country‘s political economy. The following chapter, Chapter 2, concerns the analysis of the mechanisms of slum formation. In Chapter 3 a discussion, very similar to the one carried out in this chapter but using the two specific cases of studies, Medellin and Mumbai, is made in which the definitions and evolution of slums and slum policies at the local scale are presented.
21