HAL Id: hal-00736720
https://hal.archives-ouvertes.fr/hal-00736720
Submitted on 28 Sep 2012
HAL is a multi-disciplinary open access
archive for the deposit and dissemination of
sci-entific research documents, whether they are
pub-lished or not. The documents may come from
teaching and research institutions in France or
abroad, or from public or private research centers.
L’archive ouverte pluridisciplinaire HAL, est
destinée au dépôt et à la diffusion de documents
scientifiques de niveau recherche, publiés ou non,
émanant des établissements d’enseignement et de
recherche français ou étrangers, des laboratoires
publics ou privés.
On the opportunistic use of geostationary satellite
signals to estimate rain rate in the purpose of radar
calibration
Laurent Barthès, Cécile Mallet
To cite this version:
Laurent Barthès, Cécile Mallet. On the opportunistic use of geostationary satellite signals to estimate
rain rate in the purpose of radar calibration. ERAD 2012, 7th European Conference on Radar in
Meteorology and Hydrology, Jun 2012, Toulouse, France. 6 pp. �hal-00736720�
On the opportunistic use of geostationary satellite
signals to estimate rain rate in the purpose of radar
calibration
Laurent Barthès1, Cécile Mallet1
1
LATMOS, 11 boulevard d’Alembert, 78280 Guyancourt, France
Laurent.barthes@latmos.ipsl.fr, cecile.mallet@latmos.ipsl.fr 15 April 2012
Rain gauge networks are often used for radar calibration. However, the deployment of such networks is relatively complex and expensive. The present study deals with the development of a new low cost microwave device devoted to radar calibration. The principle of this device is to use rain atmospheric attenuation along microwave links to deduce the path averaged rain rate. In order to perform a feasibility study of such a device, a measurement campaign is performed for two years near Paris. Measurements of atmospheric attenuation over an earth-space link have been carried out by receiving TV channels from different geostationary satellites in Ku-band. These links are characterized by an aperture angle of 2° and a 30° elevation angle corresponding more or less to a 6 km path length through troposphere. The aim of this paper is to propose an algorithm to retrieve rain rate from the measured signal and to quantify the expected averaged rain rate accuracy along the earth-space link. In practice, the received signal is sensitive to rain as well as to many other fluctuations due to atmospheric scintillations, clouds, water vapor, small changes in the satellite orbit, power fluctuations.
1. Introduction
This study investigates a new inexpensive microwave system to observe rain at medium spatial resolution and at high temporal resolution. Working with operational telecommunication point-to-point microwave links, Messer et al. (2006) and Leijnse et al. (2007) have shown that the path-integrated rain rate can be estimated from attenuation measurements. However ground based microwave link attenuation are provided by telecom operator, which leads to many practical constraints. Furthermore this kind of data is mainly available in urban area. So as to observe rain at an intermediate resolution between radar and rain gauges, we are currently developing a new low cost microwave device. The present study works with operational telecommunication earth to satellite microwave link (Maitra 2007). We test the ability of a very simple passive low cost microwave receiver to measure the atmospheric attenuation due to rain and thus to estimate the path-integrated rain rate.
Much of the more than two hundred satellites, deployed by broadcast or telecommunication companies, that orbit the earth, emit a relatively strong microwave signal towards the earth. They cover almost the entire globe and are located in geostationary orbit. They use microwave frequencies bands, most of them work in the Ku band (10-12 GHz).
We investigate an opportunistic use of these microwave sources to measure rainfall. We have developed a ground microwave system able to estimate atmospheric attenuation along microwave links to deduce the path averaged rain rate. The paper will investigate how to retrieve path-average rain rate from attenuation measurements obtained in the Ku band. The proposed microwave system is validated with a measurement campaign we have performed to allow comparison with other collocated rain observations (weather radar, rain gauges).
In practice, the proposed device only measures a received power. As the satellite’s transmission power is not exactly known the difficulty lies in the fact that the reference level, relative to which the rain attenuation is computed, is not exactly known either. A critical issue in our approach is thus the ability to distinguish the signal variations due to rainfall from the variations occurring during dry periods. In the fact, the reference level (received signal during dry periods) is not constant over time and fluctuates due to changes in water vapour concentration, cloud water content, emitted power, and temperature.
2. Physical context
Attenuation is the main propagation effect concerning satellite links operated in the microwave range. This phenomenon is due to several types of atmospheric components: gases, clouds and rain (Ulaby, 1981). Each of these components behaves quite differently, when considered in terms of its temporal and spatial variability.
Rain-induced attenuation increases with rainfall rate, it depends mainly on the shape and size distribution profile of the raindrops. The rain rate varies noticeably in space and time, and thus leads to particularly dynamic properties in the propagation channel. Because raindrops are larger than drops in clouds, ignoring scattering effects of rain in favor of absorption is valid only over a limited range of rain-rate and frequency combination. So, scattering effects are taken into account in the simulation that we have performed for this study. If we consider that a vertical profile of rain as a single layer of rain of equivalent height H and equivalent drop size distribution Ne (D) [m-4], defined by:
∫
= H e N D z dz H D N 0 ) , ( 1 ) (were N (D, z) [m-4] is the rain drop size distribution present in the atmosphere at height z, We can express the equivalent specific attenuation at frequency f and polarization p (p=H or p=V corresponds to horizontal or vertical polarization respectively):
where [m2] is the extinction cross-section for a raindrop of diameter D [m] and angle of elevation θ. The rain attenuation [dB] for an elevation angle θ is thus directly obtained by:
(1)
The following empirical relation between the specific attenuation and rain rate is often used: kefp=af R bf (2)
This expression is shown to be an approximation, except in the low frequency and optical limits [Olsen 1978]. Except in the optical limit, af and bf cannot be independent of R and for a given frequency they depend on drop size distribution, and
temperature. In this study the following values af=0.018 and bf=1.21 (Recommendation ITU-R P.838-3) are used.
3. Experimental Setup
The experimental system (hereafter KU device) was set up at the LATMOS (Laboratoire Atmosphères, Milieux, Observations Spatiales) near Paris, France during the summer and autumn 2010. Ku-band signals between 10.7 and 12.7 GHz from four geostationary satellites (NSS7, AB1, Thor 5/6, Hotbird 6/8/9) have been received in horizontal polarization with a multifocus dish antenna of 90 cm diameter. The elevation θ of the link path is closed to 30°.
The performance of the proposed Ku device is investigated by comparing the estimated values of rain rates with independent co-located observations: near-by C-band weather radar rain-rate maps provided by Météo France and two rain gauges located at Trappes and Toussus le Noble (The distances between the LATMOS and these places are respectively 2.9 and 3.7 km) . Fig. 1 shows the different locations and the directions of the four earth-satellites links (blue lines). Finally, our dataset is composed of:
- 8 time series of received signal
P
RECch(t
)
with ch from 1 to 8 (4 satellites and 2 channels by for each satellite) with a 10 seconds sampling resolution.- 2 hourly accumulated rainfall time series RRG1(t) and RRG2(t) obtained with the two rain gauges
-20 000 radar rain rate maps Rrad(t) (Tabary 2007) with a spatial resolution of 1×1 km2 and temporal resolution of 5 min. The period considered covers most of the rainfall events from 23 July to 15 December 2010.
Fig.1 Locations of the different sites and satellites azimuths
In this first feasibility study, each of the 8 available channels is used independently. Channel 1 is used for the development of algorithms (see section 4), thus seven different values of rain rate are then estimated from other channels. As results obtained with each of the seven remaining channels are similar, only those obtained with channel 7 are presented in section 5.
Since microwave links provide path integrated measurements, the corresponding radar path averaged rain rate values are calculated by averaging the radar pixels crossed by the link beam with weights given by the length of the link in each pixel.
)
(
θ
fpke
∫
= max min ) , ( ) ( 4343 ) ( D D fp e fp N D D dD ke ext θ σ θ ) , (θ
σ
D ext fp)
(
θ
fpA
) ( ) cos( ) (θ
θ
θ
fp fp ke H A = 100 200 300 400 500 600 700 800 900 1000 1100 100 200 300 400 500 600 700 800Times series
R
chrad(t
)
with ch from 1 to 8 were computed with a 5 min temporal resolution representing path averaged rainrates on each earth-satellite links according to radar measurements.
Concerning rain gauges we simply averaged the two time series RRG1(t) and RRG2(t) to obtain
R
RG(t
)
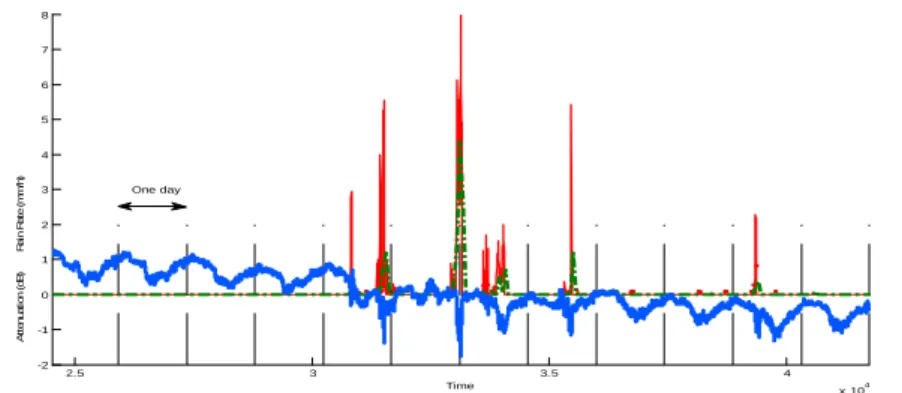
. Figure 2 shows the raw measurements recorded on a 10 days period for channel 1.Fig. 2 Example of obtained time series: received signal 1( ) t
Pch
REC (blue curve), radar rain rateR 1(t)
rad
ch (red curve),1-hour pluviometers accumulated
rainfall time series RRG(t) (dash green curve)
Rainy periods are clearly characterized by a local decrease of the received signal, they thus appear as negative pulse. It is also important to note the significant time-variation of the signal during dry periods. It is difficult to determine the reference level relative to which the rain attenuation is measured because the transmitted signal shows daily variations (1 dB) caused by satellite movements and temperature changes and because the atmospheric composition (water vapor and cloud) also varies. All these variability must be taken into account when trying to separate dry from rainy periods.
4. Reference level
As, the emitted power is not known precisely the attenuation along the link path cannot be easily deduced from the received power. It is therefore important to determine the reference level relative to which the attenuation due to rain is measured. The problem is therefore to separate variations of the satellite and no rainy atmosphere from propagation effects due to rain.
The level of the received signal (PREC) results from the combination of instrumental and geometric characteristics such as
power of the transmitter (PE) on-board the satellite, transmitter and receiver antennas gain GE, GR, free space attenuation AF
and tropospheric attenuation. The latter is critically dependent upon satellite elevation θ and frequency range. In Ku band rain attenuation (AR) is not the only relevant parameter, as attenuation due to oxygen (AOxygen), liquid water in clouds
(ACloud), and water vapor (Avapor) and scintillation (AS) are also present.
(dB) (t) ) ( ) ( ) ( ) ( )
( E E R F S Oxygen Cloud Vapor R ch
REC t P G G A A t A t A t A t A
P = + + − − − − − −
(3)
The first six terms in equation (3) are constant or vary slowly over time and are more or less well known. In order to estimate the rain attenuation (AR), equ. 3 is expressed as follows:
(dB)
(t)
)
(
)
(
REF R RECt
P
t
A
P
=
−
(4) where PREF(t), called reference level, is equal to:(dB)
)
(
)
(
)
(
)
(
)
(
t
P
G
G
A
A
t
A
t
A
t
A
t
P
REF=
E+
E+
R−
F−
S−
Oxygen−
Cloud−
Vapor
In no-rainy situations, we have:
(dB)
)
(
)
(
t
P
t
P
REC=
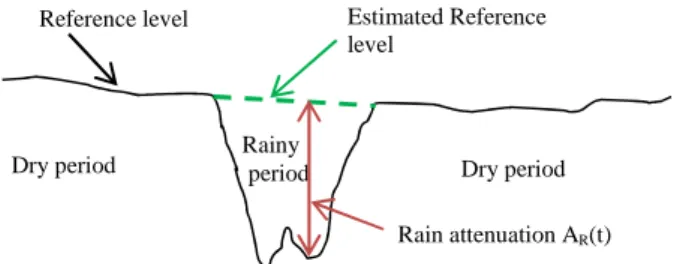
REF (5)The reference level is observed during non-rainy situations, it is therefore necessary to estimate it during rain events (fig. 3) in order to estimate AR. For that it is essentials to dispose of an algorithm allowing differentiating the dry periods of the rainy
periods from received signal.
2.5 3 3.5 4 x 10⁴ -2 -1 0 1 2 3 4 5 6 7 8 Time A tt e n u a ti o n ( d B ) R a in R a te ( m m /h ) One day
Fig. 3 : Received signal during a rain event
The rain – no rain detection algorithm
Each of the atmospheric processes involved have their own dynamics and contribute differently to the wave attenuation. Because of the high heterogeneity of the rain, the latter causes temporal fluctuations faster than gases or clouds of the received signal. Different characteristics (trends, standard deviation, kurtosis, skewness) of the observed Ku band signal received on channel have been computed using different window size from 110 seconds to one hour. Radar data
R
chrad1(
t
)
have been used to determine the corresponding state of the atmosphere (rainy or dry). The statistical distributions of these characteristics for rainy and dry periods have been compared to test their ability to discriminate between the two states (dry or rainy). Two characteristics have thus been selected (see equations 7) : the standard deviation over a time window equal to 30 mn and the local trend over a time window equal to 4 mn.
(
)
= = + = = + + = − + + =∑
∑
∑
− = − = − = 10 and 1,0,1,..1 -1,-1,.. -a with ) ( 1 )) ( ( 100 and ) ( 1 2 1 ) ( with )) ( ) ( ( 1 2 1 )) ( ( 2 1 2 L i k P a L k P Trd L i k P L k P k P i k P L k P std L L i REC i REC L L i REC REC L L i REC REC REC (7)A Multi-Layer Perceptron (MLP) has been trained to obtain a pattern classifier that provides a rule for assigning each point k to one of the two classes (rainy or dry). The training process (estimation of the weights) thus requires a database composed of a wide set of couples (Xk, Yk):
> < = = period rainy to belongs k 1 . 0 ) ( if 1 period dry to belongs k 1 . 0 ) ( if 0 ))] ( ( )), ( ( [ 1 1 k R k R Y k P Trd k P std X rad ch rad ch k REC REC k r (8)
The training data base is composed of half of the data set measured from the channel 1 (1336201 samples), the other half is used to determine the optimal architecture (6 hidden neurons) in terms of generalization ability. After training the MLP output provide direct estimation of the posterior probabilities (Zhang 2000).
The MLP can be viewed as a mapping function, ℜ2→ℜ
:
W
F The underlying function FW, which minimizes the
expected squared error E(Y-FW(X))
2 , is the conditional expectation of Y given X : F
W(X)=E(Y/X)=P(rainy period/X).
Once obtained the MLP can be applied to the entire data set to identify dry and rainy time periods.
The discriminating rule is simple: assign sample k to rainy class if Yk ≥Po or dry class if Yk < Po. The optimization of Po is detailed hereafter.
After identification of dry and rainy periods from received signal, unknown reference level PREF in rainy periods will be
estimated by an interpolation technique from dry periods. When the reference level is known in rainy periods, equation 4 allows estimating
A
R(
t
)
. Assuming H is given by ITU-R P 618-9 and ITU-R P 530-9 recommendations, equations 1 and 2 give the corresponding rain rateR
chKU1(
t
)
. The probability threshold Po (found to be equal to 0.38) is chosen so that obtained distribution of is as close as possible to that of .5. Results
Characteristics vector X, corresponding to channel 7, has been computed from the time series
P
RECch7(
t
)
,, the MLP trained with channel 1 time series, is applied to identify dry and rainy periods. The method previously described is used to estimate
R
chKU1(
t
)
R
chrad1(
t
)
Dry period Dry period Rainy
period
Reference level Estimated Reference level
)
(
7
t
R
chKU . In order to quantify the performance of the device and associated algorithm, comparison withR
7(
t
)
radch and
)
(t
R
RG are then performed using different criteria. The visual comparison of the obtained times series of rainfall intensities measured by the radar and the Ku device is performed, the order of magnitude and the dynamics of the two measurements are similar, which is a promising result. We have to underline that these two quantities cannot be equal because of the different sampling volumes, altitudes and resolutions. Figure 4 shows the comparison of accumulated rainfall measured by the gauges, the radar and those estimated from the received signal for the 4 months period. The radar and the Ku device obtained a total accumulated height of 220 mm while rain gauges measured a slightly higher rain height.Fig. 4 Accumulated rainfall obtained by radar (blue curve), Pluviometers (green curve), Ku device (red curve) for a 4 months period
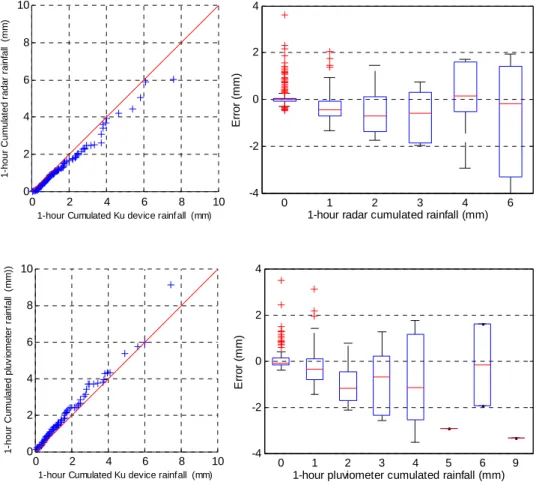
Fig. 5 shows the comparison of hourly-accumulated rainfall measured by Radar and Ku device (top) and by rain gauge and Ku device (bottom). The quantile – quantile plots (left side) are relatively close to the diagonal indicating that the
distributions are quite similar. The centre of the error box plot (right side) are between -1.3 and 0.1 mm, the width of the boxes are especially large when the rainfall intensity is high. The higher intensities may correspond to highly variable convective weather situations, which can lead to differences between the observations of different instruments.
Fig. 5 Q-Q plot between radar and Ku device (top left) and between pluviometers and Ku device (bottom left). Box plot between radar and Ku device (top right) and between pluviometers and Ku device (bottom right)
0 20 40 60 80 100 120 0 50 100 150 200 250 Time (Days) A c c u m u la te d r a in fa ll ( m m ) Radar Ku Pluv -4 -2 0 2 4 0 1 2 3 4 6
1-hour radar cumulated rainfall (mm)
E rr o r (m m ) -4 -2 0 2 4 0 1 2 3 4 5 6 9
1-hour pluviometer cumulated rainfall (mm)
E rr o r (m m ) 0 2 4 6 8 10 0 2 4 6 8 10
1-hour Cumulated Ku device rainf all (mm)
1 -h o u r C u m u la te d r a d a r ra in fa ll ( m m ) 0 2 4 6 8 10 0 2 4 6 8 10
1-hour Cumulated Ku device rainfall (mm)
1 -h o u r C u m u la te d p lu v io m e te r ra in fa ll ( m m ))
Rain events case studies
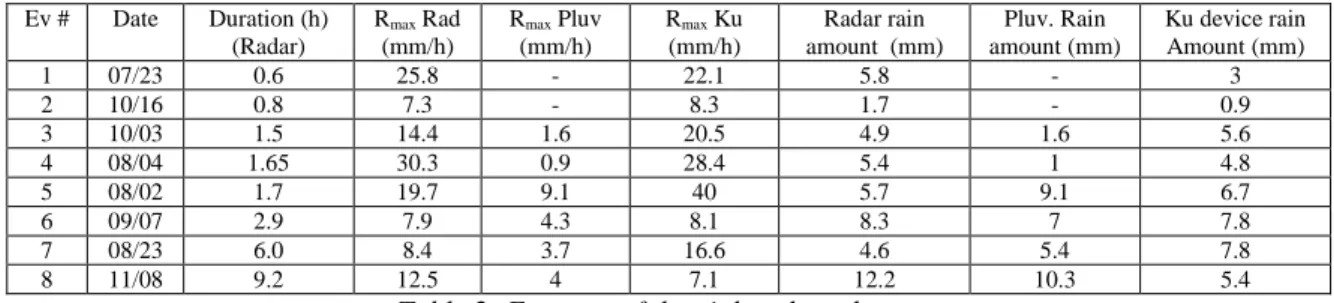
Eight rain events of various intensities and durations have been selected. Although we cannot consider that they are representative of the local rainfall climatology, they nonetheless allow to highlight a few points. The dates, durations (according to radar), maximum rain rates and rain amounts estimated by respectively by the radar, the pluviometers and Ku device are given in Table 2. Events are sorted by increasing duration. It can be seen that rain amount estimated by the radar and the Ku device are relatively close to each other (deviation <17%) for events whose duration is between 1 and 3 hours (Events #3,4,5,6). This is not the case for short (< 1 h) or long duration events (>6 h). For events of short duration comparison between devices is irrelevant because of differences in spatial resolution and localization of each instrument. For long duration rain events the linear interpolation used for the evaluation of the reference level is not suitable.
Ev # Date Duration (h) (Radar) Rmax Rad (mm/h) Rmax Pluv (mm/h) Rmax Ku (mm/h) Radar rain amount (mm) Pluv. Rain amount (mm) Ku device rain Amount (mm) 1 07/23 0.6 25.8 - 22.1 5.8 - 3 2 10/16 0.8 7.3 - 8.3 1.7 - 0.9 3 10/03 1.5 14.4 1.6 20.5 4.9 1.6 5.6 4 08/04 1.65 30.3 0.9 28.4 5.4 1 4.8 5 08/02 1.7 19.7 9.1 40 5.7 9.1 6.7 6 09/07 2.9 7.9 4.3 8.1 8.3 7 7.8 7 08/23 6.0 8.4 3.7 16.6 4.6 5.4 7.8 8 11/08 9.2 12.5 4 7.1 12.2 10.3 5.4
Table 2: Features of the eight selected events
Conclusion
Ku band microwave sources on board of satellites such as those employed in telecommunication or broadcasting can potentially be used for the estimation of rainfall. A ground low cost microwave system able to estimate atmospheric attenuation along earth to satellite links has been developed to investigate an opportunistic use of these microwave sources. A 4 months measurement campaign was performed. A Multi-Layer perceptron was proposed to identify dry and rainy periods from the received signal and thus to estimate the attenuation due to rain on the path link. ITU models were then used to convert rain attenuation into rainfall rate. Despite the simplicity of part of the methods or the use of empirical formulas, the first results are promising. Good agreement between the Ku device, weather radar and rain gauge in term of total accumulated rainfall but also in term of hourly rainfall distribution is obtained. Moreover, several means can be envisaged to improve the results:
In this first feasibility study, each of the available channel (i.e. one frequency and one polarization), is used independently to estimate different values of rain rate. In the future, the combined use of several channels corresponding to different frequencies or polarizations will improve the device performance.
For long duration rain events (> 3 hours) improvements are still needed, especially in the evaluation of the reference level. In this case a simple linear interpolation from dry periods is not sufficient. A clear sky template have to be performed with the clear sky periods observed in the previous days.
The use of several links associated with tomography methods should be used to estimate rainfall fields at small-scale helpful in hydrology or for radar calibration.
References
Leijnse, H., R. Uijlenhoet, and J. N. M. Stricker, 2007: Rainfall measurement using radio links from cellular communication networks. Water Resour. Res., 43.
Maitra, A., C. Kaustav, B. Sheershendu, B. Srijibendu, 2007: Propagation studies at Ku-band over an earth-space path at Kolkata, Indian Journal of Radio Space Physics, 36, 363-368.
Messer, H., A. Zinevich, and P. Alpert, 2006: Environmental monitoring by wireless com- munication networks. Science, 312, 713.
Olsen R L; D V rogers and D B Hodge 1978 'The aRb relation in the calculation of the rain attenuation' IEEE Trans Antennas Propag 26 (2) 318-329.
Propagation data and prediction methods required for earthspace telecommunication systems, 2009: Recommendation ITU-R P.618-9, ITU-ITU-R ITU-Recommendations, P-Series Fascicle, ITU, Geneva.
Propagation data and prediction methods required for the design of terrestrial line-of-sight systems, 2001: Recommendation ITU-R P.530-9, ITU-R Recommendations.
Specific attenuation model for rain for use in prediction methods, 2005: Recommendation ITU-R P.838-3.
Tabary, P., 2007: The new french operational radar rainfall product. Part I: methodology. Weather Forecast., 22, 393–408. Zhang G.P.,2000 Neural Networks for Classification: A Survey, IEEE Trans. Syst., Man, Cybern., Part C: applications and reviews, vol. 30, No. 4, 451-462.