HAL Id: hal-00074100
https://hal.archives-ouvertes.fr/hal-00074100
Submitted on 24 May 2006
HAL is a multi-disciplinary open access archive for the deposit and dissemination of sci-entific research documents, whether they are pub-lished or not. The documents may come from teaching and research institutions in France or abroad, or from public or private research centers.
L’archive ouverte pluridisciplinaire HAL, est destinée au dépôt et à la diffusion de documents scientifiques de niveau recherche, publiés ou non, émanant des établissements d’enseignement et de recherche français ou étrangers, des laboratoires publics ou privés.
Quantification of water content and speciation in natural
silicic glasses (phonolite, dacite, rhyolite) by confocal
microRaman spectrometry
Andrea Di Muro, Benoît Villemant, Gilles Montagnac, Bruno Scaillet, Bruno
Reynard
To cite this version:
Andrea Di Muro, Benoît Villemant, Gilles Montagnac, Bruno Scaillet, Bruno Reynard. Quantification of water content and speciation in natural silicic glasses (phonolite, dacite, rhyolite) by confocal microRaman spectrometry. Geochimica et Cosmochimica Acta, Elsevier, 2006, 70 (11), pp.2868-2884. �10.1016/j.gca.2006.02.016�. �hal-00074100�
Quantification of water content and speciation in
natural silicic glasses (phonolite, dacite, rhyolite) by
confocal microRaman spectrometry
A. Di Muroa,, B. Villemanta, G. Montagnacb, B. Scailletc and B. Reynardb
aLaboratoire de Physique et Chimie des Systèmes Volcaniques, IPGP-Paris VI,
Paris, France
bLaboratoire de Sciences de la Terre, Ecole Normale Supérieure, Lyon, France cInstitut des Sciences de la Terre d’Orléans, CNRS-UO, Orléans, France
Abstract
The determination of total water content (H2OT: 0.1–10 wt%) and water speciation
(H2Omolecular/OH) in volcanic products by confocal microRaman spectrometry are
discussed for alkaline (phonolite) and calcalkaline (dacite and rhyolite) silicic glasses. Shape and spectral distribution of the total water band (H2OT) at 3550 cm−1 show
systematic evolution with glass H2OT, water speciation and NBO/T. In the studied set
of silicic samples, calibrations based on internal normalization of the H2OT band to a
band related to vibration of aluminosilicate network (TOT) at 490 cm−1 vary with glass peraluminosity. An external calibration procedure using well-characterized glass standards is less composition-dependent and provides excellent linear correlation between total dissolved water content and height or area of the H2OT
Raman band. Accuracy of deconvolution procedure of the H2OT band to quantify
water speciation in water-rich and depolymerized glasses depends on the strength of OH hydrogen bonding. System confocal performance, scattering from embedding medium and glass microcrystallinity have a crucial influence on accuracy of Raman analyses of water content in glass-bearing rocks and melt inclusions in crystals.
1. Introduction
Laser Raman spectroscopy has been extensively used for structural studies of hydrous natural and synthetic silicate glasses (e.g., Mysen et al., 1980, McMillan and Remmele, 1986, Mysen and Virgo, 1986b, Mysen, 1990, Zotov and Keppler, 1998 and Zotov, 2003) and for chemical and physical characterization of fluid inclusions (e.g., Dubessy et al., 1989, Chou et al., 1990, Wopenka et al., 1990, Pasteris et al., 1996 and Chen et al., 2004). Recently, new Raman analytical routines have been proposed for the quantitative analysis of total water content (H2OT) and speciation
(H2Om molecular/hydroxyl OH) in natural and synthetic aluminosilicate glasses
(Thomas, 2000, Thomas, 2002, Chabiron et al., 2004 and Arias et al., 2006). These studies have demonstrated the high accuracy and repeatability of Raman spectrometric analyses of water in glass chips or glass inclusions in the H2OT range
0.1–20 wt%.
The development of quantitative Raman routines represents an important improvement for the microanalysis of water in geomaterials mostly because of its very small analytical spot (1–2 μm) and the easy sample preparation that just requires polishing. In particular, petrological and volcanological studies can
substantially benefit from establishment of Raman routines applicable to natural glasses. In practice, the microRaman technique potentially allows accessing to all the glass inclusion populations in a given sample or to small glass volumes in highly crystallized products. The technique does not require exposing glass inclusions if embedded in transparent crystals and allows preserving the mutual spatial relationships between the different phases. Furthermore, matrix glasses, glass and fluid inclusions can be analysed with the same instrument in a single analytical session. This analytical approach permits to collect a statistically representative database necessary for studying the volatile phase in a magma reservoir (Cioni, 2000) and modelling processes as magma degassing (Villemant et al., 2003), magma crystallization (Scaillet and Evans, 1999), evolution of eruptive dynamics (Di Muro et al., 2004), pyroclastic-rock thermal history (Wallace et al., 2003) or provenance (Arias et al., 2006) and magma–water interaction (Slejko et al., 2004). Previous quantitative microRaman studies of water in natural glasses have dealt mostly with Si-rich, CaO, MgO and FeO-poor (CaO and FeO < 1 wt%; MgO < 0.1 wt%) aluminosilicate systems of rhyolite, pegmatite and albite composition (Thomas, 2000, Chabiron et al., 2004 and Arias et al., 2006). Preliminary researches of Thomas (2002) suggest that different calibrations should be adopted for rhyolite and basalt glasses. In this paper, we test a range of microRaman routines to determine water contents (H2OT: <0.1–10 wt%) and speciations at room temperature
in a set of silicic volcanic glasses (phonolites, dacite, rhyolites) covering a wide range of major and volatile (H2O, F, Cl, S) element compositions (Table 1). In particular, we
discuss (1) advantages and drawbacks of external vs. internal calibrations and (2) composition-dependence of the different Raman routines. We compare our Raman data with the large dataset of FTIR data on water speciation as a function of H2O
content available for analogous glass compositions (Newman et al., 1986, Newman et al., 1988, Silver et al., 1990, Kohn et al., 1992, Pandya et al., 1992, Nowak and Behrens, 1995, Zhang et al., 1995, Carroll and Blank, 1997, Sowerby and Keppler, 1999, Nowak and Behrens, 2001, Ohlhorst et al., 2001, Schmidt et al., 2001 and Whittington et al., 2001) and with some glass inclusions previously measured by FTIR (Cioni, 2000).
We focus on the reliability of Raman spectroscopy for the quantitative analysis of total water content and speciation in chemically complex glasses with total iron (FeOT) up to 4.5 wt%. This work represents clearly only a first step in assessing the
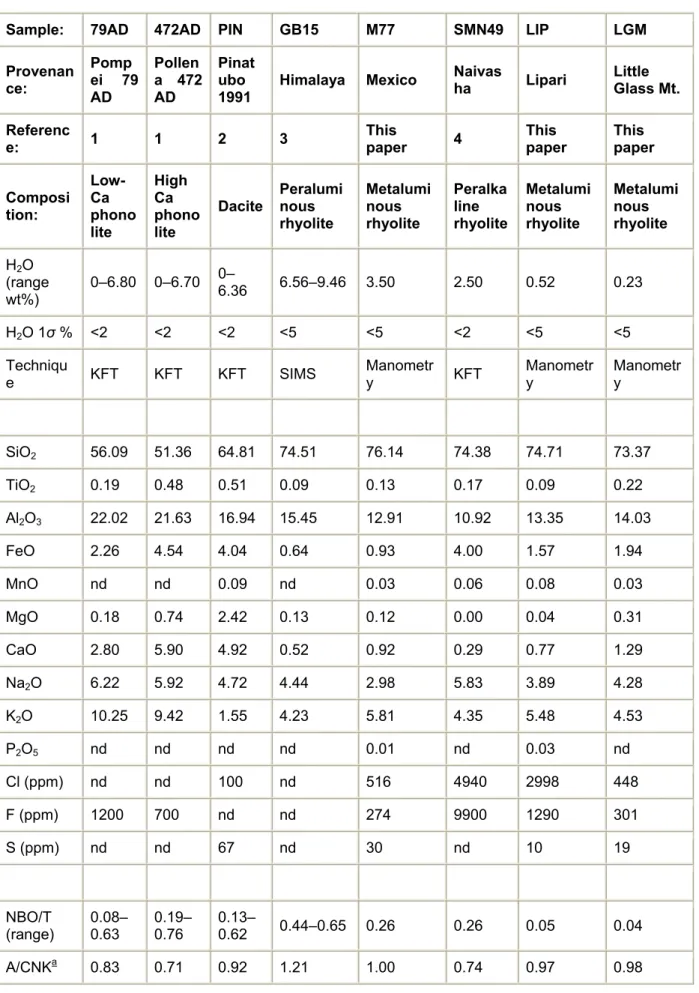
Table 1. : Conditions of hydration and cooling and electron microprobe analyses of standards glasses (phonolite, dacite, rhyolite) used to define Raman calibration lines in this study
Sample: 79AD 472AD PIN GB15 M77 SMN49 LIP LGM
Provenan ce: Pomp ei 79 AD Pollen a 472 AD Pinat ubo 1991
Himalaya Mexico Naivasha Lipari Little Glass Mt.
Referenc
e: 1 1 2 3 This paper 4 This paper This paper
Composi tion: Low-Ca phono lite High Ca phono lite Dacite Peralumi nous rhyolite Metalumi nous rhyolite Peralka line rhyolite Metalumi nous rhyolite Metalumi nous rhyolite H2O (range wt%) 0–6.80 0–6.70 0– 6.36 6.56–9.46 3.50 2.50 0.52 0.23 H2O 1σ % <2 <2 <2 <5 <5 <2 <5 <5 Techniqu
e KFT KFT KFT SIMS Manometry KFT Manometry Manometry
SiO2 56.09 51.36 64.81 74.51 76.14 74.38 74.71 73.37 TiO2 0.19 0.48 0.51 0.09 0.13 0.17 0.09 0.22 Al2O3 22.02 21.63 16.94 15.45 12.91 10.92 13.35 14.03 FeO 2.26 4.54 4.04 0.64 0.93 4.00 1.57 1.94 MnO nd nd 0.09 nd 0.03 0.06 0.08 0.03 MgO 0.18 0.74 2.42 0.13 0.12 0.00 0.04 0.31 CaO 2.80 5.90 4.92 0.52 0.92 0.29 0.77 1.29 Na2O 6.22 5.92 4.72 4.44 2.98 5.83 3.89 4.28 K2O 10.25 9.42 1.55 4.23 5.81 4.35 5.48 4.53 P2O5 nd nd nd nd 0.01 nd 0.03 nd Cl (ppm) nd nd 100 nd 516 4940 2998 448 F (ppm) 1200 700 nd nd 274 9900 1290 301 S (ppm) nd nd 67 nd 30 nd 10 19 NBO/T (range) 0.08–0.63 0.19–0.76 0.13–0.62 0.44–0.65 0.26 0.26 0.05 0.04 A/CNKa 0.83 0.71 0.92 1.21 1.00 0.74 0.97 0.98
Sample: 79AD 472AD PIN GB15 M77 SMN49 LIP LGM Provenan ce: Pomp ei 79 AD Pollen a 472 AD Pinat ubo 1991 Himalaya Mexico Naivas
ha Lipari Little Glass Mt.
Referenc
e: 1 1 2 3 This paper 4 This paper This paper
Composi tion: Low-Ca phono lite High Ca phono lite
Dacite Peraluminous rhyolite Metalumi nous rhyolite Peralka line rhyolite Metalumi nous rhyolite Metalumi nous rhyolite Na2O + K2 O 16.4 15.3 6.3 8.7 8.8 10.0 9.4 8.8 K2O/Na2O 1.6 1.6 0.3 1.0 1.9 0.7 1.4 1.1
Glass synthesis conditions
P (bar) 2000 2000 3000 4000 <5 2000 <5 <5
T (°C) 1200 1200 1400 803-720 ? 830 ? ?
Quench Drop Drop Isobaric Isobaric “Isobaric” Drop “Isobaric” “Isobaric”
Quench
rate (°C/s) 100–200 100–200 2.0–3.0 2.0–3.0 <0.01 100–200 <0.01 <0.01
References: (1) Scaillet and Pichavant, 2004; (2) Scaillet and Evans (1999); (3) Scaillet et al. (1995); (4) Scaillet and Mcdonald (2001). Typical analytical errors of EPMA analyses were <1% for SiO2,
Al203, <5% for CaO, Na2O, K2O, MgO, FeO and <10% for TiO2, MnO, F, Cl. Total water content in
glass samples has been determined by Karl–Fischer titration (KFT), secondary ion mass spectrometry (SIMS) and hydrogen manometry (Michel and Villemant, 2003). NBO/T, number of non-bridging oxygens per tetrahedrally coordinated cation (T: Si, Al, Fe3+, P). NBO/T have been calculated by assuming that (1) all H2O is in the form H2Om or T-OH, (2) alkali-balanced Al is in tetrahedral
coordination and excess Al acts as a network modifier, (3) half of total iron is in the form Fe3+.
Assumptions 1 and 3 are the strongest. They could mostly affect the estimation of NBO/T in alkali-earth- and iron-rich glasses such as the Pollena phonolite, but probably only moderately because they operate in opposite directions (increase in modifier-bonded M-OH and decrease in (Fe3+)IV are expected to produce opposite variations in NBO).
nd, not determined.
a Molar Al
2. Glass samples
In order to investigate the influence of glass composition and structure on microRaman calibrations we selected a set of rhyolite, dacite and phonolite hydrous glasses covering a large range of NBO/T (0.04–0.80) (Table 1). We calibrated microRaman routines for determination of total water contents on naturally hydrous (metaluminous rhyolites: obsidians LIP and LGM; rhyolite M77; glass inclusions QMD) and hydrated glasses (peraluminous rhyolite set: GB15; peralkaline rhyolite glass: SMN49; phonolite sets: 79AD and 472AD; dacite set: PIN) (Table 1 and Table 2).
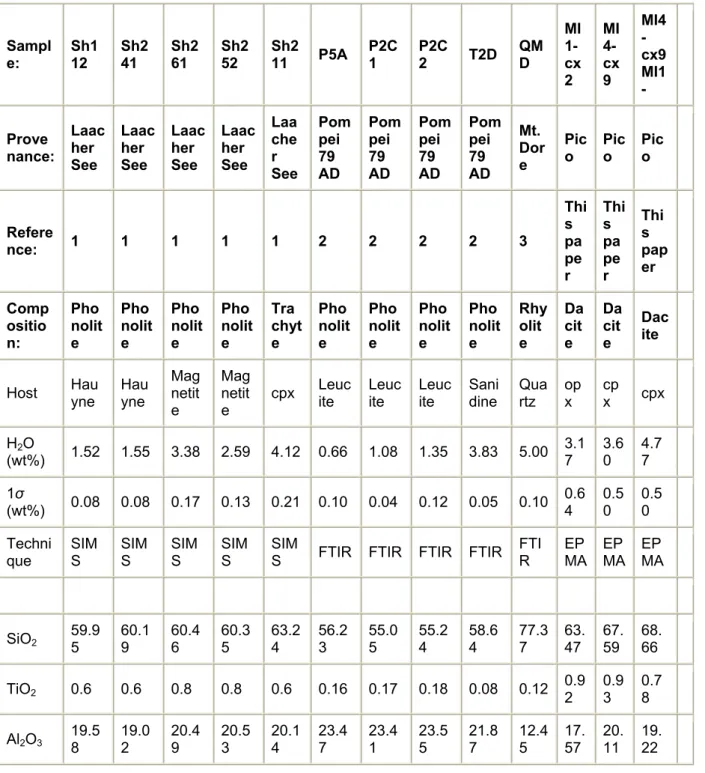
Table 2. : Composition of glass inclusions analysed by microRaman spectrometry in this study
Sampl e: Sh1 12 Sh2 41 Sh2 61 Sh2 52 Sh2 11 P5A P2C 1 P2C 2 T2D QM D MI 1-cx 2 MI 4-cx 9 MI4 -cx9 MI1 -Prove nance: Laac her See Laac her See Laac her See Laac her See Laa che r See Pom pei 79 AD Pom pei 79 AD Pom pei 79 AD Pom pei 79 AD Mt. Dor e Pic o Pico Pico Refere nce: 1 1 1 1 1 2 2 2 2 3 Thi s pa pe r Thi s pa pe r Thi s pap er Comp ositio n: Pho nolit e Pho nolit e Pho nolit e Pho nolit e Tra chyt e Pho nolit e Pho nolit e Pho nolit e Pho nolit e Rhy olit e Da cit e Da cit e Dac ite
Host Hauyne Hauyne Magnetit e Mag netit e cpx Leuc ite Leuc ite Leuc ite Sani dine Qua rtz op x cp x cpx H2O (wt%) 1.52 1.55 3.38 2.59 4.12 0.66 1.08 1.35 3.83 5.00 3.17 3.60 4.77 1σ (wt%) 0.08 0.08 0.17 0.13 0.21 0.10 0.04 0.12 0.05 0.10 0.6 4 0.5 0 0.5 0 Techni
que SIMS SIMS SIMS SIMS SIMS FTIR FTIR FTIR FTIR FTIR EPMA EPMA EPMA
SiO2 59.95 60.19 60.46 60.35 63.24 56.23 55.05 55.24 58.64 77.37 63.47 67.59 68.66
TiO2 0.6 0.6 0.8 0.8 0.6 0.16 0.17 0.18 0.08 0.12 0.92 0.93 0.78
Sampl e: Sh1 12 Sh2 41 Sh2 61 Sh2 52 Sh2 11 P5A P2C 1 P2C 2 T2D QM D MI 1-cx 2 MI 4-cx 9 MI4 -cx9 MI1 -Prove nance: Laac her See Laac her See Laac her See Laac her See Laa che r See Pom pei 79 AD Pom pei 79 AD Pom pei 79 AD Pom pei 79 AD Mt. Dor e Pic o Pico Pico Refere nce: 1 1 1 1 1 2 2 2 2 3 Thi s pa pe r Thi s pa pe r Thi s pap er Comp ositio n: Pho nolit e Pho nolit e Pho nolit e Pho nolit e Tra chyt e Pho nolit e Pho nolit e Pho nolit e Pho nolit e Rhy olit e Da cit e Da cit e Dac ite FeO 2.09 2.23 1.98 2.08 1.61 1.80 2.28 2.10 0.99 0.78 4.94 2.31 1.67 MnO 0.17 0.16 0.06 0.06 0.14 0.14 0.12 0.18 0.08 0.04 0.09 0.04 0.06 MgO 0.26 0.26 0.29 0.31 0.06 0.06 0.05 0.05 0.02 0.04 1.57 0.62 0.32 CaO 2.57 3.11 2.68 2.65 1.15 2.43 2.66 2.46 1.44 0.29 4.83 4.50 3.47 Na2O 4.65 4.24 5.31 5.15 4.64 10.69 810.0 10.19 5.32 4.17 4.27 1.92 2.94 K2O 10.04 10.12 7.81 7.92 8.29 5.01 6.17 6.05 11.55 4.73 2.34 1.98 2.87 P2O5 0.08 0.10 0.15 0.15 0.14 bdl bdl bdl bdl nd nd nd nd Cl (ppm) 1417 1729 2169 1969 2270 6240 9180 8490 3780 3223 1260 1390 1400 F (ppm) 4545 4700 1292 1221 856 5500 4800 7100 3400 nd bdl 1430 bdl S (ppm) 96 160 710 628 298 bdl bdl 96 bdl nd 1458 2196 1328 A/CNK 0.84 0.81 0.93 0.94 1.08 0.86 0.83 0.85 0.92 1.00 0.96 1.49 1.35 Na2O + K2O 14.7 14.4 13.1 13.1 12.9 15.7 16.2 16.2 16.9 8.9 6.6 3.9 5.8 K2O/N a2O 2.2 2.4 1.5 1.5 1.8 0.5 0.6 0.6 2.2 1.1 0.5 1.0 1.0
Glass inclusions were previously analysed for water by FTIR (Pompei, 79), SIMS (Laacher See) and EPMA (Citlaltepetl). References: (1) Sharygin (1993); (2) Cioni (2000); (3) Chabiron et al. (2004). nd, not determined.
Calibration routines have then been tested on glass inclusions of phonolite, trachyte and dacite compositions previously measured for water using other microanalytical techniques (Table 2). Phonolite calibrations were tested on glass inclusions in crystals of (1) the 79 AD Vesuvius eruption previously analysed by FTIR and EPMA (Cioni, 2000) and (2) the Upper Laacher See Tephra analysed by SIMS and EPMA (Sharygin, 1993; Table 2). Compositions of the Laacher See inclusions fall close to the lower limit of the phonolite field or in the trachyte field (Fig. 1A). Dacite calibration was tested on dacite glass inclusions from Citlaltepetl volcano (Mexico; Rossotti and Carrasco-Nunez, 2004) previously analysed by EPMA using a “by difference” approach calibrated on dacitic standards.
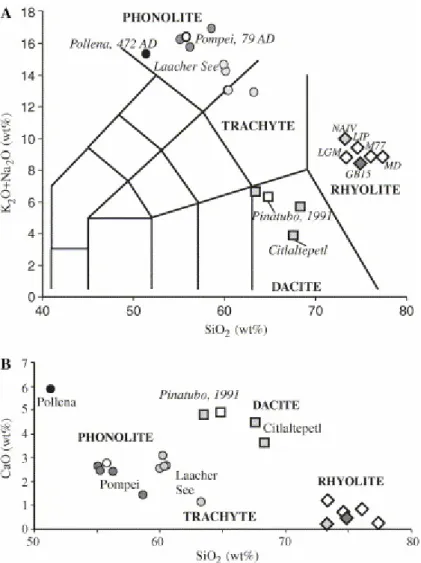
Fig. 1. Estimation of dry compositions of hydrous glass chips and glass inclusions analysed in this study. Black and white dots are hydrous phonolite glass chips from Pollena and Pompei eruptions of Mt. Vesuvius, respectively. Grey dots correspond to phonolite glass inclusions. White diamonds are metaluminous rhyolites. Dark grey diamonds are the peraluminous rhyolite series of glass chips and light-grey diamond is a peralkaline rhyolite glass chip used as external standard. Vesuvius Phonolites differ slightly in total alkali contents (A) but significantly for their alkali-earth (B) and iron contents (Table 1).
Synthesis procedures of glasses and protocols for major and volatile element determination have been described in detail elsewhere and are summarized in Table 1. Fast drop-quench (100–200 °C/s) was used for synthesis of phonolite and peralkaline rhyolite glasses, while dacite and peraluminous rhyolite glasses experienced slow isobaric quench (2–3 °C/s) (Table 1). The set of natural metaluminous rhyolite glasses corresponds to liquids cooled at the slowest quench-rate (<0.01 °C/s) and lowest isobaric pressure (<5 bars) among our samples (Gottsmann and Dingwell, 2001). Phonolite and dacite standards were hydrated at higher temperatures (1200–1400 °C) than peraluminous and peralkaline rhyolite glasses (830–720 °C) (Table 1).
The two selected sets of phonolite standards (H2OT: <0.1–6.8 wt%) have dry
compositions corresponding to those of the main explosive phases of the Pollena 472 AD and the Pompei 79 AD Vesuvius eruptions. These sets differ only slightly by their Si and alkali contents (Fig. 1A) and mainly by their Ca, Fe and MgO contents, that are higher in the Pollena glasses (Fig. 1B; Table 1). Dacite standards (H2OT: 0–
6.4 wt%) have the lowest total alkali content in our series of glasses and their composition is that of the dacite erupted during the 1991 Mt. Pinatubo eruption (Table 1). In particular, Pinatubo dacite (adakite) has much less K2O (1.6 wt%) than
phonolitic (9.4–10.2 wt%) and rhyolitic glasses (4.1–5.8 wt%), and it contains significant amounts of MgO and CaO (Fig. 1). The set of rhyolite standards was assembled in order to cover a large range of A/CNK (molar Al2O3/CaO + Na2O + K2O) and water contents (H2OT: 0.2–9.5 wt%).
The adopted approach allowed exploring the influence of former vs. network-modifier cation ratios and alkali metal/alkaline earth ratios on Raman analytical routines.
3. Raman equipment and analytical routines
3.1. Analytical procedure
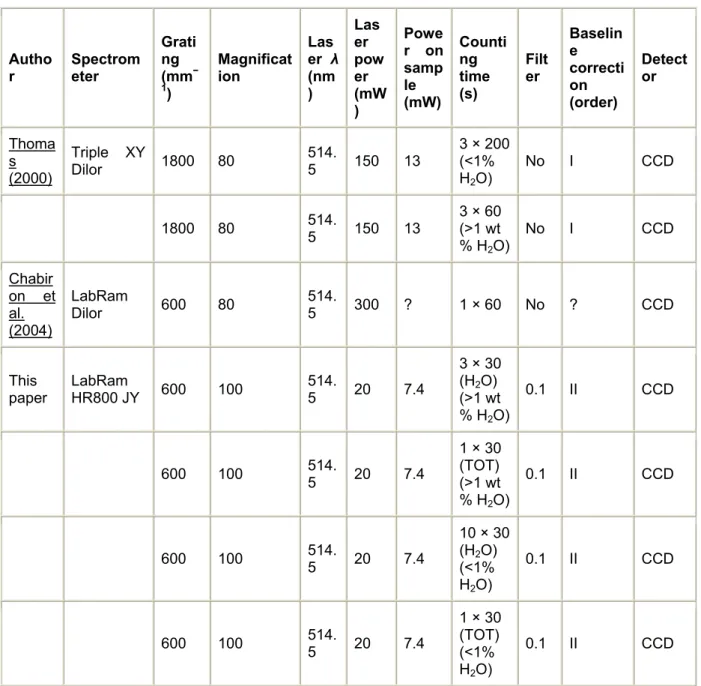
Raman scattering was excited using 514.5 nm wavelength of an argon ion laser from Spectra Physics and measurements were performed with a LabRam HR800 (ENS-Lyon) spectrometer manufactured Jobin-Yvon equipped with a Peltier-cooled CCD detector. Glasses were analysed by focusing the laser beam on their surface in a 1 μm-wide spot under an Olympus microscope in confocal setting. The used pseudo-confocal system is characterized by low pseudo-confocal performance but high system throughput. To reduce sampling depth we adopted a small confocal hole (100 μm) and focused through the objective with the highest magnification (100×) (Table 3). The same microscope objective permits observation of the sample, focuses the laser beam onto the surface of the sample and collects the scattered radiation. Spectra were obtained in the 150–2000 cm−1 (Fig. 2; aluminosilicate framework vibration domain) and 3000–4000 cm−1 (Fig. 3; OH-stretching domain) ranges relative to the
exciting laser light. A grating of 600 grooves/mm was used to cover in one scan each domain. That clearly resulted in moderate resolution (±4 cm−1), but high intensity of the collected signal. Average input laser power was about 20 mW. Laser power at the sample was 7.4 mW and was periodically checked on a potentiometer placed on the
sample holder before the sample analysis, with the same analytical conditions adopted for the glass analysis.
Table 3. : Comparison of settings adopted in this and previous researches for quantitative microRaman analyses of water in aluminosilicate glasses
Autho r Spectrometer Grati ng (mm− 1) Magnificat ion Las er λ (nm ) Las er pow er (mW ) Powe r on samp le (mW) Counti ng time (s) Filt er Baselin e correcti on (order) Detect or Thoma s (2000) Triple XY Dilor 1800 80 514. 5 150 13 3 × 200 (<1% H2O) No I CCD 1800 80 514.5 150 13 3 × 60 (>1 wt % H2O) No I CCD Chabir on et al. (2004) LabRam Dilor 600 80 514.5 300 ? 1 × 60 No ? CCD This paper LabRam HR800 JY 600 100 514.5 20 7.4 3 × 30 (H2O) (>1 wt % H2O) 0.1 II CCD 600 100 514.5 20 7.4 1 × 30 (TOT) (>1 wt % H2O) 0.1 II CCD 600 100 514.5 20 7.4 10 × 30 (H2O) (<1% H2O) 0.1 II CCD 600 100 514.5 20 7.4 1 × 30 (TOT) (<1% H2O) 0.1 II CCD ?, unknown.
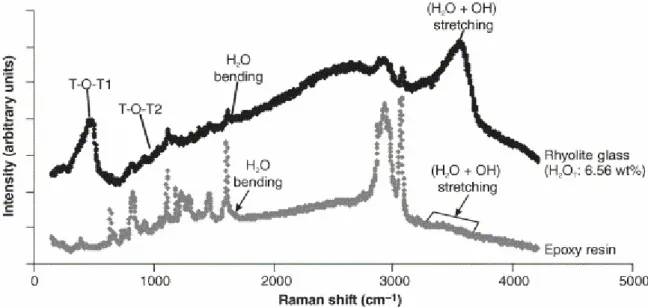
Fig. 2. Example of interference of embedding medium (polycarbonate epoxy resin) on Raman analysis of a glass sample. Raman spectra have been collected from the thin outer edge of a rhyolite glass chip and from embedding resin. In the spectrum of the glass, bands related to aluminosilicate framework (T-O-T), total water (molecular and hydroxyl) stretching and molecular water bending are associated with peaks related to underlying resin. Furthermore, resin interference results in a broad and steep fluorescent background, which significantly affects baseline treatment. In epoxy resin, low-intensity bands at ca. 3550 and 1630 cm−1 (arrows) reveal the presence of minor amounts of dissolved water. Further water can be absorbed during resin aging.
In glasses containing >1 wt% H2OT, acquisition times were of 3 × 30 s for the
high-frequencies domain and of 1 × 30 s for the low high-frequencies. Longer counting times were adopted for glasses with <1 wt% H2OT to increase the signal to noise ratio
(Table 3). All spectra were obtained with the same optical configuration and at least three analyses were performed on each sample.
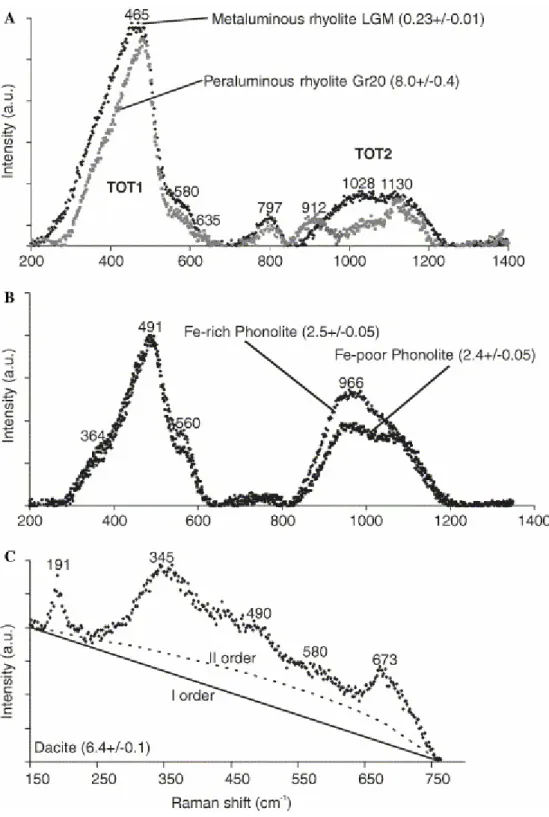
Fig. 3. Evolution of unpolarized TOT band shape as a function of glass composition. (A) Hydrous metaluminous and peraluminous rhyolites, (B) hydrous phonolites, (C) hydrous dacite. Spectra in (A and B) have been baseline-corrected. In hydrous dacite glasses, interfering peaks at 190, 345 and 670 cm−1 with intensity increasing with total water content are superimposed to the TOT1 feature and are attributed to increasing crystallization of nanolites (oxides) from the melt. Numbers in parentheses indicate the dissolved water contents.
3.2. Analysis optimization
Several important concerns arise during Raman spectroscopic analysis of water in glass samples at room temperature: (1) fluorescence of the sample, (2) local glass heating by laser beam, (3) weak scattering of O-H bonds, (4) background subtraction, and (5) band assignment. In the following paragraphs, we discuss the strategies we have adopted to reduce fluorescence and heating, to get an intense scattering signal and to treat and interpret the collected spectra.
In transparent or semi-transparent media and depending on confocal performance of the Raman equipment, the smallest signal sampling depth increases from 2μm to tens of microns, thus resulting in an approximately conical sampling volume. Consequently, Raman analysis of thin (<100 μm; e.g. glasses prepared for FTIR analyses or standard thin sections) can result into high fluorescent backgrounds, or presence of peaks due to scattering from the underlying crystal or from the embedding polycarbonate epoxy resin (Fig. 2). In this way, scattering from OH groups in the epoxy resin (Fig. 2) or in the crystal (e.g., amphibole) can affect the determination of glass water content. Moreover, scattering from silicate or oxide phases dispersed in the glass under analysis can result in peaks interfering with the T-O-T vibration bands in the low-frequency side of the glass spectra (Di Muro et al., 2006). Therefore, one-side polished glass inclusions >20 μm-thick and millimeter-thick glass chips were selected to avoid collecting scattered signal from embedding medium.
A low hitting laser power and a short signal collection time (Table 3) were used to obtain intense and reproducible peaks and low local glass heating. In spite of the adopted cautions, heating and oxidation were detected in dacite glasses, which are possibly related to the presence of Fe-oxides nano-crystals crystallized during slow quench. Even with such a low laser power, oxidation of magnetite to maghemite can occur (de Faria et al., 1997). Maghemite scattering produces peaks in the 300– 800 cm−1 region (Fig. 3C) that overlap the bands related to the aluminosilicate glass framework (de Faria et al., 1997). This process results to have increasing importance from dry to water-rich glasses, in which element diffusion and microlite crystallization are faster (Di Muro et al., 2006).
3.3. Spectra treatment
Absolute intensity of Raman scattering I (ν)i for a molecule (i) is given by
I(ν)i=IoNi(δσ)iK(ν), (1)
where Io is the incident laser power, Ni the molar concentration of the scatterer in the
excited volume and (δσ)i the differential scattering cross-section and K (ν) is the overall collection optics and spectrometer response.
(δσ)i expresses the dependence of molar scattering power of the species (i) on (1) temperature (T), (2) absorptivity of the material under analysis ε (ν), (3) vibrational frequency νi of scattered radiation and (4) path length l. Some of these parameters are frequency-dependent and usually they are not known. However, the frequency
(νi) term has the main influence on scattering intensity, while K (ν) and ε (ν) terms have only a subordinate weight.
Relative band intensities are used for quantitative analyses instead of absolute ones as the intensity of collected Raman scattering is inherently weak and dependent on the stability of analytical conditions and the sampling depth. Relative intensities can be accurately determined and allow developing Raman spectroscopy in a quantitative way (Mysen and Virgo, 1986b, Thomas, 2000, Thomas, 2002, Chabiron et al., 2004, Arias et al., 2006 and Di Muro et al., 2006). In particular, assumption of equal scattering cross sections for two given species (es. hydroxyl OH and molecular H2Om) allows direct derivation of their molar ratio in a sample by measuring the band
height or area ratios of their Raman scattering (I(OH)/I(H2Om)) (Chabiron et al., 2004).
3.3.1. Baseline correction and detection limit
The adopted analytical setting (Table 3) produces a signal/background ratio significantly decreasing from water-rich to water-poor glasses. Presence of significant background noise in water poor-glasses produces an unacceptably high error when characterizing the broad and low-intensity OH-stretching band in samples with <0.1 wt% total H2O. Therefore, we estimate that 1000 ppm is the detection limit for
presently used Raman routines. Specific settings reducing background noise or enhancing Raman scattering are needed to reduce this detection limit. Therefore, we stress that, among the most widespread techniques, infrared spectroscopy (FTIR) remains the method of choice for accurate analysis of water-poor glasses (e.g., Pandya et al., 1992, Ihinger et al., 1994 and Devine et al., 1995).
Raman spectra corrected for their baseline are then characterized in terms of band identification, band geometry (height, area, half-width) and band spectral composition. Variable baseline definitions in terms of wavenumber ranges (e.g., 150– 800 cm−1 instead of 250–700 cm−1) or fit function (e.g., polynomial of second order) produce differences up to 25% (usually <15%) in band area measurement. A linear background in the range 3000–3800 cm−1 is observed for a rhyolite glass (M77, Table 1; 3.5 wt% H2O) dehydrated by heating during 3.5 h at 1500 °C and 1 bar.
However, a second order polynomial represents a much better fit for steep fluorescent backgrounds, common in natural glasses (Fig. 2 and Fig. 3C). In particular, the OH-stretching band often sits on a background whose intensity significantly decreases with frequency. We subtracted to all our spectra a second-order polynomial fitted to portion of the spectra where no Raman scattering was observed. The adoption of a baseline of constant type (second order polynomial) in a fixed wavenumber range (150–800 cm−1 and 3000–3800 cm−1) allows defining good calibration lines for determination of total dissolved water contents. However, this procedure can still produce some scattering when analyzing a glass series with variable water content and speciations because (1) the set of glasses may have variable fluorescence, which affects the importance of the baseline correction, (2) the deconvolution of the main bands in several contributions is strongly influenced by correct definition of the modes located near the tails of the total water band. In particular, the choice of a large wavenumber range for the definition of the background is crucial in getting an accurate characterization of the low and broad band related to water in water-poor samples (<1 wt%) having a low signal/background ratio.
3.3.2. Band deconvolution and assignments
Increasing amounts of dissolved water in aluminosilicate glasses result in increasing height and area of a broad band at 3550 cm−1 in the Raman spectra (Fig. 2). This
band is present in both infrared (e.g., Stolper, 1982) and Raman spectra (e.g., Mysen et al., 1997) and results from the overlap of the O-H stretching vibrations from hydroxyl groups (OH) and water molecules (H2Om). Further low-intensity bands at
910 cm−1 (possibly due to stretching of (Si,Al)-OH) and 1620–1630 cm−1 (bending of molecular H2Om) occur in the low-frequency region of spectra (Zotov and Keppler,
1998) (Fig. 2 and Fig. 3A).
For quantitative Raman analyses of water in rhyolitic samples, previous authors have normalized the high-frequency band ( 3550 cm−1) related to total water (OH + H2Om)
dissolved in the glass to a band produced by vibration of the T-O network (T: tetrahedrally coordinated cations as Si, Al) in the low frequency region ( 470– 490 cm−1) (Thomas, 2000, Thomas, 2002 and Chabiron et al., 2004). This internal normalization procedure may result in high systematic errors because of (1) the presence of spurious scattering from the embedding medium or dispersed microlites (Fig. 3C) and (2) possible dependence of TOT band geometry on glass composition and structure (Fig. 3) (Di Muro et al., 2006). Chabiron et al. (2004) have already discussed the correction that must be introduced in internal calibrations in order to use them when scattering from other media occur. In the following, we show that normalization to an external standard glass of known water content (external normalization) allows overcoming these problems. In particular, an external normalization permits to eliminate the spectrometer-dependent K (ν) term, it does not require any correction for frequency- and temperature-dependence of the scattering intensity and it is potentially less composition-dependent than internal procedure. For determination of water speciation (OH/H2Om), previous authors have
deconvoluted the 3550 cm−1 band in four contributions (e.g., Mysen and Virgo, 1986b, Mysen et al., 1997 and Chabiron et al., 2004). They have assigned two bands ( 3300 and 3550 cm−1) to molecular water (Mysen and Virgo, 1986b and Mysen et al., 1997), and two other bands ( 3600 and 3650 cm−1) to hydroxyl groups
M − OHn (M, metal), possibly with decreasing hydrogen bonding from low to high frequencies (McMillan and Remmele, 1986).
This deconvolution procedure implicitly assumes that no overlap exists between bands related to (symmetric and asymmetric) stretching of variably bonded H2Om and
OH. In order to test these assumptions, we initially deconvoluted the H2OT band with
a number of bands larger than four. The parameters of all bands were unconstrained for all samples and the iterative least-square fitting procedure was stopped when a low and almost constant residual (Δχ2 < 10%) was obtained (Fig. 5).
Residual analysis indicate that four Gaussian–Lorentzian bands accurately describe the H2OT band in water-rich glasses, but a weak fifth band (3710–3750 cm−1) is
required to fit spectra of glasses containing <1 wt% H2OT (Table 4; Fig. 5). In this
research, we discuss whether the observed variation in relative height, area and position of the spectral components occur because of change of water speciation with total water content, glass dry composition, cooling rate and pressure (e.g., Silver et al., 1990 and Zhang et al., 1995) or if H-bonding may play a major role.
Table 4. : Results of deconvolution of total water band ( 3.550 cm−1) in five spectral components Compositio n H(wt%)2Otot Ban d I cm−1 Ban d II (cm −1) Ban d III (cm −1) Ban d IV (cm −1) Ban d V (cm− 1) H2Om Raman (wt%) H2Om FTIR (wt%) OH Raman (wt%) OH FTIR (wt%) Dacite (PIN) 2.12–6.36 3254– 3379 345 0– 348 3 355 6– 357 1 362 0– 365 8 Abs ent Rhyolites 3.5–9.46 3253– 3371 345 6– 348 9 356 6– 357 8 363 3– 364 6 Abs ent Rhyolite(LG M151) 0.24 ± 0.01 Absent 3434 3552 3635 3742 0.10 nd 0.15 nd Rhyolite(LIP 151) 0.6 ± 0. 03 Abs ent 342 6 353 4 362 9 3752 0.18 nd 0.41 nd Phonolite (472 AD) 2.52–6.70 3265 – 3327 342 1– 346 6 353 3– 355 7 360 7– 361 9 Abs ent Phonolite (79AD) 2.38– 6.80 3237 – 3336 343 7– 345 8 353 8-355 5 361 2-361 8 Abs ent P5A (79AD)a 0.69 ± 0.10 3357 3421 3491 8359b 3709 0.29 ± 0.01 0.22 ± 0.12 0.39 ± 0.01 0.47 ± 0.02 P2C1 (79AD)a 0.89 ± 0 .04 Abs ent 342 7 351 9 362 9 3754 0.36 ± 0 .01 0.36 ± 0 .06 0.52 ± 0 .02 0.54 ± 0 .01 P2C2 (79AD)a 1.04 ± 0.12 3395 3467 3537 7360 3732 0.51 ± 0.03 0.40 ± 0.03 0.54 ± 0.03 0.64 ± 0.10 T2D (79AD)a 3.62 ± 0 .03 3364 3449 3542 3618 b3737 1.91 ± 0.06 2.35 ± 0.07 1.64 ± 0.05 1.48 ± 0.01
Water speciation (OH/H2Om) is determined as the area ratio of (V + IV + III)/(I + II) and compared with
FTIR data on the same glass inclusions (data from Cioni, 2000). The phonolite glass inclusion T2D has experienced limited water-loss consequent to glass heating during EPMA analysis and contains lower H2Omthan measured by FTIR. Note the presence of band V in water-poor glasses that we
attribute to weakly H-bonded hydroxyl species.
nd, not determined.
a Melt inclusions from Cioni (2000). b Very weak.
4. Results
4.1. Influence of glass composition and structure on water band normalization procedures
The adoption of normalization procedures using H2OT/TOT ratio for water analysis in
glasses (Thomas, 2000 and Chabiron et al., 2004) may depend on sample preparation or texture, and introduce a potentially large compositional-dependent term (TOT) into the analytical procedure. Raman spectra of our volcanic glasses exhibit two main broad and asymmetric bands in the low frequency region, the first between 250 and 650 cm−1 (TOT1) and the second between 850 and 1250 cm−1 (TOT2) (Fig. 3). A third low-intensity band is evident in rhyolites at 800 cm−1.
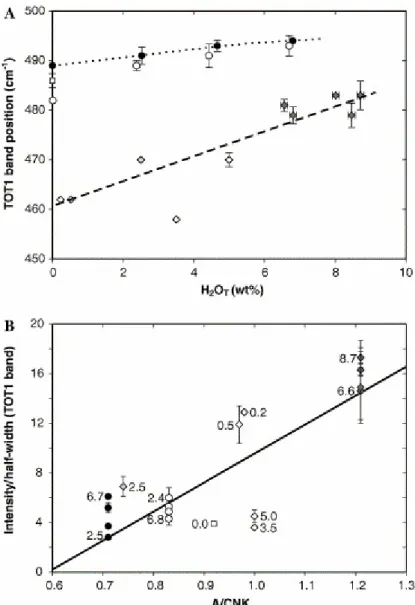
TOT1 is the most intense band in all glasses we analysed and it has been chosen for internal normalization for water analysis in rhyolite glasses (Thomas, 2000 and Chabiron et al., 2004). The TOT1 feature envelops the vibrations of structural units formed by variable tetrahedra numbers building the aluminosilicate framework of the glass (Sharma et al., 1981 and McMillan, 1984) and possibly of metal-oxygen polyhedra (Brawer and White, 1977). Therefore, band position and shape are expected to evolve as a result of the modification in glass composition and structure. TOT1 position shifts to higher frequencies from rhyolites to dacites and phonolites (Fig. 3). A further positive shift is also observed as a function of H2O content (Fig.
4A). These observations agree with previous data on simple aluminosilicate glasses (Mysen and Virgo, 1986a). TOT1 aspect ratio (height/half width ratio) increases with dissolved water content in all sets except Pompei phonolite (Fig. 4A) and, mostly, with Al2O3/alkali ratio (Fig. 4B). In anhydrous glasses, moderate broadening of the
TOT1 feature is observed from metaluminous rhyolites to dacites to phonolites and it is largely due to increasing intensity of a mode at 560–580 cm−1. In our glass sets, this band accounts for <5% of the TOT1 band in rhyolites and increases to 14% in anhydrous dacite glass and 8–19% in phonolites (Pollena: 14–19%; Pompei: 8– 13%). Its area or height are not correlated with total dissolved water. Irrespective of the detailed interpretation of all spectral component of the TOT1 band, a general agreement exists on the correlation of the intensity of TOT1 high-frequency side with the degree of depolymerization of the glass network (see Mysen, 1988 and Zotov and Keppler, 1998 for detailed discussion). More specifically, the 580 cm−1 band can be attributed to a mixed stretch–bend vibration in Si2O52− structural units (Furukawa
et al., 1981). Therefore, it is not surprising that the most significant TOT1 band broadening is observed in the Si-poor, alkali-and alkali-earth rich phonolite glasses from Pollena.
Fig. 4. Variation of TOT1 band position (A) and aspect ratio (B) as a function of dissolved water content and alumina vs. alkali ratio (A/CNK: molar Al2O3/CaO + NaO + K2O). Numbers indicate
dissolved water contents. The data of microlite-bearing hydrous dacite glasses are not reported because microlite scattering hinders correct determination of TOT1 parameters. Large scattering of values for some water-rich peraluminous glasses may reflect some sample heterogeneity. These glasses are the only samples containing a significant volume fraction of gas bubbles. Symbols as in Fig. 1. Lines are only “guides for the eyes” even if obtained by data fitting.
TOT2 is classically assigned to the T-O stretching of Qn species (Q, TO4 units; n,
number of bridging oxygens) and its spectral composition is strongly influenced by substitution of Al3+ and Fe3+ for Si4+ as network-forming cation (Mysen, 1988, Neuville
and Mysen, 1996 and Sharma et al., 1997). In natural volcanic glasses, relative intensity of TOT1/TOT2 decreases with glass depolymerization (Di Muro et al., 2006). In particular, the height of the mode at 1030 cm−1 strongly decreases and the
height of a band at 910 cm−1 increases from metaluminous to peraluminous rhyolites. Finally, entry of increasing percentages of Fe3+ in the tetrahedral network results in increasing height of a mode at 966 cm−1 (Di Muro et al., 2006). This mode is absent in peraluminous rhyolites, may have a very low height in metaluminous rhyolites (Fig. 3A) but it is intense in phonolites, especially in the iron-rich Pollena glass (Fig. 3B).
4.2. Determination of water speciation
4.2.1. Comparison between Raman and FTIR speciation data
The shape and the spectral distribution of the broad OH-stretching band at 3550 cm−1 vary significantly with H2OT content (Fig. 5 and Fig. 6), glass composition
(Fig. 7) and glass structure (Fig. 8). In glasses with H2OT > 0.7 wt%, an asymmetric
band is observed in the domain 3000–3800 cm−1 (Fig. 5 and Fig. 6). In water-rich
glasses (H2OT > 4.6 wt%), this band shifts to higher frequency with increasing glass
Si-content, from 3500–3520 cm−1 in phonolites to 3550–3570 cm−1 in dacite and rhyolite (Fig. 6). Among the analysed glass series, hydrous rhyolite glasses display the narrowest OH-stretghing bands (e.g., Fig. 6A). Full width at half height (FWHH) of total water band is very similar in rhyolites and dacite (Fig. 6B) and increases of ca. 20% in phonolites, which show an evident shoulder near 3300 cm−1 (Figs. 6C and D).
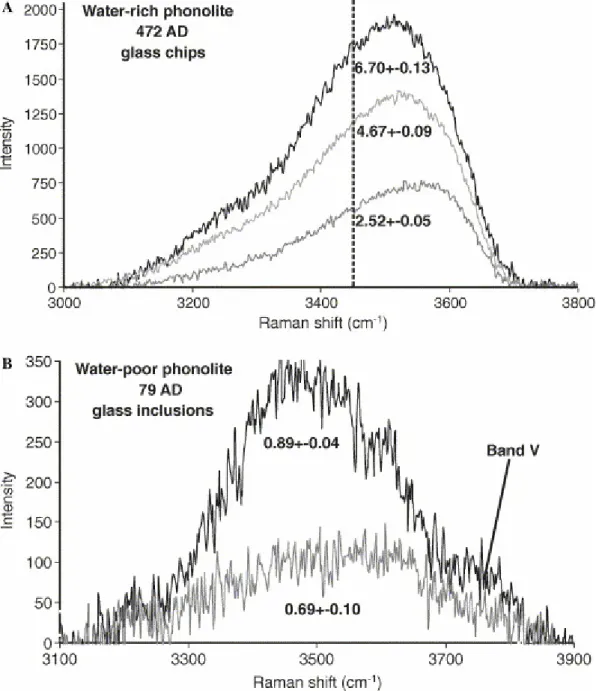
In water-poor glasses (H2OT < 0.9 wt%), the OH-stretching band is more symmetric
than in water-rich samples (Fig. 5B), it is often polymodal and shows a tail at frequencies >3700 cm−1 that is not observed in water-rich glasses (Fig. 5A).
In order to compare Raman and FTIR water speciation data, we deconvoluted the total water band in five components (I, 3240–3395 cm−1; II, 3420–3490 cm−1; III, 3520–3580 cm−1; IV, 3610–3660 cm−1; V, 3710–3750 cm−1) (Fig. 6; Table 4). The average positions of bands I–IV closely match those determined for rhyolite glasses by Chabiron et al. (2004). We calculated the ratio between the sums of the areas of I + II (attributed to H2Om) and III + IV + V (attributed to OH) bands. For phonolite
compositions, results are compared with speciation data determined by FTIR on the same glass inclusions from Pompei eruption (Table 4) and, for the other compositions, with FTIR trends from the literature (Fig. 7). These comparisons reveal that Raman data only rawly reproduce the typical evolution of water speciation, with a general increase of molecular water (H2Om) with total dissolved water and OH
Fig. 5. Shape evolution of unpolarized OH-stretching band in phonolite glasses after II order baseline subtraction. Band topology evolves from symmetric and polymodal in glasses with H2OT < 1.0 wt% to
asymmetric and unimodal in water-rich glasses. (A) Increase of molecular water content with total dissolved water content results in increasing intensity of the low frequency band side (<3500 cm−1). (B) Decreasing OH hydrogen bonding in water-poor glasses results in the appearance of a component that we interpret as related to weakly H-bonded OH groups in the high-frequency band side (>3700 cm−1).
Fig. 6. Deconvolution of unpolarized OH-stretching band in water-rich glasses (after II order baseline subtraction) in four contributions related to molecular water (bands I + II) and hydroxyl groups (bands III + IV) in water-rich metaluminous rhyolite (A), dacite (B) and phonolite (C and D) glasses. Overlap between contributions related to tightly H-bonded OH and loosely H-bonded H2Om can occur at the
level of band II. Note the progressive increase of intensity of band IV (moderately H-bonded OH) relative to band III (arrow, strongly H-bonded OH) from Ca-poor rhyolite (A) and Pompei phonolite (C) to Ca-rich Pollena phonolite (D). Numbers in brackets indicate total dissolved water content as determined by Karl–Fischer titration (KFT).
Fig. 7. Raman water speciation in the four series of analysed hydrous glasses calculated on the basis of (bands I + II)/(bands III + IV + V) area ratios. Speciation curves are from Silver et al. (1990) for metaluminous rhyolite, Cioni (2000) for phonolites and Ohlhorst et al. (2001) for dacite. Water speciation trends are shown for rhyolites synthesized using both rapid quench ( 400 °C/s) and slow quench (3 °C/s) apparatus (Silver et al., 1990). Filled symbols: hydroxyl (bands III + IV); open symbols: molecular water (bands I + II). In (C) MI are melt inclusions in phenocrysts from 79 AD Pompei eruption (Table 2).
Fig. 8. Evolution of the integrated area ratios of the five bands identified in the deconvolution of the total water band in Raman spectra. MA: metaluminous; PA: peralkaline; PAL: peraluminous. Increasing amounts of NBOs are expected to stabilize tightly H-bonded OH and H2Om species (bands
III and I, respectively). The decrease of band III and the concomitant increase of band II in dacite and rhyolite glasses with NBO > 0.3 suggest that band II actually may represent the overlap of the contributions of both weakly H-bonded H2Om and very strongly H-bonded OH.
In the case of rhyolite glasses, Raman data satisfactorily compare with FTIR trends for metaluminous rhyolites (Fig. 7A). Peraluminos rhyolites deviate from this trend and apparently contain a higher proportion of water as hydroxyls. Among Si-rich glasses, the main discrepancy between our Raman data and FTIR trends is found for the dacite glass series (Fig. 7B). This series, produced with slow isobaric quenching rate (Table 1), maintains a high hydroxyl content even at water contents >3 wt% (Fig. 7B). Slow cooling rates are expected to favour H2Om over OH (Stolper, 1982; Fig. 7A)
and therefore cannot be at the origin of the observed trend in the dacite series. We stress the mafic character of our dacite (adakite) and its low total alkali (Na2O + K2O)
content and very low K2O/Na2O ratio. (Table 1). Alkalis (especially K2O) may bond
water molecules (see e.g., Pichavant et al., 1992). Moreover, Ohlhorst et al. (2001) have obtained similar water speciation data for andesite glasses having K2O/Na2O
ratio comparable to those of our dacite series (0.3).
Systematic discrepancies appear in water-rich (>4.6 wt%) alkaline glasses. The adopted deconvolution procedure results in apparent high hydroxyl contents with respect to the FTIR trend determined by Cioni (2000) on phonolite inclusions from the 79 AD Vesuvius eruption. (Figs. 7C and D). Fast cooling-rate of our drop-quenched glass chips could, at least in part, explain the apparent high hydroxyl content respect to melt inclusions slowly cooled in the eruptive column. Appreciable differences in composition between our glass sets and natural glasses (Table 1 and Table 2) could also be at the origin of the observed differences. Some compositional heterogeneity in the natural samples results in significant data scattering reported as error bars on the phonolite speciation trend in Fig. 7. Our comparison with FTIR analyses performed on the same glass inclusions (79 AD phonolite) suggests that Raman deconvolution procedure may discriminate between hydroxyl and molecular species in water-poor glasses (Table 4). A more extended comparison between high-quality FTIR and Raman data on alkaline glasses is in progress with the aim of better discriminating between compositional and cooling effects and precision of the deconvolution procedure on Raman speciation data.
4.2.2. Water speciation vs. O-H hydrogen bonding strength
In alkali-bearing aluminosilicate glasses both hydroxyl and molecular water experience a broad range of hydrogen bonding strength between them and with the glass network (Wu, 1980, Uchino et al., 1991 and Xue and Kanzaki, 2004). The ratio between weakly and strongly H-bonded O-H increases with the field strength (or electronegativity) of the network modifiers in the order K-Na-Ca-Mg-Al (Wu, 1980) and it decreases with increasing amounts of NBOs in the glass structure. “Free” M-OH groups (i.e., without any bonding to the network) are expected to become important in mafic melts (Xue and Kanzaki, 2004). Increasing H-bonding weakens the O-H bond and in that way decreases the frequency of the O-H stretching vibration. The change of relative areas or intensities of the five identified spectral components as a function of total water content, glass composition and glass structure must, therefore, be interpreted in terms of both coexistence of two different hydrous species (H2Om vs. OH) with variable relative ratios and evolution of their bonding
the question of whether the procedure adopted to deconvolute the total water band in Raman spectra allows discrimination between water species (i.e., OH vs. H2Om) or
whether it fails because this band envelops a continuous spreading of H-bonding strength and distance.
Mysen and Virgo, 1986b and Mysen et al., 1997 suggest a correlation between the intensity of the two contributions in the low frequency side (components I and II; Fig. 6) and both the (alkali + alkali-earth)/silica ratio and the molecular water content of the glass. Specifically, Mysen and Virgo (1986b) report that components I and II are positively correlated with Ca/Si and Na/Si ratios, respectively. Our sets of natural glasses have a much more complex bulk composition than simple CaO–Na2O–SiO2
glasses studied by Mysen and Virgo (1986b). Therefore, it is not straightforward to relate variations of band heights or areas to a specific chemical or structural parameter. As a first order approach, we compare the evolution of band area ratios with the calculated NBO contents of glasses (Fig. 8).
If the deconvolution procedure discriminates between H2Om and OH species, bands
V, IV and III should result from stretching of OH groups with increasing H-bonding. Bands I and II should instead arise from stretching (symmetric and asymmetric) of two groups of molecular water with different strength of H-bonding (Whittington et al., 2001 and Xue and Kanzaki, 2004). In this hypothesis, the ratios between bands V/(IV + III) and II/I should decrease with the increase of strong hydrogen-bond acceptors such as NBOs.
Some observations are compatible with this interpretation. Band V (weakly bond OH) is found only in glasses with very low NBOs (Fig. 8A). In our glass sets, band V is present only in water-poor rhyolite glasses and band IV (moderately bonded OH) progressively decreases with NBOs in all glass sets. Band IV is significantly more important in phonolites and dacites than in rhyolites (alkali-poor glasses). It is worth noting that band IV is more important in Ca, Mg-rich phonolite from Pollena (band IV: 11–14%) than in the alkali-earth poorer phonolite from Pompei (band IV: 6–9%). That is what is expected if high-field strength cations favour the formation of weakly to moderately bonded O-H (Wu, 1980). The area fraction of band III (strongly H-bonded OH, in our hypothesis) increases in rhyolites with NBO < 0.3 and in phonolites, but decreases in rhyolites with NBO > 0.3 and dacite. It is worth noting that all rhyolites (metaluminous, peraluminous and peralkaline) plot on a same trend. The decrease of band III with NBOs and a parallel increase of band II observed in rhyolites and dacite is what one could expect if overlap between bands produced by H2Om and OH
oscillators occurs. This trend is not correlated with ion field strength as dacite have constant alkali content and peralkaline rhyolites contain more Na2O than
metaluminous glasses.
If Bands I and II represent stretching of only tightly and loosely bond H2Om,
respectively, one should expect that band I (strongly H-bonded H2Om) increases with
NBOs. That actually occurs in rhyolites in the NBO range <0.3 and in the dacite and phonolite sets. Conversely, band II increases in rhyolites and decreases in phonolites in the explored NBO ranges. That may suggest that overlap between strongly H-bonded OH and weakly H-bonded H2Om occurs in the wavenumber range attributed to
band II. However, this overlap should result in an underestimation of the hydroxyl content by Raman spectroscopy, and not an overestimation as found in rhyolite and
phonolite glasses (Figs. 7A, C and D). We stress that the procedure of relating the area ratios instead of the intensity ratios to water speciation better accounts for this possible overlap. In conclusion, we infer that our water-rich glass sets actually contain higher OH contents than natural glasses, possibly because of their faster cooling.
4.3. Quantification of total dissolved water content
In Si-rich glasses, the ratios between height (Thomas, 2000) or area (Chabiron et al., 2004) of the 3550 cm−1 (total H2OT) and 490 cm−1 (aluminosilicate network-TOT1)
bands have been reported to linearly correlate with total water content dissolved in the glasses (internal calibration procedure). We individuate at least two different linear trends, one for peraluminous rhyolites and the second for phonolites, and metaluminous and peralkaline rhyolites (Figs. 9A and B). As expected, the best fits are found for series of hydrous glasses having the same major element compositions (i.e., phonolites). Significantly larger scattering is observed in the composite rhyolite glass series. It is worth noting that on height ratios-H2OT diagrams both phonolite
glass series define the same calibration (Figs. 9A and B). Peraluminous rhyolites, that have the highest aspect ratio (Fig. 4B) have also very high height ratios (Figs. 9A and B). Their normalized intensities fall on a calibration line similar to that defined by Thomas (2000) for albite, pegmatite and leucogranite samples (Fig. 9A). In area ratios- H2OT diagrams, only water-poor metaluminous glasses fits on the calibration
curve defined by Chabiron et al. (2004). Our results clearly show that the differences in analytical setting and spectrometer performances (Table 3) have a considerable influence on Raman calibrations.
Calibrations based on area ratios are more composition dependent than those using height ratios (Fig. 9B). This is likely due to (1) influence of glass composition of water speciation and H-bonding strength and therefore band area and (2) larger errors in the determination of band areas relative to determination of band intensities. Moreover, calibrations using area ratios cannot be used for glasses in which the TOT1 band area is not accurately measurable because of the existence of interfering peaks from the embedding medium, as it is the case for the dacite series (Fig. 3C).
Fig. 9. Calibration lines for total water content in hydrous rhyolites, dacites and phonolites glasses. Internal calibration is based on ratios of height (A) or area (B) of the total H2OT ( 3550 cm−1) and
TOT1 bands ( 490 cm−1). TOT1 band area of hydrous dacites cannot be accurately determined due to interference with other bands due to presence of microlites. External normalization of total H2O
band ( 3550 cm−1) height (C) or area (D) to total H
2O band of a glass standard can be preferred
when TOT1 band cannot accurately be measured or for the analysis of chemically heterogeneous samples. This procedure significantly reduces the composition-dependence of calibration lines.
In cases where the TOT1 band cannot be accurately characterized, normalization to the water band of an external standard can be adopted (external calibration procedure; Figs. 9C and D). We choose the peralkaline rhyolite glass SMN 49 (2.5 wt% H2OT) as external standard. This approach results in much lower
composition-dependence of the calibrations (Fig. 10A). In fact, the normalization to a single composition-independent band of an external standard allows defining a reasonable linear correlation even in a highly heterogeneous series such as that of the rhyolites (r2 = 0.96) (Figs. 9C and D). Slight increase in data scattering likely depends on error associated to OH-stretching band measurements and analysis repeatability in several analytical sessions. In fact, it is important to stress that the external procedure is more sensitive to small errors in focusing on the glass surface than the internal one. In this last procedure both TOT1 and H2OT bands are affected
Fig. 10. Comparison between Raman and FTIR, SIMS and EMPA analyses of phonolite-trachyte and dacite glass inclusions from Mt. Vesuvius (Pompei 79 AD), Laacher See and Pico de Orizaba volcanoes. Dotted lines define a deviation of ±0.5 wt% from the 1:1 line. Systematically lower Raman water contents in some glass inclusions are attributed to water-loss subsequent to glass heating and damage during previous microanalysis (SIMS, EMPA) performed before Raman analysis.
We tested the external calibration method on a series of phonolitic–trachytic glass inclusions from Vesuvius (Italy) and Laacher See volcanoes (Germany) and dacite glass inclusions from Pico de Orizaba volcano (Mexico) (Fig. 1; Table 2). All glass inclusions were exposed and polished for Raman analysis. The deviation among Raman data and those collected using other techniques increases as a function total dissolved water content (Fig. 10) and is largest in glasses previously analysed by SIMS. These differences are possibly due to (1) water-loss from glass inclusions during SIMS or EMPA analyses before Raman analyses and (2) scattering from the embedding dry crystal that reduces the intensity of the water band. This last effect cannot be accounted for when using external calibrations. Moreover, large error bars in some inclusions are attributed to heterogeneities at the micrometer scale that the small laser beam can reveal when moving from the core to the rim of the glass inclusion. The large difference observed with the trachytic inclusion cannot be attributed to compositional dependence of the calibrations because trachyte and phonolites fall on a very similar calibration line (Di Muro et al., 2006).
5. Conclusion
Numerous microanalytical techniques have been recently developed for the quantification of water content (SIMS, FTIR, Raman and EMPA) and speciation (FTIR, Raman) in natural glasses. However, due to their high composition dependence, all these techniques must be calibrated. These calibrations critically hinge on standardization procedures which are established using series of glasses of which compositions are as close as possible to the glasses under study. Our data on
natural phonolite, dacite and rhyolite glasses together with data on albite, leucogranite and pegmatite glasses of Thomas (2000), rhyolite glasses of Chabiron et al. (2004), obsidians (Arias et al., 2006) and basaltic melt inclusions (Thomas, 2002) strongly support the reliability of the Raman technique for the quantification of H2O content in synthetic and natural glasses. H2O contents in glass chips or in glass
inclusions in crystals are linearly correlated with the height or the area of the OH-stretching band at 3550 cm−1. Normalization of glass water band intensities to that of an external standard still allows the analysis microcrystalline samples and permit to define calibrations that are faintly composition-dependent. Confocal Raman spectrometry has a very good accuracy (in the best conditions up to 0.1% Thomas, 2000), a good repeatability (<6.5% over periods of months on a broad water range), a moderate sensitivity ( 1000 ppm) and an excellent spatial resolution (1–2 μm) compared to other methods (Devine et al., 1995). Improvement of the analytical procedure to increase the signal/background ratio (background reduction and/or Raman scattering enhancement) should lead to significant improvements of the determination of the 3550 cm−1 band area and thus of H2OT determination.
Comparison of heterogeneous (rhyolites) to homogeneous (phonolites, dacites) silicic glass series clearly evidences the dependence of internal Raman calibration methods on glass peraluminosity. Composition-dependence arises from the control exerted by glass composition and structure on spectral distribution of TOT normalizing bands and total water band. Changes of bulk composition modify the glass structure and are detected by evolution of the low frequency side of the spectrum (Di Muro et al., 2006). Our research shows that, in a given glass group (e.g., phonolites), internal Raman calibrations that uses the TOT1 band are quite insensitive to moderate differences in Ca, Mg or Fe contents. These cations, instead, seem to play a major role in (1) affecting hydroxyl bonding in water-rich samples and (2) modify TOT2 band spectral composition by entry of Fe3+ in the glass network.
Glass composition and structure influence water speciation and bonding environment and therefore the spectral composition of the total water band. In fact, this band is the convolution of distinct scattering contributions from both hydroxyl and molecular water with highly variable hydrogen bonding. Therefore, physical (cooling rate, temperature, pressure) or chemical factors able to modify water speciation and glass structure potentially affect Raman calibrations. The occurrence in glasses of both molecular and hydroxyls with variable H-bond strength must be taken into account to interpret the spectral distribution of total water band in terms of water speciation. Our preliminary results suggest that the adopted deconvoluted procedure might be successful in glasses with low NBOs contents whose amount influences the ratio between weakly and strongly H-bonded water species. In glasses with high NBOs, contributions related to stretching of weakly bond H2Om and strongly H-bond OH may
overlap in the frequency range of band II ( 3450 cm−1).
Application of Raman analytical procedures to natural samples indicates that the main concerns for application of microRaman spectrometry to the study of small glass volumes (glass inclusions, glass filaments) are the confocal performance of the available equipment, and the possible heating and oxidation of the sample. Further studies are needed to assess the applicability of confocal microRaman spectroscopy to iron rich, Si-poor (e.g., basalts, tephrites).
Acknowledgments
A.D.M. has been supported by a Research Training Network fellowship funded by the European Union (Research Training Network on Volcano Dynamics). We are indebted with C. Romano, R. Thomas, H. Behrens and a third anonymous reviewer for their insightful comments that stimulated a critical review of a first version of this paper. R. Cioni and G. Carrasco are acknowledged for providing glass inclusions of the 79 AD. Vesuvius and Citlaltepetl fall eruptions respectively. Special acknowledgments for V. Sharygin and S. Kovyazin (Institute of Mineralogy and Petrography, Novosibirsk, Russia) S. Simakin and E. Potapov (Institute of Microelectronics, Yaroslavl’, Russia) for the EMPA and SIMS analyses of Laacher See melt inclusions. Thanks to A. Michel for performing the hydrogen manometry and halogen analyses of rhyolite glasses.
References
Arias et al., 2006 A. Arias, M. Oddone, G. Bigazzi, A. Di Muro, C. Principe and P. Norelli, New data for the characterisation of Milos obsidians, J. Radioanal. Nuclear
Chem. 268 (2006) (2), pp. 371–386.
Brawer and White, 1977 S.A. Brawer and W.B. White, Raman spectroscopic investigation of the structure of silicate glasses, II. Soda-alkaline earth-alumina ternary and quaternary glasses, J. Non-Cryst. Solids 23 (1977), pp. 261–278.
Carroll and Blank, 1997 M.R. Carroll and J.G. Blank, The solubility of H2O in
phonolitic melts, Am. Mineral 82 (1997), pp. 549–556.
Chabiron et al., 2004 A. Chabiron, J. Pironon and D. Massare, Characterization of water in synthetic rhyolitic glasses and natural melt inclusions by Raman spectroscopy, Contrib. Miner. Petrol. 146 (2004), pp. 485–492.
Chen et al., 2004 J. Chen, H. Zheng, W. Xiao, Y. Zg and K. Weng, Raman spectroscopic study of CO2-NaCl-H2O mixtures in synthetic fluid inclusions at thigh
temperatures, Geochim. Cosmochim. Acta 68 (2004), pp. 1335–1360.
Chou et al., 1990 I.M. Chou, J.D. Pasteris and J.C. Seitz, High-density volatiles in the system C-O-H-N for the calibration of a laser Raman microprobe, Geochim.
Cosmochim. Acta 54 (1990), pp. 535–543.
Cioni, 2000 R. Cioni, Volatile content and degassing processes in the AD 79 magma chamber at Vesuvius, Contrib. Miner. Petrol. 140 (2000), pp. 40–54.
de Faria et al., 1997 D.L.A. de Faria, S. Venâncio Silva and M.T. de Oliveira, Raman microspectroscopy of some iron oxides and oxyhydroxides, J. Raman Spectrosc. 28 (1997), pp. 873–878.
Devine et al., 1995 J.D. Devine, J.E. Gardner, H.P. Brack, G.D. Layne and M.J. Rutherford, Comparison of microanalytical methods for estimating H2O contents of
Di Muro et al., 2004 A. Di Muro, A. Neri and M. Rosi, Contemporaneous convective and collapsing eruptive dynamics: The transitional regime of explosive eruptions,
Geophys. Res. Lett. 31 (2004), p. L10607
Di Muro et al., 2006 Di Muro, A., Giordano, D., Villemant, B., Montagnac, G., Romano, C., 2006. Influence of composition and thermal history of volcanic glasses on water content determination by microRaman spectrometry. Appl. Geochem. in press.
Dubessy et al., 1989 J. Dubessy, B. Poty and C. Ramboz, Advances in C-O-H-N-S fluid geochemistry based on micro-Raman spectrometric analysis of fluid inclusions,
Eur. J. Miner. 1 (1989), pp. 517–534.
Furukawa et al., 1981 T. Furukawa, K.E. Fox and W.B. White, Raman spectroscopic investigation of the structure of silicate glasses, III. Raman intensities and structural units in sodium silicate glasses, J. Chem. Phys. 75 (1981), pp. 3226–3237.
Gottsmann and Dingwell, 2001 J. Gottsmann and D.B. Dingwell, The cooling of frontal flow ramps: a calorimetric study on the Rocche Rosse rhyolite flow, Lipari, Aeolian Islands, Italy, Terra Nova 13 (2001), pp. 157–164.
Ihinger et al., 1994 Ihinger, P.D., Hervig, R.L., McMillan, P.F., 1994. Analytical methods for volatiles in glasses. In: Carrol, M., Holloway, J.R. (Eds). Rev. Min. 30, 67–121.
Kohn et al., 1992 S.C. Kohn, R. Dupree and M.G. Mortuza, The interaction between water and aluminosilicate magmas, Chem. Geol. 96 (1992), pp. 399–409.
McMillan, 1984 P.F. McMillan, Structural studies of silicate glasses and melts: applications and limitations of Raman spectroscopy, Am. Miner. 69 (1984), pp. 622– 644.
McMillan and Remmele, 1986 P.F. McMillan and R.L. Remmele, Hydroxyl sites in SiO2 glass: a note on infrared and Raman spectra, Am. Miner. 71 (1986), pp. 772–
778.
Michel and Villemant, 2003 A. Michel and B. Villemant, Determination of halogens (F, Cl, Br, I), sulfur and water in seventeen geological reference materials, Geost. News
27 (2003), pp. 163–171.
Mysen et al., 1980 B.O. Mysen, D. Virgo, W.J. Harrison and C.M. Scarfe, Solubility mechanisms of H2O in silicate melts at high pressures and temperatures: A Raman spectroscopic study, Am. Miner. 65 (1980), pp. 900–914.
Mysen and Virgo, 1986a B.O. Mysen and D. Virgo, Volatiles in silicate melts at high pressure and temperature. 2. Water in melts along the join NaAlO2-SiO2 and a
comparison of solubility mechanisms of water and fluorine, Chem. Geol. 57 (1986), pp. 333–358.
Mysen and Virgo, 1986b B.O. Mysen and D. Virgo, Volatiles in silicate melts at high pressure and temperature. 1. Interaction between OH groups and Si4+, Al3+, Ca2+,
Na+ and H+, Chem. Geol. 57 (1986), pp. 303–331.
Mysen, 1988 B.O. Mysen, Structure and properties of silicate melts, Elsevier, Amsterdam (1988).
Mysen, 1990 B.O. Mysen, Interaction between water and melt in the system CaAl2O4-SiO2-H2O, Chem. Geol. 88 (1990), pp. 223–243.
Mysen et al., 1997 B.O. Mysen, F. Holtz, M. Pichavant, J.-M. Beny and J.-M. Montel, Solution mechanisms of phosphorous in quenched hydrous and anhydrous granitic glass as a function of peraluminosity, Geochim. Cosmochim. Acta 61 (1997), pp. 3913–3926.
Neuville and Mysen, 1996 D.R. Neuville and B.O. Mysen, Role of aluminium in the silicate network: in situ, high-temperature study of glasses and melts on the join SiO2
-NaAlO2, Geochim. Cosmochim. Acta 60 (1996), pp. 1727–1737.
Newman et al., 1986 S. Newman, E.M. Stolper and S. Epstein, Measurement of water in rhyolitic glasses: calibration of an infrared spectroscopic technique, Am.
Miner. 71 (1986), pp. 1527–1541.
Newman et al., 1988 S. Newman, S. Epstein and E. Stolper, Water, carbon dioxide, and hydrogen isotopes in glasses from the ca. 1340 A.D. eruption of the mono craters, California: constraints on degassing phenomena and initial volatile content, J.
Volcanol. Geotherm. Res. 35 (1988), pp. 75–96.
Nowak and Behrens, 1995 M. Nowak and H. Behrens, The speciation of water in haplogranitic glasses and melts determined by in sity near-infrared spectroscopy,
Geochim. Cosmochim. Acta 59 (1995), pp. 3445–3450.
Nowak and Behrens, 2001 M. Nowak and H. Behrens, Water in rhyolitic magmas: getting a grip on a slippery problem, Earth Planet. Sci. Lett. 184 (2001), pp. 515–522. Ohlhorst et al., 2001 S. Ohlhorst, H. Behrens and F. Holtz, Compositional dependence of molar absorptivities of near-infrared OH- and H2O bands in rhyolitic to
basaltic glasses, Chem. Geol. 174 (2001), pp. 5–20.
Pandya et al., 1992 N. Pandya, D.W. Muenow and K.S. Shiv, The effect of bulk composition on the speciation of water in submarine volcanic glasses, Geochim.
Cosmochim. Acta 56 (1992), pp. 1875–1883.
Pasteris et al., 1996 Pasteris, J.D., Wopenka, B., Wang, A., Harris, T.N., 1996. Relative timing of fluid and anhydrite saturation: another consideration in the sulfur budget of the Mount Pinatubo eruption. In: Newhall, C.G., Punongbayan, R.S. (Eds). Fire and Mud: Eruptions and Lahars of Mount Pinatubo, Philippines. University of Washington Press, Seattle, Washington, pp. 687–731.