Absorption of lower hybrid waves in the
scrape off layer of a diverted tokamak
The MIT Faculty has made this article openly available.
Please share
how this access benefits you. Your story matters.
Citation
Wallace, G. M. et al. “Absorption of Lower Hybrid Waves in the
Scrape Off Layer of a Diverted Tokamak.” Physics of Plasmas 17.8
(2010)
As Published
http://dx.doi.org/10.1063/1.3465662
Publisher
American Institute of Physics
Version
Final published version
Citable link
http://hdl.handle.net/1721.1/67355
Terms of Use
Article is made available in accordance with the publisher's
policy and may be subject to US copyright law. Please refer to the
publisher's site for terms of use.
Absorption of lower hybrid waves in the scrape off layer
of a diverted tokamak
G. M. Wallace,1R. R. Parker,1P. T. Bonoli,1A. E. Hubbard,1J. W. Hughes,1 B. L. LaBombard,1 O. Meneghini,1 A. E. Schmidt,1 S. Shiraiwa,1 D. G. Whyte,1 J. C. Wright,1S. J. Wukitch,1R. W. Harvey,2A. P. Smirnov,2and J. R. Wilson3
1
MIT Plasma Science and Fusion Center, Cambridge, Massachusetts 02139, USA
2
CompX, Del Mar, California 92014, USA
3
Princeton Plasma Physics Laboratory, Princeton, New Jersey 08543, USA
共Received 24 February 2010; accepted 11 June 2010; published online 20 August 2010兲
The goal of the Lower Hybrid Current Drive 共LHCD兲 system on the Alcator C-Mod tokamak 关Hutchinson et al., Phys. Plasmas 1, 1511 共1994兲兴 is to investigate current profile control under plasma conditions relevant to future tokamak experiments. Experimental observations of a LHCD “density limit” for C-Mod are presented in this paper. Bremsstrahlung emission from relativistic fast electrons in the core plasma drops suddenly above line averaged densities of 1020 m−3 共/
LH
⬃3–4兲, well below the density limit previously observed on other experiments 共/LH⬃2兲.
Electric currents flowing through the scrape off layer共SOL兲 between the inner and outer divertors increase dramatically across the same density range that the core bremsstrahlung emission drops precipitously. These experimental x-ray data are compared to both conventional modeling, which gives poor agreement with experiment above the density limit and a model including collisional absorption in the SOL, which dramatically improves agreement with experiment above the observed density limit. These results show that strong absorption of LH waves in the SOL is possible on a high density tokamak and the SOL must be included in simulations of LHCD at high density. © 2010 American Institute of Physics.关doi:10.1063/1.3465662兴
I. INTRODUCTION
The Lower Hybrid Current Drive 共LHCD兲 system1 on the Alcator C-Mod tokamak2is designed to investigate cur-rent profile control under plasma conditions relevant to ITER 共Ref.3兲 and other future tokamaks. The efficiency of LHCD
is predicted to scale with the inverse of the electron density,4 however, LHCD experiments on many tokamaks5–7have ob-served a drop in efficiency steeper than 1/neabove a critical
density. The critical density associated with reduced current drive in C-Mod is unique in that it occurs at a value signifi-cantly lower than what would have been expected based on prior LHCD experiments. This paper presents experimental results and analysis from the Alcator C-Mod LHCD experi-ment suggesting that interactions between LH waves and the SOL plasma can have a substantial impact on the operational effectiveness of a LHCD system in high density ohmic discharges.8
LH waves drive current by transferring momentum and energy from the wave to electrons traveling along the mag-netic field with velocities near the parallel phase velocity of the wavev储through Landau damping, creating an
asymmet-ric plasma resistivity. The resulting current drive efficiency is inversely proportional to the plasma electron density neand
the square of the parallel refractive index, n储⬅ck储/.4,9
Wave accessibility and parametric decay instabilities5,10 共PDI兲 have been suggested as possible explanations for the density limits observed on previous LHCD experiments. Considering only the accessibility criterion,11,12any wave for which n储is greater than n储,critwill be able to penetrate to the
core of the plasma, provided that the wave is not fully ab-sorbed in the edge region first. Here,
n储crit⬇
冑
1 − pi2 2 + pe2 ce2 + pe 兩ce兩 . 共1兲LH 共slow兲 waves for which the launched n储 is locally less
than the critical value given by Eq. 共1兲 anywhere in the plasma will be mode converted to the fast wave at the point where n储= n储crit and reflected back to the plasma edge. It is
important to note that this discussion of wave accessibility ignores possible changes to n储 that can occur along the ray
path. This effect is taken into account in the simulations that are discussed later in this paper.
PDI13,14 is a three wave coupling process by which an incident lower hybrid wave at a frequency=0decays into
a low frequency branch, at=1⬃ciⰆ0, and a daughter
LH wave, at =0−1. The wavenumber of the daughter
LH wave may upshift substantially, thereby reducing the cur-rent drive efficiency. If the upshift of n储is severe enough, the
daughter wave may damp on ions as well. Results from the Alcator C tokamak15 indicate a density limit for efficient current drive at0/LH⬃2.5Here
LH
2 ⬇ pi
2
1 +pe2 /ce2
共2兲
is the lower hybrid frequency. Because LH increases with
magnetic field and density, parametric decay is of particular importance on high density, high field experiments such as Alcator C.
共2010兲
The propagation and absorption of LH waves is treated in this paper by use of the ray tracing and Fokker–Planck codesGENRAY共Ref.16兲 andCQL3D.17TheGENRAYray trac-ing package makes use of the Wentzel–Kramers–Brillouin 共WKB兲 and geometrical optics approximations to represent waves as packets of photon energy traversing through the plasma. A series of rays are launched to approximate the wave-number spectrum produced by a three-dimensional an-tenna structure. Each ray is independently followed through the plasma until it reaches a damping threshold, at which point the ray is terminated. The effects of wave accessibility, including variation of n储 along the ray, are included in the
code. The output of GENRAY is passed to the bounce-averaged Fokker–Planck solver CQL3Dto calculate the per-turbed electron distribution function. The perper-turbed distribu-tion funcdistribu-tion calculated byCQL3Dis then used to recalculate
the wave damping in GENRAY, and this process is iterated
until the result converges.
II. EXPERIMENTAL RESULTS
The LHCD antenna on Alcator C-Mod consists of a 4 row by 22 column waveguide phased array operating at a frequency of 4.6 GHz.1 By varying the relative phase be-tween adjacent waveguides, the peak of the launched n储
spec-trum can be varied from⬃1 to 4 in both the current drive and countercurrent drive directions. A 32-chord poloidally viewing Hard X-Ray共HXR兲 diagnostic on C-Mod 共Ref.18兲
is used both for localizing the fast electron bremsstrahlung emission and for comparing the relative magnitude of the x-ray count rate between discharges. The HXR count rate can also be taken as a proxy for the density of the fast
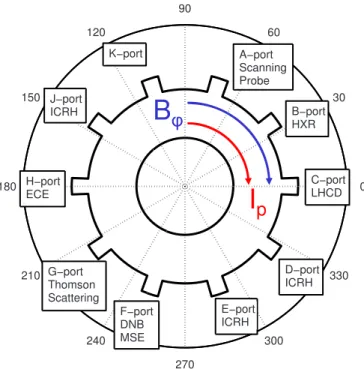
elec-tron tail generated by LHCD, although they are not directly proportional. The locations of the LHCD launcher and HXR camera relative to other systems on the tokamak are shown in Fig.1.
By observing the decrease in HXR emission as the plasma density was increased, it was determined that LH waves are not absorbed in the core of C-Mod L-mode plas-mas at line averaged densities above n¯e⬃1⫻1020 m−3.
Ad-ditionally, electric currents and electron density in the scrape off layer共SOL兲 increase during LHCD above this same den-sity threshold. These observations suggest a shift of wave absorption from inside the separatrix into the SOL at high density.
Unless otherwise noted, the data presented in this paper are from Ohmic L-mode discharges in deuterium at typical C-Mod parameters 共B= 5.4– 7 T , Ip= 0.8– 1.1 MA兲. In
or-der to cover the largest number of experimental conditions with the number of discharges available, the plasma density was ramped throughout each discharge. Figure2 shows the time evolution of several key plasma parameters during a typical ramped L-mode discharge. Ramps up and down in density were performed to verify that there was no hysteresis in the density scans.
A. Hard x-ray bremsstrahlung
Since the thermalization rate of the fast electrons due to collisions is proportional to plasma density, it follows that, for a fixed source of fast electrons in an otherwise uniform plasma, the fast electron population should be inversely proportional to plasma density. A scaling of current drive efficiency proportional to 1/ne is predicted based on the
increase of collisionality with density.4This scaling is con-firmed by simulations which will be discussed later in this
30 210 60 240 90 270 120 300 150 330 180 0 E−port ICRH G−port Thomson Scattering H−port ECE C−port LHCD B−port HXR A−port Scanning Probe K−port J−port ICRH F−port DNB MSE D−port ICRH
B
φ
I
p
FIG. 1.共Color online兲 Location of the C-Mod LHCD launcher 共at C-port兲, HXR camera 共at B-port兲, and selected heating and diagnostic systems. Lower hybrid waves are primarily launched from C-port toward B-port in current drive operation. The direction of both the plasma current and toroi-dal magnetic field are clockwise when viewed from above.
0.5 1 1.5 x 10²⁰ [m −3 ] 0 500 [kW] 0 5 [keV] 0 0.5 [a.u.] 0.6 0.7 0.8 0.9 1 1.1 1.2 1.3 −1.5 −1 −0.5 0 V loop [V ] Time [s] ne0 ne,avg PLH Thomson Te0 ECE Te0 2π Bolometer HXR Chords 9−24
FIG. 2. 共Color online兲 Time evolution of several key plasma parameters during a ramped density L-mode discharge with high power LHCD. Dis-agreement between the Thomson scattering and ECE temperature measure-ments from 0.7 to 1 s is due to nonthermal ECE emission. Shot number = 1080429017.
paper. Figure3shows that the experimental HXR count rates fall much more steeply than the expected 1/ne above n
¯e⬃0.9⫻1020 m−3.8 This is particularly true for the 5.4 T,
800 kA case, which deviates from the 1/ne curve starting
near n¯e= 7⫻1019 m−3. The HXR count rates at higher
mag-netic field and plasma current drop more slowly as density rises, but are still two orders of magnitude lower than the 1/neprediction at n¯e= 1.5⫻1020 m−3.
The count rates shown in Fig.3have been normalized to the magnitude of the wave electric field共square root of net LH power兲. The data represent a range of net LH power from 550 to 900 kW. The square root of LH power scaling is used here as it leads to the tightest grouping of the experimental data.
Although a violation of the accessibility criterion above 1⫻1020 m−3 may appear to explain the results of Fig. 3, there are several points which contradict the accessibility cri-terion explanation. First, the data taken at n储= 2.3 共closed
symbols兲 and the data taken at n储= 1.9共open symbols兲 do not
show a significant difference in count rate as the density changes. If the loss of core bremsstrahlung emission was related to the accessibility criterion, one would expect the lower value of n储to be affected more severely and at a lower
density than the higher value of n储. The two sets of data are
nearly coincident across a range of density, magnetic field, and plasma current. In addition, the accessibility criterion is satisfied at both n储 of 1.9 and 2.3, even for the highest
density shown in Fig. 3 at the lowest magnetic field. Figure4 shows the bremsstrahlung emissivity as a function of n储crit− n储launch. The value of n储critis evaluated based on the
line averaged density and on axis magnetic field. According to results from FTU,19 accessibility should only be an issue for n储crit− n储launch⬎0.05 when calculated in this manner.
The density limit observed on Alcator C has been attributed to PDI as →2LH.5–10,13,14 LHCD efficiencies
proportional to 1/n¯ewith strong nonthermal electron
cyclo-tron emission 共ECE兲 and HXR emission were observed on Alcator C up to n¯e= 1020 m−3.20 The Alcator C results were
obtained at high toroidal field 共B⬃8–10 T兲 in hydrogen plasmas such that /LH⬃2 at n¯e= 1020 m−3. The
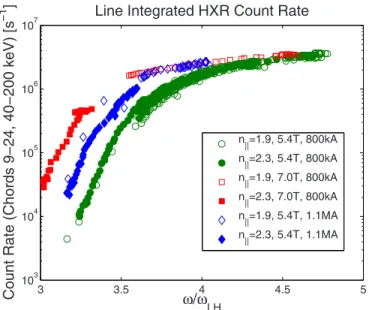
brems-strahlung data from C-Mod show a precipitous drop in emis-sion below/LH⬃3.75, as can be seen from Fig.5. All of the data from C-Mod occur at values of/LHin excess of 3, for which there should be no significant parametric decay according to earlier results. The discrepancies between the data at 5.4 and 7.0 T show that although the experimental bremsstrahlung emission scales as a function of/LHat a given value of magnetic field, comparisons between different values of magnetic field at a fixed density do not agree with the/LH scaling. An increase in magnetic field will
0.4 0.6 0.8 1 1.2 1.4 1.6 x 10²⁰ 103 104 105 106 107 n e[m −3 ] Count Rate (Chords 9−24, 40−200 keV) [s −
1 ] Line Integrated HXR Count Rate
n ||=1.9, 5.4T, 800kA n ||=2.3, 5.4T, 800kA n||=1.9, 7.0T, 800kA n||=2.3, 7.0T, 800kA n||=1.9, 5.4T, 1.1MA n||=2.3, 5.4T, 1.1MA
FIG. 3.共Color online兲 Line integrated x-ray emission on the central chords as a function of line averaged density. Data are plotted on a semilogarithmic scale for x-rays between 40 and 200 keV. The black curve represents a 1/ne
falloff. The count rates in this figure are normalized to the square root of net LH power. −1 −0.5 0 0.5 103 104 105 106 107
Line Integrated HXR Count Rate
n ||crit−n||launch Count Rate (Chords 9−24, 40−200 keV) [s − 1 ] n ||=1.9, 5.4T, 800kA n ||=2.3, 5.4T, 800kA n ||=1.9, 7.0T, 800kA n ||=2.3, 7.0T, 800kA n ||=1.9, 5.4T, 1.1MA n ||=2.3, 5.4T, 1.1MA
FIG. 4. 共Color online兲 Fast electron bremsstrahlung emission as a function of n储crit− n储launch. The value of n储critis evaluated using line averaged density
and on-axis magnetic field.
3 3.5 4 4.5 5 103 104 105 106 107
Line Integrated HXR Count Rate
ω/ωLH Count Rate (Chords 9−24, 40−200 keV) [s − 1 ] n||=1.9, 5.4T, 800kA n||=2.3, 5.4T, 800kA n||=1.9, 7.0T, 800kA n ||=2.3, 7.0T, 800kA n ||=1.9, 5.4T, 1.1MA n ||=2.3, 5.4T, 1.1MA
FIG. 5.共Color online兲 Fast electron bremsstrahlung as a function of/LH at BT= 5.4 and 7.0 T.LHis computed using line averaged electron density
increase the value ofLH, but the data show an increase in
HXR emission at a fixed density for the higher field. The discrepancy seen in Fig. 5 between the 5.4 and 7.0 T data shows that bremsstrahlung emission is a function of density, not/LH. This indicates that /LH is not the
critical parameter for the density limit observed on C-Mod. The microwave spectrum in the vicinity of the pump frequency was recorded for several of the discharges shown in Fig. 5 by measuring the microwave frequency spectrum picked up by a probe mounted between two rows of the LH launcher. The PDI level is defined here as the amplitude of the pump wave minus the amplitude of the strongest down-shifted sideband measured in decibels, as shown schemati-cally in Fig.6. This gives a relative measure of the strength of the parametric decay instabilities. Although the PDI level rises with line averaged density, at the highest densities共and consequently lowest values of /LH兲, the strongest
side-band is at least⫺20 dB relative to the pump, corresponding to less than 1% of the total power.
It is important to note that the measurement location for PDI is in close proximity to the LH launcher and the relative magnitude of the downshifted sideband may be higher away from the launcher. However, we have observed PDI levels as high as⫺10 dB relative to the pump wave in the same lo-cation on C-Mod at higher density 共n¯e⬎2⫻1020 m−3兲,21
where strong PDI would be expected. Therefore, we consider this to be a reliable measurement.
Experiments on the FTU LHCD experiment6 indicate that parametric decay can contribute to a loss of LHCD ef-ficiency under conditions of high density and low tempera-ture in the SOL. The PDI signatempera-ture in the FTU experiment is seen through broadening of the pump wave as opposed to discrete downshifted harmonics of the ion cyclotron fre-quency seen on C-Mod. On C-Mod we see extremely small increases in pump width as density rises 共less than 25% increase in width at⫺20 dB and no observable change
at⫺10 dB between 5⫻1019 and 1.5⫻1020 m−3兲, which is inconsistent with the severe spectral broadening needed to explain the observed density limit.
B. Scrape-off-layer currents
Langmuir probes mounted in the upper and lower di-vertor regions of C-Mod are typically operated in a swept
I-V configuration for measurement of electron density and
temperature. As the potential difference between the probe and the vacuum vessel wall passes through zero, the “ground current” collected by the probe, Ignd, can be measured. This
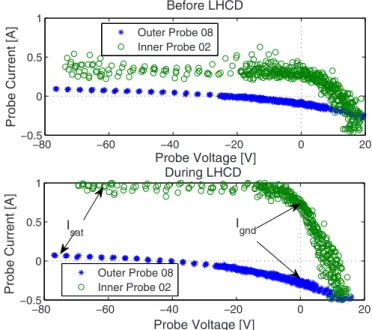
current is equal to the free flowing current into the wall par-allel to the magnetic field. Figure7 shows the point on the
I-V characteristic where Igndis measured for two probes
be-fore and during a high power LHCD pulse. The convention taken here is that a positive current will be measured if the probe is collecting ions. Since the geometry of the probe is known, the parallel current density incident on the probe can be determined from the current collected by the probe based on the angle of incidence of the field line and the radius of the probe electrode. Figure 8 shows the location of the C-Mod divertor Langmuir probes.
In normal operation, the parallel electric current in the SOL, J储, measured by the divertor probes is less than
⬃1⫻105 A/m2 and of similar magnitude on all of the
probes. During high power LH operation at line averaged densities above ⬃1⫻1020 m−3, the magnitude of J
储
mea-sured by some probes increases dramatically. In upper null discharges, the current flows between the inner and outer sections of the upper divertor. The polarity difference be-tween the inner and outer divertors indicates that the current is leaving the upper inner divertor, traveling around the bot-tom of the plasma, and returning to the vacuum vessel wall on the upper outer divertor in upper single null共USN兲. When
4.5 4.55 4.6 4.65 x 10⁹ −80 −70 −60 −50 −40 −30 −20 −10 Frequency [Hz] A mp litu d e [dB m ] PDI Level −20 dB Width
FIG. 6. 共Color online兲 Frequency spectrum measured by a spectrum ana-lyzer connected to an RF probe located on the midplane at C-port. The “PDI level” and “⫺20 dB width” are shown schematically.
−80 −60 −40 −20 0 20 −0.5 0 0.5 1 Probe Voltage [V] Probe Current [A] Before LHCD −80 −60 −40 −20 0 20 −0.5 0 0.5 1 Probe Voltage [V] Probe C urrent [A ] During LHCD Outer Probe 08 Inner Probe 02 Outer Probe 08 Inner Probe 02 I sat Ignd
FIG. 7. 共Color online兲 I-V characteristic for Langmuir probes mounted in the inner and outer lower divertors before and during high power LHCD. The ground current Igndand the ion saturation current Isatare shown. Both
projected in the toroidal direction, this corresponds to the same direction as the current in the confined plasma, Ip, if we
assume that the SOL current is traveling parallel to the mag-netic field. In the lower single null共LSN兲 configuration, the current leaves the lower outer divertor and flows toward the lower inner divertor. Near double null, the currents some-times flow from the lower outer divertor to the upper outer divertor. Figure9 shows the waveforms of the SOL currents in an USN discharge near double null. The two probes, which lie on approximately the same flux surface, measure values of Igndwhich are nearly equal in magnitude but
oppo-site in polarity. Again, this is the same direction as Ip. Figure 8shows the direction of the SOL currents as projected onto the poloidal cross section for both upper and lower null con-figurations. The direction of the SOL currents does not change when the launched n储 direction is reversed,
suggest-ing that a Landau interaction between the LH waves and the SOL plasma is not responsible for the currents.
Figure 10 shows the SOL current density for the USN discharges in Fig. 3 as a function of line averaged density. The SOL currents suddenly increase in magnitude at
n
¯e⬃1.0⫻1020 m−3, the same density at which fast electron
bremsstrahlung disappears from the central HXR chords. En-hanced SOL currents during high power LHCD have been observed in LSN as well. This suggests that at high density the LH waves are absorbed in the SOL rather than inside the separatrix.
Collisionally damped lower hybrid waves have been ob-served to drive current on open field lines where k储vt/Ⰶ1
in the linear H-1 device.22An upper limit on the driven cur-rent can be obtained by assuming that E储共z兲 is a constant.
This assumption reduces Eq. 3 of Ref.22to
1 14 1 16 1 10 Bt Ip Jsol Bt Ip Jsol
FIG. 8.共Color online兲 Direction of the SOL currents projected on the po-loidal cross section for USN and LSN. In both configurations the SOL current flows in the same toroidal direction as Band Ip. The detailed insets
show the location of the upper and lower probes relative to the separatrix in upper null and lower null, respectively. Probes are numbered sequentially for the inner, outer, and upper divertors.
0.6 0.7 0.8 0.9 1 1.1 1.2 1.3 0 500 1000 LH Net Power [kW ] 0.6 0.7 0.8 0.9 1 1.1 1.2 1.3 0 0.2 0.4 Upper 11 I gnd [A] 0.6 0.7 0.8 0.9 1 1.1 1.2 1.3 −0.4 −0.2 0 Outer 09 I gnd [A] 0.6 0.7 0.8 0.9 1 1.1 1.2 1.3 1 1.5 x 10²⁰ n e [m −3 ] Time [s]
FIG. 9. 共Color online兲 Waveform of SOL currents observed during LHCD experiments at high density in upper single null共near double null兲. Modu-lation of the SOL currents with LHCD power is evident during trips at the end of the LH pulse. The largest SOL currents connect between probe 11 in the upper divertor and probe 9 in the lower outer divertor for this discharge. For this discharge launch⬃0.025 m and probe⬃0.015 m. Shot number
= 1080513019. 0.4 0.6 0.8 1 1.2 1.4 1.6 x 10²⁰ 0 1 2 3 4 5 6 7x 10 5 n e[m −3 ] SOL Current Density [A/m 2 ] n||=1.9, 5.4T, 800kA n ||=2.3, 5.4T, 800kA n ||=1.9, 7.0T, 800kA n ||=2.3, 7.0T, 800kA n ||=1.9, 5.4T, 1.1MA n||=2.3, 5.4T, 1.1MA
FIG. 10. 共Color online兲 Peak SOL current density as a function of line averaged density in USN L-mode discharges, as measured by the outer upper divertor Langmuir probes. Data at n储= 2.3 show significantly more
current than data at n储= 1.9. SOL currents are strongest for smaller values of
具j储典 = − 4.5978 ⫻ 10−11 q me pe2 3k储兩E储兩 2. 共3兲
The wave electric fields in the SOL of C-Mod are estimated to be⬃10 kV/m for a net LH power of 900 kW. At a den-sity of 1⫻1019 m−3, a parallel current density of 236 A/m2
would result. Even if the estimates of the wave electric fields in the SOL are too low by a factor of 10, the observed cur-rent is still far too large to be explained by direct curcur-rent drive via collisional absorption of the LH waves.
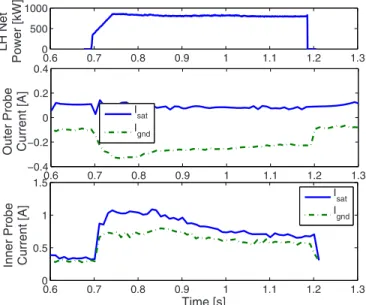
Figure11shows the values of ion saturation current, Isat
and Ignd, for probes on the inner and outer divertor surfaces
in a lower single null discharge. On the ion-collecting end of the flux tube共which in LSN is the inner divertor兲, there is a substantial increase in Isatduring LHCD. Interestingly, there
is no corresponding change in Isat at the electron collecting
end of the flux tube共which in LSN is the outer divertor兲. On the end of the field line which collects ions, 兩Ignd兩 cannot exceed兩Isat兩, and the ratio 兩Ignd/Isat兩 is near 0.8 with and with-out LHCD. On the end of the field line collecting electrons, 兩Ignd兩 would be limited by the electron saturation current.
However, the electron saturation current is larger in magni-tude than兩Isat兩 by roughly the ratio of the deuteron mass to the electron mass. Consequently兩Ignd兩 may easily exceed 兩Isat兩
on the electron collecting end of the field line.
The increase in the SOL current appears to be due to an increase in density, and thus Isat, at the ion-collecting end of
the field line. The increase in Isatthen allows the SOL current
共which cannot exceed Isatat the ion-collecting end of the flux
tube兲 to increase as well. The driving mechanism of the SOL current is consistent with a thermoelectric current23,24 flow-ing from the hotter, less dense electron collectflow-ing divertor plate to the colder, denser ion-collecting divertor plate. The temperature and density asymmetry on the ion and electron collecting divertors can be inferred from the shapes of the
I-V curves in Fig.7.
We hypothesize that the increase of plasma density at the ion-collecting divertor plate may be caused by a transition from a partially detached divertor regime to a sheath-limited or high-recycling divertor regime.25 The change in divertor behavior is likely caused by an additional source of power in the detached region共i.e., parasitic absorption of LHCD in the SOL as supported by the modeling in this section兲. LH waves absorbed in the SOL may also contribute to an increase in ionization rate for neutrals in the divertor region. The change in recycling conditions and increase in ionization would lead to higher ion saturation current on the ion-collecting end of the field line, which then supports a higher thermoelectric SOL current.
10 eV is a typical temperature for the region of the SOL where the enhanced currents are observed during LHCD. At this temperature the resistivity of the SOL plasma is 6.5⫻10−5 ⍀ m. Joule’s law can be used to estimate the
re-sistive power dissipated in the SOL. If we take the current to be evenly distributed in a 1 cm thick annulus surrounding the separatrix 共based on the characteristic radial width of the SOL currents observed on the divertor Langmuir probes兲, this results in a dissipated resistive heating power of approxi-mately 850 kW, which is similar in magnitude to the total injected LH power in these discharges. This suggests that a large fraction of the injected LH power may be transferred into supporting the SOL currents. The estimated total current in the SOL during LHCD is ⬃20 kA, again assuming that the current is evenly distributed in a 1 cm thick annulus surrounding the separatrix.
III. SIMULATION OF WAVE BEHAVIOR
The discharges discussed in Sec. II have been modeled with the ray tracing/Fokker–Planck packageGENRAY/CQL3D
to determine if the experimentally observed reduction in the core fast electron bremsstrahlung would be predicted based on conventional modeling techniques. The GENRAY/CQL3D
code package includes a fast electron bremsstrahlung x-ray synthetic diagnostic that can be directly compared with the experimental HXR results in Sec. II A. Figure12shows the measured and simulated bremsstrahlung emission for a range of plasma parameters. The simulated HXR emission is cal-culated based on a net LH power of⬃800 kW, which was the power level used in the normalization of the experimental results shown in Fig. 3. The simulations use experimental profiles of plasma density and temperature, along with ex-perimental values of toroidal electric field and Zefffrom the same discharges plotted in the experimental HXR data. Al-though the cutoff for LH waves is located outside the sepa-ratrix in the experiment, an artificial cutoff is imposed just inside the separatrix in the conventional version of this model.
The simulated emission at values of n¯e between
5⫻1019 and 1⫻1020 m−3 is higher than the experimental
data by a factor of⬃5, while at 1.5⫻1020 m−3 the
discrep-ancy is two to three orders of magnitude. However, the simu-lated emissivity is in qualitative agreement with the 1/ne
estimate. As with the experimental data, the simulations pre-dict nearly identical emissivity for n储values of 1.9 and 2.3.
0.6 0.7 0.8 0.9 1 1.1 1.2 1.3 0 500 1000 LH Net Power [kW ] 0.6 0.7 0.8 0.9 1 1.1 1.2 1.3 −0.4 −0.2 0 0.2 0.4 Outer Probe Current [A] 0.6 0.7 0.8 0.9 1 1.1 1.2 1.3 0 0.5 1 1.5 Inner Probe Current [A] Time [s] I sat I gnd I sat I gnd
FIG. 11. 共Color online兲 Comparison of Igndand Isaton divertor probes in
LSN configuration. Ignd on the inner divertor is near the limit set by Isat,
Figure 13 shows the simulated ray trajectories for a 5.4 T, 800 kA plasma at n¯e= 1.4⫻1020 m−3. The simulated
ray trajectories in high density 共n¯eⱖ1⫻1020 m−3兲
dis-charges show that some of the rays are trapped in the edge region of the plasma immediately after launch due to mar-ginal wave accessibility. These “trapped” rays reflect be-tween the cutoff at the plasma edge and the high density mode conversion layer until n储upshifts sufficiently for
pen-etration into the core.
GENRAY has been used to investigate the strength of
single-pass damping for the simulated discharges. Stopping all rays immediately after a single radial transit共i.e., one pass from the antenna into the plasma and out to the separatrix兲 decreases the simulated HXR emission by four orders of magnitude at 1.5⫻1020 m−3, and by more than two orders of
magnitude at 5⫻1019 m−3. This shows that single-pass
damping is weak in these relatively cold discharges, even at the low density end of the scan. We must properly account for what happens to the rays as they reflect from, or are absorbed at, the edge of the plasma. For the synthetic diag-nostic HXR emissivity to agree fully with the experimental data, some amount of reflection from the cutoff must be taken into account, but there also must be some loss mecha-nism at the edge.
A. Scrape-off-layer model forGENRAY
A close examination of the ray trajectories in Fig. 13
shows that a more careful treatment of the pedestal and SOL regions is necessary to represent the wave behavior in the edge region accurately. Artificially imposing a cutoff at the separatrix creates a narrow region where rays may become trapped between the low density cutoff layer and the high density mode conversion layer. To account for this, a SOL model has been added to GENRAY. Magnetic fields in the SOL are imported directly from a magnetic field equilibrium reconstruction. The SOL is only included in the GENRAY
code and is not a part of CQL3D. Consequently, quasilinear wave absorption is not calculated in the SOL, and the radia-tion from fast electrons born in the SOL is not included in the synthetic diagnostic.
GENRAYincludes collisional damping effects both inside
the separatrix, where collisional damping is small relative to Landau damping, and in the SOL. At the low temperatures encountered in the SOL, collisional damping can be compa-rable to or exceed Landau damping for low n储waves.
Infor-mation regarding the absorption of the rays in the SOL is not directly included in the quasilinear diffusion coefficient used inCQL3D, although the power in the ray is reduced appropri-ately after passing through the SOL. The effects of colli-sional damping in the SOL will be discussed further in Sec. III B
A two-dimensional共2D兲 SOL profile, for which the den-sity scale lengthnis a function of poloidal angle, has been
implemented in GENRAY. The 2D SOL model also includes the C-Mod vacuum vessel and limiter geometry and reflects rays that intersect the metallic surfaces. Figure13shows the ray trajectories for a high density共n¯e⬃1.5⫻1020兲 discharge
with the 2D SOL model. Although shifts of k储 that occur in
the SOL reduce the predicted x-ray emissivity, the experi-mental data are still several orders of magnitude below that predicted by CQL3D. Therefore, there must be an additional mechanism or mechanisms responsible for the discrepancy.
B. Collisional absorption in the SOL
The simulations previously discussed do not include any contribution of damping in the SOL calculated by
GENRAY. The collisional absorption of the LH waves can be strong in regions of high density and low temperature
0.4 0.6 0.8 1 1.2 1.4 1.6 x 10²⁰ 103 104 105 106 107 108 n e[m −3 ] Count Rate (Chords 9−24, 40−200 keV) [s −
1 ] Line Integrated HXR Count Rate
n ||=1.9, 5.4T, 800kA n ||=2.3, 5.4T, 800kA n||=1.9, 7.0T, 800kA n||=2.3, 7.0T, 800kA n||=1.9, 5.4T, 1.1MA n||=2.3, 5.4T, 1.1MA
FIG. 12.共Color online兲 Simulated and measured HXR emission as a func-tion of line averaged density. The output of the synthetic diagnostic is shown with large symbols, while the experimental data are shown with small sym-bols. Simulations are based on 800 kW of net LH power.
0.6 0.8 1 −0.5 −0.4 −0.3 −0.2 −0.1 0 0.1 0.2 0.3 0.4 0.5 0.6 0.7 0.8 0.9 1 −0.5 −0.4 −0.3 −0.2 −0.1 0 0.1 0.2 0.3 0.4 (a) (b)
FIG. 13. 共Color online兲 共a兲GENRAYsimulation showing rays trapped near the edge of the plasma. Each ray corresponds to a specific launch location and launched value of n储. The highest n储rays penetrate to near the core of
the plasma, while the lower n储rays stay close to the edge. Rays propagating
in the current drive direction move downward from the low field side共LFS兲 launch point, while rays propagating in the countercurrent drive direction move upward from the LFS launch point. The cutoff layer in this simulation is located at the separatrix and the vacuum vessel walls are superimposed for reference. The rays are truncated for clarity after a fixed distance. 共b兲 Ray trajectories including a 2D SOL model and reflections from the vacuum vessel. The separatrix location is indicated by a bold line.T共兲 is
共Te⬍ ⬃10 eV兲. At temperatures above ⬃10 eV, the
damp-ing is small even at high density. Collisional dampdamp-ing is estimated following the approach in Ref.26, where the elec-tron mass me is replaced with me共1+iei/兲 in the cold
plasma dispersion relation, where ei is the effective
electron-ion momentum collision frequency.
By including the effect of power absorbed in the SOL due to collisional damping, the x-ray emissivity at high den-sity is reduced significantly.27 共See Fig.14.兲 The agreement
between experimental data and predictions from CQL3D is improved across the entire density range, most notably at 1.5⫻1020 m−3, where the discrepancy was reduced from a
factor of⬃100–1000 to a factor of ⬃3–30.
It should be noted that the assumed SOL parameters are identical for all of the simulation data points in Fig.14. The modeled temperature in the SOL decays exponentially with an e-folding length T of 0.005 m until the temperature
reaches a minimum of 5 eV, beyond which the plasma tem-perature remains constant. These values are consistent with measurements of the SOL temperature profiles typically ob-served in C-Mod L-mode discharges. The density e-folding length varies between 0.1 m in the divertor regions and 0.02 m on the outer midplane. These values are typical for L-mode discharges but are not exact representations of pro-files in the discharges being modeled.
Collisional absorption in the SOL is sensitive to the spe-cifics of both the temperature and density profiles. Since the absorption peaks in areas of low temperature and high den-sity, such as divertor regions, the exact path of the ray will determine the level of damping in the SOL. At a fixed density, the experimental x-ray emissivity is consistently weaker for the 5.4 T, 800 kA discharges with n¯e above
⬃8⫻1020 m−3; however, the simulation data do not show
this same trend. This may be due to the sensitivity of the
SOL absorption to the temperature and density profiles. Re-sults from Alcator C 共Ref. 20兲 show an increase in current
drive efficiency at higher magnetic field. The increase in ef-ficiency was attributed to an increase in electron temperature at higher field. There may well be small differences in the SOL profiles as a function of plasma current and magnetic field, although in the discharges considered there are no pro-file measurements in the SOL. Still, the strong downward trend in x-ray emission as density increases suggests that a damping mechanism in the SOL that increases with neand
decreases with Temay be largely responsible for the absence
of fast electrons in the plasma.
Although collisional absorption does not by itself lead to a net driven current in the plasma, it is possible that the SOL currents discussed in this section may be due to asymmetric heating in the SOL. If the waves leaving the LH launcher deposit their energy preferentially in one direction along the field lines, this can cause a parallel thermal gradient, which in turn can drive a thermoelectric current along open field lines.24 However, there is some inconsistency in this expla-nation. If a thermal gradient is responsible for driving the currents in the SOL, then the region of plasma where the waves are absorbed through collisional damping would heat up. The collisional damping rate falls sharply as plasma tem-perature rises above⬃10 eV. Furthermore, measurements of
Te in the divertors do not show a change in temperature on
either end of the field line during the application of LHCD. This same reasoning suggests that it may be possible to “burn through” the observed density limit. If sufficient en-ergy is deposited in the SOL, the temperature will rise and the collisional damping rate will fall, thereby increasing the amount of power absorbed on closed flux surfaces. This self-regulating mechanism could provide a means to ameliorate the density limit phenomenon, although if this is possible the critical power threshold is above 900 kW on C-Mod.
Another possible solution to the problem of LH wave absorption in the SOL may be to increase the temperature inside the separatrix through ion cyclotron resonance heating 共ICRH兲, such that waves with reduced penetration to the core plasma are still absorbed before refracting back into the SOL. If the single-pass absorption is high for all rays, then the loss in the SOL may be significantly reduced. Alterna-tively, dramatically increasing n储 while keeping the plasma
temperature constant will increase single-pass absorption at the cost of overall current drive efficiency.
LHCD experiments at high density on FTU show an increase in fast electron bremsstrahlung following the appli-cation of lithium to the plasma facing components.6This has the effect of both decreasing density and increasing tempera-ture in the edge of the plasma. Although the proposed expla-nation for reduced bremsstrahlung at high density on FTU 共spectral broadening of the LH waves due to parametric de-cay instabilities兲 differs with that of C-Mod, both explana-tions point toward using higher edge temperature and lower edge density as a means to reduce parasitic losses in the edge. 0.4 0.6 0.8 1 1.2 1.4 1.6 x 10²⁰ 103 104 105 106 107 n e[m −3 ] Count Rate (Chords 9−24, 40−200 keV) [s −
1 ] Line Integrated HXR Count Rate
n ||=1.9, 5.4T, 800kA n||=2.3, 5.4T, 800kA n||=1.9, 7.0T, 800kA n||=2.3, 7.0T, 800kA n||=1.9, 5.4T, 1.1MA n ||=2.3, 5.4T, 1.1MA
FIG. 14.共Color online兲 Fast electron bremsstrahlung emission predicted by
GENRAY/CQL3Dcode package with a two-dimensional SOL model including
the effects of collisional damping in the SOL. The large symbols are simu-lation results, while the small symbols are experimental data.
IV. IMPLICATIONS FOR LHCD IN H-MODE ON ALCATOR C-MOD
In general, H-mode discharges have considerably higher line averaged densities than L-modes. On C-Mod, H-modes with n¯e⬍1.5⫻1020are extremely difficult to obtain, and the
highest performance H-modes have n¯e⬎2.0⫻1020. Given
that the density of H-mode discharges is above the L-mode density limit for LHCD, the scaling of the LHCD density limit in H-mode is of considerable interest for the future application of LH current profile control on C-Mod.
When LHCD is applied to relatively low density,
n
¯e⬍2⫻1020 m−3, low Zeff, ICRH heated, H-mode plasmas
on C-Mod, substantial changes occur in the plasma despite the fact that the density is above the limit described in Sec. II. During the application of high power LHCD, the density profile relaxes, with a decrease in density at the top of the pedestal and an increase in density at the foot.28 The tem-perature simultaneously increases at the top of the pedestal but remains nearly constant at the pedestal foot. These complementary changes in the temperature and density result in a nearly unchanged pedestal pressure profile, while the pressure at r/a⬍0.6 increases by 10%–15%. The tempera-ture, density, and pressure profiles for an H-mode discharge before and during LHCD are shown in Fig.15.
The changes to the pedestal become more prominent as
PNET, the total heating power 共ICRH, LHCD, and Ohmic兲 minus the radiated power increases. Since the radiated power increases with Zeff, this effect has only been seen in clean
discharges immediately following a thorough boronization.29 Although PNET includes the sum of all heating power, it
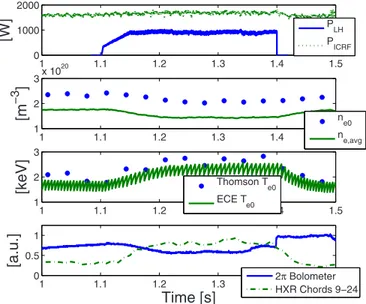
should be noted that these pedestal changes have not been observed without a combination of both ICRF and LHCD. Figure16 shows the changes in several key plasma param-eters during an H-mode discharge that has a strong modifi-cation to the pedestal. Both the core and line averaged den-sity decrease during the application of LHCD, but the core temperature increases. Radiation from the plasma measured by the 2 bolometer30 also decreases when the LHCD is
turned on, indicating increased impurity transport. Although the HXR camera shows a considerable background count rate during the ICRF only portion of the H-mode, a clear increase can be seen during LHCD.
The change to the H-mode density pedestal induced by LHCD increases density in the SOL. This moves the cutoff layer further from the separatrix where Te is lower and
collisional damping is stronger. However, the lower core density causes refraction to be less severe, allowing rays to more directly access the hot core of the plasma. Also, the temperature in the core plasma, and therefore wave damping inside the separatrix, increases. The net result of these com-peting effects is not immediately apparent and must be ad-dressed by examining the experimental data and comparing with models of the H-mode discharge in its unperturbed state 共immediately prior to the application of LHCD兲 and in its perturbed state.
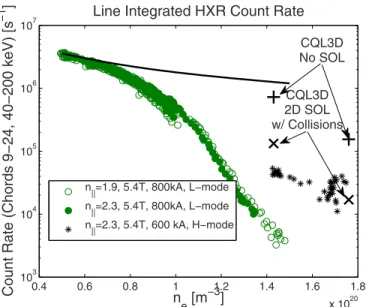
Figure 17 shows the HXR emission during several H-mode discharges modified by ⬃900 kW of LHCD. The black points represent the H-mode discharges, all of which had a launched n储 of 2.3. The bremsstrahlung emission
dur-ing these discharges was significantly higher than for the high density L-modes at comparable line averaged density. The background HXR level due to ICRF is subtracted from the H-mode data in Fig.17.
The current driven in an H-mode discharge with LHCD can be estimated based on the change in loop voltage be-cause the plasma remains in a stationary state for a sufficient time for the current to redistribute. To estimate the amount of current driven, it is necessary to consider not just the ratio of loop voltage prior to and during LHCD, Vl共t2兲/Vl共t1兲, but
also the change in resistivity due to temperature,
共t2兲 共t1兲 =
冋
T共t1兲 T共t2兲册
3/2 . 共4兲The ratio Vl共t2兲/Vl共t1兲 is ⬃0.7, while the ratio共t2兲/共t1兲 is
⬃0.6. The change in Vlcan be attributed almost entirely to
1 2 3x 10 20 n e [m − 3 ] 1 2 3 T e [keV] 0 0.2 0.4 0.6 0.8 1 0 5 10x 10 4 r/a Pressure [Pa] t = 0.95 [s], before LH t = 1.25 [s], during LH
FIG. 15.共Color online兲 Changes in H-mode density, temperature, and pres-sure profiles with the application of LHCD. Shot number= 1080306013.
1 1.1 1.2 1.3 1.4 1.5 0 1000 2000 [W] 1 1.1 1.2 1.3 1.4 1.5 1 2 3x 10 20 [m −3 ] 1 1.1 1.2 1.3 1.4 1.5 1 2 3 [keV] 1 1.1 1.2 1.3 1.4 1.5 0 0.5 1 Time [s] [a.u.] PLH PICRF ne0 ne,avg Thomson Te0 ECE Te0 2π Bolometer HXR Chords 9−24
FIG. 16. 共Color online兲 Low density H-mode with LH induced pedestal modification. Te and HXR emission increase during the application of
LHCD while ne, Vloop, and radiated power decrease. Shot number
the increase in plasma temperature, not due to direct current driven by the LH waves. Although this analysis shows that little or no current is directly driven by LHCD in this dis-charge, the changes in the plasma discussed above demon-strate that LHCD applied to H-modes can have a substantial positive effect on the plasma even above the observed den-sity limit for L-modes.
When the SOL is included in the model of the H-mode discharges, the ray trajectories dwell considerably outside the separatrix both before and after the profiles are modified by LHCD. As with the high density L-mode discharges, even rays that are not trapped outside the separatrix do not pen-etrate far into the core plasma.
The discrepancy between experimental data and the pre-dictions fromCQL3Dis smaller for H-mode than for L-mode, even with no SOL model or collisional damping included in
GENRAY, as seen in Fig. 17. This suggests that the density limit is sensitive to the specifics of the SOL profiles as op-posed to a simple “critical density.” Figure17also shows the results of simulations with a 2D SOL model including colli-sions compared with the experimental results. As with the L-mode discharges, including both the SOL and collisional damping improves agreement between the experiment and the simulations considerably.
V. DISCUSSION AND CONCLUSIONS
Experimental observations of fast electron bremsstrah-lung emission show that the fast electron population in L-mode plasmas is significantly reduced at line averaged densities above 1⫻1020 m−3. Electric currents measured in
the SOL rise sharply at approximately the same density. Taken together, this suggests that the LH waves are deposit-ing their energy outside the separatrix. “Density limits” for effective LHCD have been observed on previous
experi-ments, although the observed limit on C-Mod is significantly lower than the predicted limit based on prior results.
Explanations for previously observed density limits, such as PDI and accessibility criterion violation, disagree with the phenomenology of the C-Mod limit. The sudden drop in fast electrons at high density is not predicted by conventional ray tracing/Fokker–Planck models. By adding the effects of collisional absorption in the SOL to these mod-els, the agreement with experiment at high density is signifi-cantly improved. Based on interpretation of the modeling results, the lack of fast electrons at high density is caused by a confluence of several effects. The high density prevents waves from penetrating deep into the hottest part of the plasma and also lowers the overall temperature of the plasma. This reduces single-pass absorption, which is weak even at low density for n储ⱕ2.33. When combined with an
edge loss mechanism, the weak damping inside the separa-trix leads to more transits of the rays to the edge, resulting in the absorption of wave power outside the separatrix via col-lisional damping. The result could theoretically be mitigated by either reducing the edge loss mechanism or increasing core damping. The increased temperature of H-mode plas-mas strengthens core absorption although no experimental means of eliminating the edge losses has yet been identified on C-Mod short of operating at lower density.
Increasing the electron temperature on closed flux surfaces, particularly in the outer part of the plasma 共r/a⬎0.7兲, may increase single-pass absorption in L- and I-mode31 discharges, thereby reducing parasitic edge losses incurred after the first pass. The temperature and density pro-files in the SOL could also be adjusted by varying the con-nection length in the SOL and the plasma topology. Future experimental work will focus on these avenues of research along with better characterization of the driven current pro-file with stationary plasma propro-files.
These results highlight the importance of treating the edge and core propagation/absorption problems simulta-neously. The disconnect between edge coupling, treated by coupling codes such asGRILL共Ref.32兲 orALOHA,33and core propagation/absorption, treated by traditional ray tracing/ Fokker–Planck codes such as GENRAY/CQL3D, must be bridged and the two problems treated together. Recent ad-vances in full wave simulations with codes such asTORIC-LH
共Refs.34and35兲 andLHEAF共Refs.36and37兲, allow proper
treatment of wave propagation in the vicinity of the cutoff layer where the WKB approximation is not well satisfied. It is imperative to consider not only the power leaving the an-tenna but also the power actually absorbed on closed flux surfaces when simulating tokamak plasmas in the low single-pass absorption regime.
ACKNOWLEDGMENTS
The authors would like to thank the C-Mod LHCD en-gineering team for their efforts in keeping the system running.
This work supported by US DOE Award Nos. DE-FC02-99ER54512 and DE-AC02-76CH03073.
0.4 0.6 0.8 1 1.2 1.4 1.6 1.8 x 10²⁰ 103 104 105 106 107 n e[m −3 ] Count Rate (Chords 9−24, 40−200 keV) [s −
1 ] Line Integrated HXR Count Rate
n||=1.9, 5.4T, 800kA, L−mode n||=2.3, 5.4T, 800kA, L−mode n ||=2.3, 5.4T, 600 kA, H−mode CQL3D No SOL CQL3D 2D SOL w/ Collisions
FIG. 17.共Color online兲 HXR emission as a function of line averaged den-sity during H-mode. Small black data points show experimental data in H-mode, while large black data points represent simulated emission from
1P. T. Bonoli, R. Parker, S. J. Wukitch, Y. Lin, M. Porkolab, J. C. Wright,
E. Edlund, T. Graves, L. Lin, J. Liptac, A. Parisot, A. E. Schmidt, V. Tang, W. Beck, R. Childs, M. Grimes, D. Gwinn, D. Johnson, J. Irby, A. Kanojia, P. Koert, S. Marazita, E. Marmar, D. Terry, R. Vieira, G. Wallace, J. Zaks, S. Bernabei, C. Brunkhorse, R. Ellis, E. Fredd, N. Greenough, J. Hosea, C. C. Kung, G. D. Loesser, J. Rushinski, G. Schilling, C. K. Phil-lips, J. R. Wilson, R. W. Harvey, C. L. Fiore, R. Granetz, M. Greenwald, A. E. Hubbard, I. H. Hutchinson, B. LaBombard, B. Lipschultz, J. Rice, J. A. Snipes, J. Terry, S. M. Wolfe, and Alcator C-Mod Team, Fusion Sci. Technol. 51, 401共2007兲.
2I. H. Hutchinson, R. Boivin, F. Bombarda, P. Bonoli, S. Fairfax, C. Fiore,
J. Goetz, S. Golovato, R. Granetz, M. Greenwald, S. Horne, A. Hubbard, J. Irby, B. LaBombard, B. Lipschultz, E. Marmar, G. McCracken, M. Porkolab, J. Rice, J. Snipes, Y. Takase, J. Terry, S. Wolfe, C. Christensen, D. Garnier, M. Graf, T. Hsu, T. Luke, M. May, A. Niemczewski, G. Tinios, J. Schachter, and J. Urbahn,Phys. Plasmas 1, 1511共1994兲.
3R. Aymar, P. Barabaschi, and Y. Shimomura, Plasma Phys. Controlled
Fusion 44, 519共2002兲.
4N. J. Fisch and A. H. Boozer,Phys. Rev. Lett. 45, 720共1980兲. 5Y. Takase, M. Porkolab, J. J. Schuss, R. L. Watterson, C. L. Fiore, R. E.
Slusher, and C. M. Surko,Phys. Fluids 28, 983共1985兲.
6R. Cesario, L. Amicucci, G. Calabrò, A. Cardinali, C. Castaldo, M.
Marinucci, L. Panaccione, V. Pericoli-Ridolfini, A. A. Tuccillo, and O. Tudisco, in Radio Frequency Power in Plasmas: Proceedings of the 18th
Topical Conference, Ghent, 2009, edited by V. Bobkov and J.-M.
Noterdaeme共AIP, Melville, 2009兲, Vol. 1187, pp. 419–422.
7M. J. Mayberry, M. Porkolab, K. I. Chen, A. S. Fisher, D. Griffin, R. D.
Kaplan, S. C. Luckhardt, J. Ramos, and R. Rohatgi,Phys. Rev. Lett. 55,
829共1985兲.
8G. M. Wallace, R. R. Parker, P. T. Bonoli, A. E. Schmidt, D. G. Whyte, J.
R. Wilson, and S. J. Wukitch, Bull. Am. Phys. Soc. 53, 222共2008兲.
9N. J. Fisch,Rev. Mod. Phys. 59, 175共1987兲.
10W. Hooke,Plasma Phys. Controlled Fusion 26, 133共1984兲. 11V. E. Golant, Sov. Phys. Tech. Phys. 16, 1980共1972兲.
12F. Troyon and F. W. Perkins, in Proceedings of the Second Topical
Con-ference on RF Plasma Heating, Lubbock, 1974, edited by R. Dollinger, M.
Kristiansen, M. O. Hagler, F. J. Paoloni, and J. Bergstroem共Texas Tech University, Lubbock, TX, 1974兲, pp. B4.1–B4.6.
13M. Porkolab,Phys. Fluids 20, 2058共1977兲.
14M. Porkolab, S. Bernabei, W. M. Hooke, R. W. Motley, and T. Nagashima,
Phys. Rev. Lett. 38, 230共1977兲.
15R. R. Parker, M. Greenwald, S. C. Luckhardt, E. S. Marmar, M. Porkolab,
and S. M. Wolfe, Nucl. Fusion 25, 1127共1985兲.
16A. P. Smirnov and R. Harvey, Bull. Am. Phys. Soc. 40, 1837共1995兲. 17R. W. Harvey and M. McCoy, in Proceedings of the IAEA Technical
Committee Meeting on Simulation and Modeling of Thermonuclear Plas-mas, Montreal, 1992, edited by F. Zacek, J. Stoeckel, J. Badalec, L.
Dvoracek, K. Jakubka, P. Kletecka, L. Kryska, P. Magula, J. Mlynar, and F. Soeldner 共International Atomic Energy Agency, Vienna, 1992兲, pp. 489–526.
18J. Liptac, R. Parker, V. Tang, Y. Peysson, and J. Decker,Rev. Sci. Instrum.
77, 103504共2006兲.
19V. Pericoli-Ridolfini, E. Barbato, S. Cirant, H. Kroegler, L. Panaccione, S.
Podda, F. Alladio, B. Angelini, M. L. Apicella, G. Apruzzese, L. Bertalot, A. Bertocchi, M. Borra, G. Bracco, A. Bruschi, G. Buceti, P. Buratti, A. Cardinali, C. Centioli, R. Cesario, S. Ciattaglia, V. Cocilovo, F. Crisanti, R. De Angelis, F. De Marco, B. Esposito, and D. Frigione,Phys. Rev. Lett.
82, 93共1999兲.
20M. Porkolab, J. J. Schuss, B. Lloyd, Y. Takase, S. Texter, P. Bonoli, C.
Fiore, R. Gandy, D. Gwinn, B. Lipschultz, E. Marmar, D. Pappas, R. Parker, and P. Pribyl,Phys. Rev. Lett. 53, 450共1984兲.
21G. Wallace, P. Bonoli, A. Parisot, R. Parker, A. Schmidt, J. R. Wilson, and
Alcator C-Mod Team, in Proceedings of the 17th Topical Conference on
Radio Frequency Power in Plasmas, Clearwater, 2007, edited by P. M.
Ryan and D. Rasmussen共AIP, Melville, NY, 2007兲, Vol. 933, pp. 277–280.
22R. McWilliams, E. J. Valeo, R. W. Motley, W. M. Hooke, and L. Olson,
Phys. Rev. Lett. 44, 245共1980兲.
23B. Labombard, J. A. Goetz, I. Hutchinson, D. Jablonski, J. Kesner, C.
Kurz, B. Lipschultz, G. M. McCracken, A. Niemczewski, J. Terry, A. Allen, R. L. Boivin, F. Bombarda, P. Bonoli, C. Christensen, C. Fiore, D. Garnier, S. Golovato, R. Granetz, M. Greenwald, S. Horne, A. Hubbard, J. Irby, D. Lo, D. Lumma, E. Marmar, M. May, A. Mazurenko, R. Nachtrieb, H. Ohkawa, P. O’Shea, M. Porkolab, J. Reardon, J. Rice, J. Rost, J. Schachter, J. Snipes, J. Sorci, P. Stek, Y. Takase, Y. Wang, R. Watterson, J. Weaver, B. Welch, and S. Wolfe, J. Nucl. Mater. 241–243, 149共1997兲.
24P. Stangeby, The Plasma Boundary of Magnetic Fusion Devices共IOP,
Berkshire, 1999兲.
25B. LaBombard, J. Goetz, C. Kurz, D. Jablonski, B. Lipschultz, G.
McCracken, A. Niemczewski, R. L. Boivin, F. Bombarda, C. Christensen, S. Fairfax, C. Fiore, D. Garnier, M. Graf, S. Golovato, R. Granetz, M. Greenwald, S. Horne, A. Hubbard, I. Hutchinson, J. Irby, J. Kesner, T. Luke, E. Marmar, M. May, P. O’Shea, M. Porkolab, J. Reardon, J. Rice, J. Schachter, J. Snipes, P. Stek, Y. Takase, J. Terry, G. Tinios, R. Watterson, B. Welch, and S. Wolfe,Phys. Plasmas 2, 2242共1995兲.
26P. T. Bonoli and R. C. Englade,Phys. Fluids 29, 2937共1986兲.
27G. M. Wallace, R. R. Parker, P. T. Bonoli, R. W. Harvey, A. E. Schmidt,
A. P. Smirnov, D. G. Whyte, J. R. Wilson, J. C. Wright, and S. J. Wukitch, in Radio Frequency Power in Plasmas: Proceedings of the 18th Topical
Conference, Ghent, 2009, edited by V. Bobkov and J.-M. Noterdaeme
共AIP, Melville, NY, 2009兲, Vol. 1187, pp. 395–398.
28J. W. Hughes, A. E. Hubbard, G. M. Wallace, M. Greenwald, B. L.
LaBombard, L. Lin, R. M. McDermott, R. R. Parker, M. L. Reinke, J. E. Rice, and J. R. Wilson,Nucl. Fusion 50, 064001共2010兲.
29B. Lipschultz, Y. Lin, E. Marmar, D. Whyte, S. Wukitch, I. Hutchinson, J.
Irby, B. LaBombard, M. Reinke, J. Terry, and G. Wright,J. Nucl. Mater.
363–365, 1110共2007兲.
30M. L. Reinke and I. H. Hutchinson,Rev. Sci. Instrum. 79, 10F306共2008兲. 31R. M. McDermott, B. Lipschultz, J. W. Hughes, P. J. Catto, A. E. Hubbard,
I. H. Hutchinson, R. S. Granetz, M. Greenwald, B. LaBombard, K. Marr, M. L. Reinke, J. E. Rice, and D. Whyte, Phys. Plasmas 16, 056103
共2009兲.
32M. Brambilla, Nucl. Fusion 16, 47共1976兲.
33J. Hillairet, D. Voyer, B. Frincu, O. Meneghini, A. Ekedahl, and M.
Goniche,Fusion Eng. Des. 84, 953共2009兲.
34J. C. Wright, P. T. Bonoli, C. K. Phillips, E. Valeo, and R. W. Harvey, in
Radio Frequency Power in Plasmas: Proceedings of the 18th Topical
Con-ference, Ghent, 2009, edited by V. Bobkov and J.-M. Noterdaeme共AIP,
Melville, NY, 2009兲, Vol. 1187, pp. 351–358.
35J. C. Wright, P. T. Bonoli, A. E. Schmidt, C. K. Phillips, E. J. Valeo, R. W.
Harvey, and M. A. Brambilla,Phys. Plasmas 16, 072502共2009兲.
36O. Meneghini, S. Shiraiwa, and R. Parker,Phys. Plasmas 16, 090701
共2009兲.
37S. Shiraiwa, O. Meneghini, R. Parker, G. Wallace, and J. Wilson, in Radio
Frequency Power in Plasmas: Proceedings of the 18th Topical
Confer-ence, Ghent, 2009, edited by V. Bobkov and J.-M. Noterdaeme 共AIP,