Partial oxidation of methane to syngas over noble metal catalysts supported by Fecralloy fibre
ZHENNI MA
Département de génie chimique
Thèse présentée en vue de l’obtention du diplôme de Philosophiæ Doctor Génie chimique
Mars 2019
c
Cette thèse intitulée :
Partial oxidation of methane to syngas over noble metal catalysts supported by Fecralloy fibre
présentée par Zhenni MA
en vue de l’obtention du diplôme de Philosophiæ Doctor a été dûment acceptée par le jury d’examen constitué de :
Jason Robert TAVARES, président
Gregory PATIENCE, membre et directeur de recherche
Daria Camilla BOFFITO, membre et codirectrice de recherche Oumarou SAVADOGO, membre
DEDICATION
Dedicated to My beloved parents My lovely husband My guardian angels Thank you for your love and support. . .
ACKNOWLEDGMENTS
I would like to acknowledge all who in one way or another contributed to the completion of this thesis.
First and foremost, I wish to express my deep and sincere gratitude to my supervisor Prof. Gregory S. Patience for his solid support, motivation, caring and patience. His vast knowledge and caring encouragements guided me not only in scientific research, writing and presenting but also helped me overcome my weaknesses in communication. I will cherish this for the rest of my life. It was my deep honor to work as a PhD student under him.
Also I would like to thank my most beautiful co-supervisor Prof. Daria C. Boffito for her always timely help in my research and project. She is my true role model. I am blessed to have worked with her.
I would like to thank Prof. Patrice Perreault for his full support, immense knowledge and professionalism.
I would like to acknowledge Diego C. Pelegrin, Dr. Cristian Neagoe, Dr. Cristian Trevisanut and soon to be Dr Philippe Ouzilleau who have greatly contributed to the accomplishment of the work presented here.
I would like to thank my lovely old colleagues Samira, Marjan, Mehash, and Jaber and I will remember all the best time we have spent together.
My deep gratitude goes to all my colleagues Gianluca, Mohammad and technicians Sylvain and Yanik in Prof. Patience’s group for sharing their knowledge and ideas, thank Yuxiang for his great help in translation of the abstract of this thesis to French, and to all my colleagues who helped me at various points during the Ph.D. thesis process.
I would also like to extend my thanks to my friends and colleagues at Polytechnique Montreal, Ling, Bing, and many more whose names I unintentionally forgot to mention, for their support in various aspects during this Ph.D thesis.
I would like to acknowledge the members of my committee for taking interest in my work, examining my thesis and providing insightful comments.
Finally, I would like to thank my family for their love, patience and continuous support during the past years.
RÉSUMÉ
Le torchage des rejets gazeux par l’industrie pétrolière émet une quantité importante de GES qui accélèrent le changement climatique en plus de nuire à l’environnement avec des polluants toxiques tels que des composés sulfurés et des métaux lourds. Le méthane est un vecteur énergétique précieux et sa conversion en combustibles liquides réduirait l’empreinte environnementale des pétrolières. Un procédé micro gaz-à-liquide (µGtL) pourrait réduire le brûlage de méthane par torchage et permettra de produire un carburant énergétiquement dense : le diesel.
Une opération unitaire intégrant simultanément la production de gaz de synthèse à haute pression et une étape Fischer-Tropsch peut réduire substantiellement les coûts d’exploitation liés à la synthèse de liquides GtL.
De plus, l’oxydation catalytique partielle (CPOX) pour la production des gaz de synthèse pourrait constituer une opportunité économique pour les microraffineries. En pratique, une pression supérieure à 2 MPa favorise la réaction de FT. Le défi consiste donc à opérer le procédé CPOX à cette pression tout en maintenant une sélectivité élevée. À ce jour, peu d’études ont été consacrées au CPOX du méthane à haute pression.
Le catalyseur CPOX doit résister à des contraintes de température et de pression élevées. De nombreux métaux et oxydes métalliques convertissent sélectivement le gaz naturel en CO et H2. Ils sont cependant susceptibles au coking et doivent être régénérés périodiquement pour éviter la désactivation du catalyseur et l’encrassement des tuyauteries réacteur. Les métaux nobles démontrent une activité supérieure et une meilleure résistance à la formation du coke comparativement aux métaux non nobles. Les mailles en alliage ferrochrome (FeCr) sont des matériaux de support idéaux, car la pellicule protectrice de surface en alumine résiste à des températures supérieures à 1000◦C, et ce, sur des périodes allant jusqu’à 3000 h. Ils présentent également une excellente conductivité thermique et génèrent de faibles pertes de charge. Dans cette thèse, nous présentons pour la première fois l’oxydation partielle du méthane en gaz de synthèse dans un système hétérogène micro gaz-solide catalysé par métaux nobles sur support en mailles métalliques.
La première étape de ce projet consistait à concevoir un catalyseur approprié (composition, support, méthode de préparation et caractérisation du catalyseur). La seconde cherchait à étudier les conditions de réaction (température, pression, composition de l’alimentation et temps de contact) sur la sélectivité des produits souhaités. Pour mieux comprendre la réaction CPOX, nous introduisons le sujet de la formation du coke et de la régénération du catalyseur
en alliage FeCr. Une étude cinétique et l’analyse par spectrophotomètre de masse permettent de proposer un mécanisme de réaction pour l’activation du méthane.
Ainsi, nous avons préparé un catalyseur Pt/Rh (ratio massique Pt/Rh = 9) supporté sur alliage FeCr couvert en oxyde de magnésium (MgO) par synthèse auto-propagée à haute-température (SHS). Cette méthode génère des particules fines et une phase active uniformé-ment dispersée et a donc été utilisée pour la majorité des essais dans ce projet. La réaction à été réalisée à 900◦C sous une pression entre 0.1 à 2 MPa avec un mélange de CH
4 et de O2 à rapport massique 2 :1 sous flux horaire constant. Les résultats expérimentaux montrent que la conversion du méthane augmente avec la pression ainsi que la sélectivité en H2 et en O2. Inversement, en maintenant un temps de contact fixe, la conversion du méthane et la sélec-tivité de CO et H2 s’avèrent optimaux à pression ambiante. L’étude thermodynamique du coke démontre un comportement métastable. Une augmentation du temps de contact devrait réduire la formation de coke.
Malgré une faible sélectivité, l’alliage FeCr vierge et oxydé mène tous deux à la conversion du méthane. Nos résultats par diffraction rayon X (XRD) démontrent que le dépôt direct de Pt/Rh engendre une surface plus amorphe sur l’alliage FeCr oxydé. À 900◦C et entre 0.1 MPa et 2 MPa, la production de syngas avec le catalyseur Pt/Rh supporté par alliage FeCr Pt/Rh était supérieur autres catalyseurs sur ce même support. La réaction début à 600◦C. À 900◦C, la conversion et la sélectivité se sont rapprochées des valeurs d’équilibre thermodynamique. Lors de nos tests, l’ajout de Pt a permis au catalyseur de résister à la formation du coke jusqu’à 65 min. La régénération rétablit la quasi-totalité de l’activité du catalyseur tout en laissant la surface intacte après plusieurs cycles de réaction-régénération. Les matériaux CeO2ont une capacité de stockage d’oxygène. CeO2 sur support en alliage FeCr exhibe une activité supérieure sous pression atmosphérique, mais restreinte à haute pression. Pt/CeO2 supporté sur alliage FeCr était inerte entre 0.1 MPa et 2 MPa. Afin d’élucider le mécanisme de réaction, nous avons introduit séparément du méthane et de l’oxygène dans le système catalytique. Sans concurrence de réactions secondaire avec l’oxygène, le CeO2 reste réactif pour l’activation méthane. Un courant d’oxygène alimenté à 21 % a généré le CO avec grande pureté. En séparant le méthane de l’oxygène, la réaction d’activation du méthane par le catalyseur peut examiner à nouveau. Nos données supportent un modèle cinétique de premier ordre avec une énergie d’activation de 46 kJ/mole. De plus, il démontre que la non-dissociation du méthane adsorbé est une étape limitante. À haute pression, trois cycles oxydation et de réduction (alimentation à 21 % en O2 et 30 % en CH4 respectivement) ont indiqués que la réaction se produit de manière directe.
ABSTRACT
Gas flaring accelerates climate change with greenhouse gases also harms the environment with other pollutants such as H2S, carbon sulphides, NOx and heavy metals. Methane is a valuable energy vector, and converting the associated gas from thousands of wells to liquid fuels would reduce the environmental footprint of oil field operations. Micro Gas-to-Liquids technology (µGtL) can potentially reduce the natural gas that is flared throughout the world while producing valuable diesel.
Integrating a high pressure syngas step with Fischer-Tropsch (FT) in a single vessel reduces investment and operating costs to synthesize GtL liquids. Methane catalytic partial oxidation (CPOX) to produce syngas for FT is an economic opportunity for micro refineries. FT reaction favours at least 20 bar. Therefore the challenge is to operate CPOX at pressure of 20 bar and pursue high selectivity. To date, only a few studies have focused on high pressure catalytic partial oxidation of methane.
CPOX catalyst must resist high temperature and high pressure stresses. Many metals and metal oxides selectively convert natural gas to CO and H2 while forming coke. Coke must be removed intermittently, otherwise it deactivates the catalyst and blocks the reactor and process lines. Noble metals presented higher activity in CPOX reaction and higher resistance to coke formation than non-noble metals. FeCralloy knitted fibres are ideal materials for supports because the surface protective alumina scale resists temperature over 1000◦C over 3000 h of operation. Also, FeCralloy has excellent heat conductivity and low pressure drop. We approach this subject by employing a micro gas – solid heterogeneous system for CPOX at pressure up to 2 MPa in the presence of the noble metal catalyst supported on metal fibres for the first time.
Designing a suitable catalyst (composition, support, preparation method, and characteri-zation) is the first step of this project. Investigating the reaction conditions (temperature, pressure, feed composition, and contact time) on the selectivity of desired products is the second step. To further understand the CPOX reaction, we discussed coke formation on FeCralloy catalysts and catalyst regeneration. We modelled experimental data of methane reduction and oxidation separately.
We prepared Pt/Rh (Pt/Rh = 9) catalyst supported on MgO over FeCralloy woven fibre by solution combustion synthesis. This method generated fine particles within a uniformly dispersed active phase and it was therefore employed in most of our work. At 900◦C, from
0.1 - 2 MPa, and with a 2:1 feed composition of CH4 to O2, keeping a constant weight hourly space velocity, methane conversion and selectivity of H2 and CO increased with pressure. However, keeping a constant contact time, methane conversion and selectivity of H2 and CO favoured lower pressure. Thermodynamic calculations demonstrated that the coke is metastable. Increasing contact time should reduce coke formation.
The virgin FeCralloy and the oxidized FeCralloy were reactive in converting methane as well, although the selectivity was poor. According to XRD analysis, direct deposition of Pt/Rh on the FeCralloy fibres prompted a more amorphous surface of the oxidized FeCralloy. Selectivity to syngas with Pt/Rh FeCralloy catalysts was superior to other FeCralloy catalysts at 900◦C and at 0.1 MPa and 2 MPa. Methane conversion and CO and H2 selectivity were sensitive to temperature. At temperature of 900◦C, methane conversion and H2 and CO selectivity were close to the thermodynamic equilibrium value. Adding Pt resisted coke formation at high pressure in 65 min tests. Upon regeneration, Pt/Rh FeCralloy catalyst recovered its entire activity, and the catalyst surface remained intact after multiple reaction regeneration cycles. CeO2 materials have an oxygen storage capacity. CeO2 supported on FeCralloy catalyst revealed superior activity in converting methane to syngas under atmosphere pressure, but high pressure restrained its activity. Pt/CeO2 FeCralloy was inert at both 0.1 MPa and 2 MPa. To understand its mechanism, we fed methane and oxygen separately into the catalytic system. Without competing oxygen reactions, CeO2 based FeCralloy were quite reactive in activating methane. Feeding 21 % oxygen stream to CeO2 FeCralloy catalysts generated CO with high purity. Separately feeding methane and oxygen into the catalytic system provided an alternative view to understand the methane activation on the catalyst surface. A first–order kinetic model characterizes the activation of methane on the catalyst surface with an activation energy of 46 kJ/mol. A hybrid Eley–Rideal model accurately described the oxidation reaction. During oxidation, there is a competition between catalyst oxidation and gaseous oxides formation. Three oxidation (feeding 21 % oxygen) – reduction(feeding 30 % methane) cycles at high pressure additionally validated the models. The formation of CO and H2 is under direct mechanism.
TABLE OF CONTENTS DEDICATION . . . iii ACKNOWLEDGMENTS . . . iv RÉSUMÉ . . . v ABSTRACT . . . vii TABLE OF CONTENTS . . . ix
LIST OF TABLES . . . xiii
LIST OF FIGURES . . . xiv
LIST OF SYMBOLS AND ABBREVIATIONS . . . xx
CHAPTER 1 INTRODUCTION . . . 1
1.1 Background and problem identification . . . 1
1.2 Objectives . . . 2
CHAPTER 2 LITERATURE REVIEW . . . 4
2.1 Syngas production processes . . . 5
2.1.1 Steam Methane Reforming (SMR) and Dry Reforming (DRM) . . . . 5
2.1.2 Auto Thermal Reforming (ATR) . . . 5
2.1.3 Partial oxidation (POX) . . . 6
2.2 Catalysts of methane catalytic partial oxidation . . . 7
2.2.1 Metals and their activation . . . 7
2.2.2 Non-metal catalysts . . . 8
2.2.3 Supports . . . 9
2.2.4 Promoters . . . 11
2.2.5 Catalyst preparation methods . . . 13
2.2.6 The effect of different reaction conditions . . . 14
2.3 Catalyst deactivation . . . 16
2.3.1 Deactivation mechanism . . . 17
2.3.2 Poisoning . . . 17
2.3.4 Thermal degradation and sintering . . . 19
2.3.5 Gas-vapour/solid and solid state reactions . . . 19
2.3.6 Mechanical failure of catalysts . . . 19
2.3.7 Catalyst deactivation and regeneration in syngas production . . . 20
2.4 CPOX reactors . . . 22
2.4.1 Fixed bed reactor . . . 22
2.4.2 Fluidized bed reactor . . . 23
2.4.3 Monolithic reactor . . . 23
2.4.4 Membrane reactor . . . 24
2.5 CPOX mechanism . . . 24
2.6 Summary of the literature review . . . 25
CHAPTER 3 COHERENCE OF THE ARTICLES . . . 28
CHAPTER 4 METHODOLOGICAL ASPECTS . . . 30
4.1 Materials . . . 30
4.2 Catalyst preparation . . . 30
4.2.1 Coating by solution combustion synthesis . . . 31
4.3 Catalyst characterization . . . 31
4.3.1 X-ray difraction (XRD) . . . 31
4.3.2 Scanning electron microscopy (SEM) . . . 31
4.3.3 Nitrogen adsorption/desorption (BET) . . . 32
4.3.4 Thermogravimetric analysis (TGA) . . . 32
4.4 Experimental description . . . 32
4.4.1 Experimental setup . . . 32
4.4.2 Mass Spectroscopy (MS) . . . 33
4.4.3 Gas Chromatograph (GC) . . . 33
4.4.4 Experimental procedure . . . 34
4.4.5 Qualification of the products . . . 34
CHAPTER 5 ARTICLE 1 - A MICRO-REFINERY TO REDUCE ASSOCIATED NA-TURAL GAS FLARING . . . 35
5.1 Abstract . . . 35
5.2 Introduction . . . 35
5.3 Gas-to-Liquid technologies . . . 37
5.3.1 Fischer-Tropsch (FT) syncrudes . . . 37
5.4 Micro-refinery unit (MRU) . . . 39 5.4.1 Pretreatment part . . . 39 5.4.2 Reaction zone . . . 41 5.4.3 Post-treatment part . . . 41 5.5 Methdology . . . 42 5.5.1 Catalysts . . . 42 5.5.2 Reactors . . . 42
5.6 Results and discussion . . . 43
5.6.1 Dual stage process . . . 43
5.6.2 Catalytic partial oxidation . . . 43
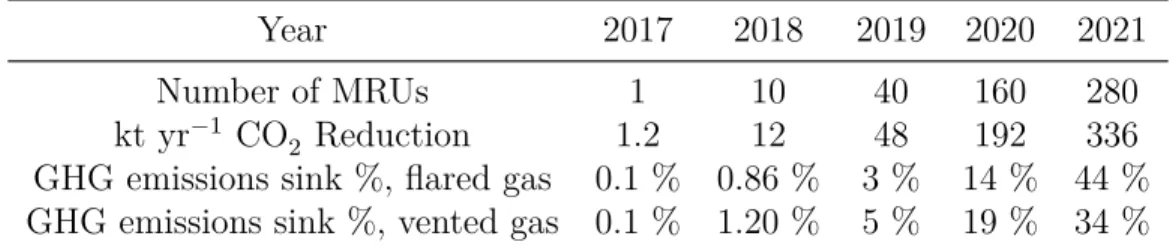
5.6.3 Greenhouse gases reduction . . . 43
5.6.4 Challenges . . . 47
5.7 Conclusions . . . 47
5.8 Acknowledgements . . . 48
CHAPTER 6 ARTICLE 2 - PARTIAL OXIDATION OF METHANE TO SYNGAS OVER PT/RH/MGO CATALYST SUPPORTED ON FECRALLOY WOVEN FIBRE 49 6.1 Abstract . . . 49 6.2 Introduction . . . 49 6.3 Experimental . . . 52 6.3.1 Catalyst preparation . . . 52 6.3.2 Catalyst characterization . . . 53 6.3.3 Experimental setup . . . 54
6.4 Results and discussion . . . 55
6.4.1 Catalyst characterization . . . 55
6.4.2 Catalytic tests . . . 56
6.4.3 Coke formation analysis . . . 59
6.5 Conclusion . . . 64
CHAPTER 7 ARTICLE 3 - FECRALLOY PARTIALLY OXIDIZES METHANE SE-LECTIVELY . . . 66 7.1 Abstract . . . 66 7.2 Introduction . . . 66 7.3 Experimental . . . 68 7.3.1 Catalyst preparation . . . 68 7.3.2 Experimental setup . . . 69
7.4.1 Catalyst characterization . . . 70
7.4.2 Catalytic tests . . . 75
7.5 Conclusions . . . 80
CHAPTER 8 ARTICLE 4 - THERMODYNAMICALLY UNCONSTRAINED FOR-CED CONCENTRATION CYCLING OF METHANE CATALYTIC PARTIAL OXI-DATION OF CEO2 ON FECRALLOY KNIT . . . 88
8.1 Abstract . . . 88
8.2 Introduction . . . 88
8.3 Experimental . . . 91
8.3.1 Catalyst preparation . . . 91
8.3.2 Experimental setup . . . 92
8.4 Results and Discussion . . . 94
8.4.1 Catalyst characterization . . . 94
8.4.2 Catalytic tests . . . 98
8.4.3 Kinetics on CeO2 FeCralloy . . . 106
8.5 Conclusions . . . 113
8.6 Acknowledgement . . . 114
CHAPTER 9 GENERAL DISCUSSION . . . 115
9.1 General discussion . . . 115
9.2 Limitation and problems . . . 117
9.2.1 Catalyst charaterization . . . 117
9.2.2 Gas phase reaction . . . 117
9.2.3 Reactor coking . . . 118
CHAPTER 10 CONCLUSION . . . 120
10.1 Conclusion . . . 120
10.2 Recommendation for future work . . . 121
LIST OF TABLES
Table 2.1 Gauze catalysts in CPOX reaction. ? only volume flow rate availble. . 12 Table 2.2 Mechanism of catalyst deactivation [1] . . . 17 Table 2.3 Common poisons for specific catalytic reactions over selected catalysts
[1] . . . 18 Table 2.4 Routes to carbon . . . 20 Table 4.1 Materials for catalyst synthesis, feeds, and calibration. . . 30 Table 5.1 Average composition of associated gas in Alberta, Canada and
stoi-chiometry of the flaring . . . 46 Table 5.2 Yearly CO2 reduction vs. number of MRUs operating in the field. . . 46 Table 6.1 Design of experiments. Reaction conditions : T = 900◦C, CH
4/O2 = 2, mass of catalyst = 0.27 g (mass of catalyst* = 0.2 g). The value of gas flow Q is under 25◦C and atmosphere pressure. . . . 59 Table 7.1 Catalyst composition and surface area. CPOX reaction at 2 pressure
with 3 FeCralloy catalysts, at a contact time of 0.15 s under 900◦C with a O2/CH4 ratio of 0.5 (balance Ar to match N2 concentration in air).
mcat : the weight of the catalyst ; hcat : the height of the catalyst bed. 69
Table 8.1 Catalyst composition and surface area. . . 94 Table 8.2 Experiment results of CH4 activation on CeO2 . . . 108 Table 8.3 Fitted oxidation reaction rate constants, carbon deposits and R values 110
LIST OF FIGURES
Figure 2.1 A typical in-situ spray pyrolysis system [2] : (1) Compressed air sup-ply ; (2) Syringe pump and controller ; (3) Spray nozzle ; (4) Substrate holder ; (5) Temperature controller ; (6) Step motor and controller. . . 13 Figure 2.2 A SCS example : the evolution of combustion reaction. When
hea-ted the solution containing Ca(NO3)2, Al(NO3)3 and β-alanine below 1000◦C, we observed a smoldering flame and fine particles formed [3]. 14 Figure 2.3 Effect of reaction conditions on CPOX over Ru catalyst [4] : (a)
Tempe-rature ; (b) Pressure ; (c) CH4/O2 ratio ; (d) Gas hourly space velocity. (Square : XCH4, Sphere : SCO, Triangle : SH2) . . . 15 Figure 2.4 Two types of carbon formed on Ni based catalysts [5] : i) encapsulated
carbon, which envelops the nickel particles resulting in deactivation, and ii) whisker carbon, which grows from the face of the nickel particles and does not alter the rate of synthesis gas formation, but is likely to eventually result in reactor clogging. . . 21 Figure 2.5 Temperature and concentration profile of a Rh supported CPOX
ca-talyst bed [6, 7]. 0 mm indicates the start of the caca-talyst, whereas 10 mm is the end. Before and after this range are heat shields made by two blank monoliths. . . 26 Figure 2.6 CO and H2 are the primary products in CPOX over Rh catalyst and
form in both reaction zones through direct and indirect mechanisms [6, 7]. . . 26 Figure 4.1 Typical setup. . . 33 Figure 5.1 Global flaring (with permission http
://skytruth.org/mapping-global-flaring) on February 19, 2015. Picture points to black box indicates gas flaring in North Dakota’s Bakken Shale is as bright as city lights of Minneapolis or Chicago (Wogan 2013) . . . 36 Figure 5.2 Scheme of the Micro-Refinery Unit. . . 40 Figure 5.3 CH4 conversion and CO and H2 yields at different temperatures,
flui-dized bed, O2/CH4 = 0.45. . . 44 Figure 5.4 CH4 conversion and CO and H2 yields at different temperature,
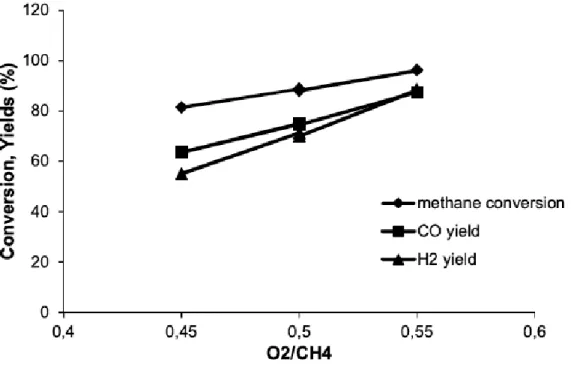
fluidi-zed bed, T = 900◦C. . . . 44 Figure 5.5 Conversion and selectivity at different O2/CH4. Fixed bed ; T = 850◦C ;
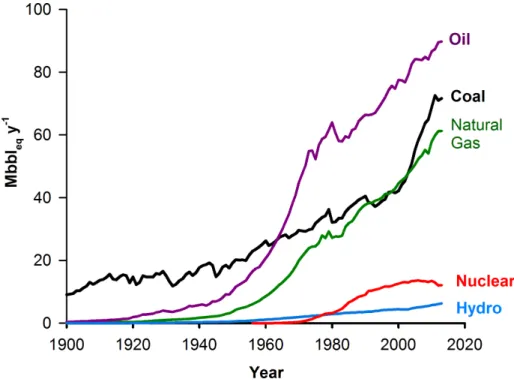
Figure 6.1 Until 1960, coal was the leading energy source in the world. Natural gas rivals coal, while nuclear and hydroelectric energy represent less than 10 % of the total. In 2013, renewable energy contributed 1.5 % of the total energy supply. . . 50 Figure 6.2 (a) uncoated FeCralloy woven fibre ; (b) coated MgO over FeCralloy ;
(c) 1 % Pt/Rh on MgO over FeCralloy . . . 53 Figure 6.3 The reactor was an 8 mm ID quartz tube filled to 300 mm with sand
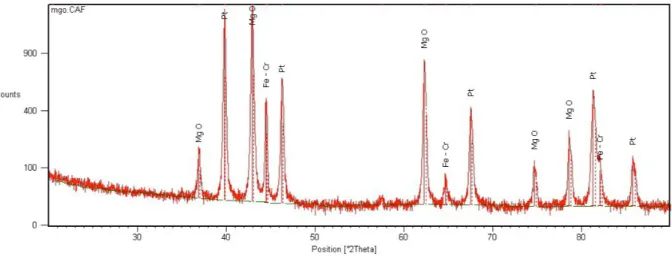
to preheat and distribute the gases to the catalyst. Four mass flow controllers (MKS) metered the gases to the reactor and the analytical instruments to calibrate the feed composition as well as the MS. . . 54 Figure 6.4 XRD pattern of 1 % Pt/Rh on MgO/FeCralloy woven metal fibre catalyst 56 Figure 6.5 SEM micrographs of 1 % Pt/Rh on MgO/FeCralloy (a) x1000 before
reaction ; (b) x1000 after reaction. . . 57 Figure 6.6 (a) x10 000 SEM micrographs of the one typical surface of Pt/Rh/MgO
FeCralloy (b) Mg dispersion ; (c) Pt dispersion ; (d) Rh dispersion. . . 58 Figure 6.7 The composition of the surface of Pt/Rh/MgO fecralloy via SEM-EDS
analysis. . . 58 Figure 6.8 (a) Methane conversion ; (b) CO selectivity ; (c) H2 selectivity ; (d) CO2
selectivity vs. time under elevated pressures with CH4/O2 of 2, 900 ◦C, WHSV = 15 gCH4g−1cath−1. . . . 60 Figure 6.9 (a) Methane conversion ; (b) CO selectivity ; (c) H2 selectivity ; (d) CO2
selectivity vs. time under elevated pressures with CH4/O2 of 2, 900◦C, residence time of 0.1 s. . . . 61 Figure 6.10 Coke formation regime for CPOX calculated at various crystallite sizes
(i.e. activation energies) and pressures with a CH4/O2 ratio of 2 . . . 63 Figure 6.11 Experimental and thermodynamically predicted coking of CH4at 900◦C
for various pressures and residence times (RT) with a CH4/O2 ratio of 2 64 Figure 7.1 Experiment setup. The reactor was an 8 mm ID quartz tube, with a
10 mm high glasswool in the middle supported the catalyst. . . 70 Figure 7.2 XRD characterization of 1) virgin FeCralloy ; 2) oxidized FeCralloy ;
3) 1 % Pt/Al2O3/FeCralloy catalyst synthesized by spray pyrolysis ; 4a) 1 % Pt over oxidized FeCralloy by solution combustion synthesis (intensity 0 – 3500) ; 4b) 1 % Pt over oxidized FeCralloy by solution combustion synthesis (intensity 0 – 500). . . 72
Figure 7.3 (a) Fresh virgin FeCralloy is non-porous and mainly consists Fe, Cr and Al. (b) Used virgin FeCralloy after CPOX reaction. From left to right are the first, the middle and the last piece of catalyst. The first piece that first contacted the inlet stream coked the most, while the last piece had no coke but an oxidized layer. (c) Regenerated virgin FeCralloy, its surface was completely oxidized. . . 73 Figure 7.4 (a) Fresh oxidized FeCralloy. An EDS map analysis confirmed an
alu-mina layer predoalu-minantly formed. (b) Used oxidized FeCralloy after CPOX reaction. The lower right picture shows the whisker coke for-med on oxidized FeCralloy ; the upper right one magnifies the newly formed globular alumina grains. An EDS map analysis of the rectangu-lar region presented the surface composition. (c) Regenerated oxidized FeCralloy. . . 74 Figure 7.5 (a) Fresh Pt/Rh FeCralloy. The upper right picture shows the Pt
dis-tribution in the selected region ; a map sum spectrum displays the element composition. (b) Used Pt/Rh FeCralloy after CPOX reaction. The upper left picture reveals the Pt distribution after rection. (c) Regenerated Pt/Rh FeCralloy. . . 76 Figure 7.6 (a) Methane conversion ; (b) H2 selectivity ; (c) CO selectivity vs. time
under atmosphere pressure with CH4/O2of 2, 900◦C, τ = 0.15 s. Cross : blank ; solid symbol : Pt/Rh FeCralloy ; hollow symbol with plus : virgin FeCralloy ; hollow symbol : oxidized Fecralloy. . . 81 Figure 7.7 Compared with equilibrium of 0.1 MPa (solid line) calculated by
Fact-sage, the effect of temperature on methane conversion (blue cicle), H2 selectivity (red square), CO selectivity (green diamond), CO2 selecti-vity (yellow triangle) and C selectiselecti-vity (grey circle) with Pt/Rh Fe-Cralloy catalyst at 0.1 MPa, CH4/O2=2, at a contact time of 0.15 s. . 82 Figure 7.8 (a) Methane conversion ; (b) H2 selectivity ; (c) CO selectivity vs. time
under elevated pressure of 2 MPa with CH4/O2 of 2, 900◦C, τ = 0.15 s. Cross : blank ; solid symbol : Pt/Rh FeCralloy ; hollow symbol with plus : virgin FeCralloy ; hollow symbol : oxidized Fecralloy. . . 83 Figure 7.9 Compared with equilibrium of 0.1 MPa (solid line) and 2 MPa (dash
line) calculated by FactSage, methane conversion (blue cicle), H2 se-lectivity (red square), CO sese-lectivity (green diamond), CO2 selectivity (yellow triangle) and C selectivity (grey circle) with Pt/Rh FeCralloy catalyst at 2 MPa, CH4/O2=2, at a contact time of 0.15 s. . . 84
Figure 7.10 The effect of CH4/O2 ratio on methane conversion (blue), H2 selecti-vity (red), CO selectiselecti-vity (green) and C selectiselecti-vity (grey) with Pt/Rh FeCralloy catalyst at 2 MPa, 900◦C, at a contact time of 0.15 s. . . . 85 Figure 7.11 A 255 min CPOX reaction at 900◦C, 2 MPa, CH4/O2=0.7, with Pt/Rh
FeCralloy catalyst (due to the breakdown of mass flow controller, we lost two data points at 35 and 45 min). We also compared the me-thane conversion (blue cicle), H2 selectivity (red square), CO selectivity (green diamond) and C selectivity (grey cross) of the 255 min test with the previous 65 min test (smaller symbols) under the same condition. 86 Figure 7.12 The repeatability of 1 % Pt/Rh FeCralloy catalyst in CPOX reaction
at 900◦C, 2 MPa, CH4/O2=0.5, at a contact time of 0.15 s. Methane conversion (blue), H2 selectivity (red), CO selectivity (green) . . . 87 Figure 8.1 Heated FeCralloy (>600◦C) and its temperature distribution taken by
FLIR T420 infrared camera. . . 90 Figure 8.2 Comparison of the pressure drop of common inert reactor fillings,
glass-wool and sand, and FeCralloy under different flow rate at room tem-perature and ambient pressure. . . 91 Figure 8.3 XRD patterns : 1) 5 % CeO2 FeCralloy ; 2) 1 % Pt/ 5 % CeO2
FeCral-loy ; 3) 1 % Pt/CeO2-Al2O3 FeCralloy (CeO2 : Al2O3 = 79 : 21). Black squre : FeCr ; red circle : α-Al2O3; blue star : Pt ; purple plus : CeO2. 95 Figure 8.4 (a) Fresh CeO2 FeCralloy (Map spectrum Wt % : Ce, 56.9 ; O, 18.9 ;
C, 14.1 ; Al, 6.4 ; Fe, 2.3). The upper left picture magnifies and ex-poses the aggolomeration of cerium oxide. (b) The bare part of used CeO2 FeCralloy after CPOX reaction. The upper left picture shows the whisker coke that attached to the fibre surface. The upper right pic-ture manifies a catalyst fibre not fully covered with whisker coke. (c) Regenerated CeO2 FeCralloy. . . 96 Figure 8.5 (a) Fresh Pt/CeO2FeCralloy (Map spectrum Wt % : Ce, 48.1 ; O, 21.0 ;
Pt, 15.2 ; Al, 11.8 ; Fe, 2.5). (b) Used Pt/CeO2 FeCralloy after CPOX reaction (Map spectrum Wt % : Ce, 59.9 ; O, 19.5 ; Pt, 11.0 ; Fe, 5.5 ; Al, 3.9). (c) Regenerated Pt/CeO2 FeCralloy. . . 97
Figure 8.6 CPOX at ambient pressure with CeO2 FeCralloy under different tem-perature. There is a narrow turnover zone around 700◦C. Methane conversion : blue circle ; CO selectivity : green diamond ; CO2 selec-tivity : ginger triangle. Dash line of calculated thermodynamic equi-librium vs. temperature : methane conversion : blue ; CO selectivity : green ; CO2 selectivity : ginger. . . 99 Figure 8.7 CPOX at ambient pressure with Pt/CeO2 FeCralloy under different
temperature. Low activity caused a much wider temperature range around 600◦C where methane starts to activate. Methane conversion : blue circle ; CO selectivity : green diamond ; CO2 selectivity : ginger triangle. Dash line of calculated thermodynamic equilibrium vs. tem-perature : methane conversion : blue ; CO selectivity : green ; CO2 se-lectivity : ginger. . . 100 Figure 8.8 Methane conversion, H2 selectivity and CO selectivity of CeO2
FeCral-loy and Pt/CeO2 FeCralloy in CPOX at 900◦C under pressure of 0.1 MPa and 2 MPa. As a comparison, the homogeneous reaction was wi-thout active components but inert glasswool fillings. . . 101 Figure 8.9 Seperately feeding (a) methane and (b) oxygen to Pt/CeO2 FeCralloy
at 900◦C and ambient pressure, the outlet gas composition (exempt inert gas Ar, analyzed by GC) of methane : blue circle ; O2 : red cross ; H2 : scarlet square ; CO : green diamond ; CO2 : ginger triangle. . . . 104 Figure 8.10 Seperately feeding (a) methane and (b) oxygen to CeO2 FeCralloy at
900◦C and ambient pressure, the outlet gas composition (exempt inert gas Ar, analyzed by GC) of methane : blue circle ; O2 : red cross ; H2 : scarlet square ; CO : green diamond ; CO2 : ginger triangle. . . 105 Figure 8.11 Oxidation model predictions (solid lines) versus experimental data
(sym-bols) for test at 950◦C. . . 111 Figure 8.12 At 2 MPa, 900◦C, in a continuous 180 min reaction, (1a) methane
firstly reduced the fresh Pt/CeO2FeCralloy ; then 3 oxidation-reduction cycles (1st : (1b) and (1c) ; 2ed : (2a) and (2b) ; 3rd : (3a) and (3b)) revealed the change of its surface state. The outlet gas composition (analyzed by online MS) of methane : blue ; O2 : red ; H2 : black ; CO : green ; CO2 : ginger. . . 112
Figure 9.1 A typical TGA pattern of the oxidation of coked Pt FeCralloy ca-talyst. 50 mm of N2 flow swept the sample and temperature increa-sed from room temperature to 150◦C at a heating rate of 5◦C min−1. Kept isothermal for 15 min. Then 50 mm of O2 flow swept the sample and temperature increased from 150◦C to 850◦C at a heating rate of 5◦C min−1. Kept isothermal for 60 min. . . 118
LIST OF SYMBOLS AND ABBREVIATIONS
GtL Gas-to-Liquids
µGtL Micro Gas-to-Liquids technology
FT Fischer-Tropsch
CPOX catalytic partial oxidation SMR Steam Methane Reforming POX Partial Oxidation
ATR Auto-Thermal Reforming MRU Micro-Refinery Unit
SCS Solution Combustion Synthesis GGFR Global Gas Flaring Reduction BCM billion cubic meters
EIA U.S. Energy Information Administration SEM Scanning electron microscopy
EDS Energy Dispersive Spectroscopy WHSV Weight hourly space velovity TOF Turnover frequency
La Diameter of crystallites composing the coke
n number of tanks in the n–CSTR in series model Pe Peclet number of axial dispersion
r reaction rate, µmol g−1s−1 Ea activation energy, kJ mol−1
k0 reduction reaction rate constant, µmol g−1s−1
ki oxidation reaction rate constant, i = 1,2,3, cm3mol−1s−1
Ci selectivity to compound, molm−3 (if i is solid, mole O2 per m3 CeO2)
R2
i coefficient of determination
Si selectivity to compound i
tm mean residence time, s
Ug gas linear velocity, m s−1
X conversion, % Pi partial pressure
Fi molar flow rate of reactants, mol s−1
φ objective function for modeling τ contact time
CHAPTER 1 INTRODUCTION
1.1 Background and problem identification
Syngas, also called synthesis gas, consists of a mixture of hydrogen and carbon monoxide. It is a crucial intermediate to produce synthetic hydrocarbon fuels via the Fischer-Tropsch technology, and to produce hydrogen or methanol. We can produce syngas from natural gas, including tight gas, shale gas, coal bed methane or wasted associated gas — flare gas. At high pressures, typical in most oil reservoirs, associated gas is dissolved in crude oil. When the crude is pumped to the surface, it vaporizes out of solution. The main content of this associated gas is CH4 (81 %). Gas flaring is the easiest and most economical way to discard associated gas. As CH4 has a greenhouse effect 20 times (which increases with time : around 60 within 20 years) higher than that of CO2 [8], venting it from the well-head to the atmosphere is worse than flaring with respect to the environmental impact. Remote oil field locations also make it difficult to build pipelines or electricity transmission lines to utilize associated gas.
Flaring associated gas produces mainly H2O and CO2, but also CO along with a variety of air pollutants, such as NOx, SO2 and toxic heavy metals. The air pollution associated with flaring and venting of natural gas puts the health of local communities and extraction site workers at risk [9]. The World Bank launched the Global Gas Flaring Reduction partnership in 2002 as part of the World Summit on Sustainable Development. They estimated that every year petroleum companies flare as much as $35 billion worth of natural gas.
Venting and flaring gas is not a option, the transportation of natural gas is also limited because of expensive costs in pipelines and infrastructure. Gas-to-Liquids (GtL) technologies present an attractive alternative : transforming the associated natural gas into added-value liquid products and meantime reducing greenhouse gas emissions, brings both economical and environmental benefits. Gas-to-Liquids (GtL) technologies generate various GtL products, such as high quality naphtha, jet fuels, diesel, lubes and waxes, which can be transported by the existing pipelines and infrastructure [10]. The Fischer-Tropsch (FT) technology, a dominating process in GtL, relies on the production of syngas (H2/CO ratio of 2).
The first problem is that converting methane to Fischer-Tropsch liquid products calls for multi-stage process. Conventional processes to convert methane to syngas - steam reforming, CO2 reforming and auto-thermal reforming - are suitable for large scale industry. Some companies have been looking for smaller scale and simpler process to reduce the large capital
cost [11]. Considering the amount of associated nature gas is relatively small and not steady, we need to find a solution suitable for micro scale industrial process.
In this project, we aim to create a mobile and scalable Micro-Refinery Unit (MRU) deployable at the well-head to convert associated gas into high value liquid fuels, and reduce greenhouse gas emissions. This unit would combine two processes in a single reactor : catalytic partial oxidation and Fischer-Tropsch (favors 2 MPa).
Catalytic partial oxidation of methane is a mild exothermic reaction which saves external energy. It produces H2 and CO at a ratio of 2, suitable for Fisher–Tropsch process. Converting methane to syngas under high pressure is in high demand for the further FT process. The second problem is that high pressure inhibits CPOX reaction and promotes coke forma-tion, a suitable CPOX catalyst candidate for working at extreme conditions and resist coking is necessary.
Although Ni based catalysts are good candidates for industrious purpose due to their cheap cost, a major problem is the irreversible deactivation by coke formation and Ni sintering. Compared to Ni catalysts, noble catalysts (Pt or Rh) are more expensive but with much less loading, they show better activity and stability and resistance to coke formation which extends their lifetime. Also the choice of the support, promoters and preparation techniques can greatly affect the catalyst activity and stability and further coke formation.
FeCralloy fibres can work at temperature over 1050◦C for 3000 h. Its knitted structure allows high gas flow output. Based on these, CPOX over new catalysts supported on FeCralloy fibres will be an interesting and promising topic.
1.2 Objectives
The main objective of the present study is to develop a high pressure catalytic methane partial oxidation process to produce syngas suitable for the Fischer-Tropsch reaction, over noble metal catalyst supported on FeCralloy fibres.
The first specific objective is catalyst design. A suitable catalyst under optimum operation conditions can maximize the conversion of methane and the selectivity of syngas. Preparing effective and novel catalysts is the first issue of this work.
Different combinations and composition of metals, supports and promoters affect catalyst properties, especially on activity and the thermal stability. The preparation methods also affects the catalyst structure and thus its performance.
selec-tivity to determine an appropriate catalyst.
The second specific objective is process design. Beside the catalyst nature, reaction conditions also influence methane conversion and syngas selectivity in CPOX. Reaction conditions refer to reactor type, choice of catalyst and pre-treatment, external conditions, like temperature, pressure, methane and oxygen (air) ratio, gas flow rates regards to contact time, and the feeding order of methane and oxygen.
We further focus the study of CPOX reaction under atmosphere pressure and 2 MPa, and optimize the reaction condition to maximize the methane conversion and syngas selectivity and limit coke formation.
The third specific objective is to study the catalyst deactivation and regenerative ability. To prolong the lifetime of catalysts, we would identify the impact of temperature and pressure on coke build–up, characterize the coked catalyst to identify the coke type and investigate the regenerative ability of the catalysts.
The fourth specific objective is to study the reaction kinetics. A better understanding of the relationship between reactive species on the catalyst surface is necessary. The last series of experiments consist of data aimed to kinetic modelling. Developing suitable models for methane reduction and oxidation are necessary.
CHAPTER 2 LITERATURE REVIEW
The world’s energy consumption is growing fast especially in Asia and China has become the world’s second largest consumer of oil after the USA [12]. Fossil fuels still dominate the world energy production. The proved oil reserves concentrate in the middle East and Russia [12]. Apart from middle east, the rest big fraction of the reserves presents as oil sand (tar sand) and other non-conventional sources [13]. The cost of exploration and production steadily increases. At the present world production rate, the proved oil reserves will deplete within 40 years [12]. Therefore there is a strong need for alternative fuels and a flexible energy network, such as liquefied petroleum gas (LPG), natural gas, methanol, dimethylether (DME), ethanol, biodiesel, synfuels and hydrogen [12].
All oil production produces associated natural gas. As many oil fields are far from the market-place and often off-shore, we call this gas ”remote gas” or ”stranded gas” [14]. Oil producers sometimes reinject the associated gas to reinforce the oil recovery. However a significant frac-tion (5 % of the total natural gas producfrac-tion) is flared [15], due to economical issues and technical limitations.
GtL converts natural gas into liquid fuels either via direct conversion or via syngas as an intermediary (indirect GtL). Indirect GtL has high carbon efficiency. Synthesis gas (syngas) is the key intermediate step in the indirect route of GtL. Syngas is a mixture of hydrogen, carbon monoxide and carbon dioxide. It may contain nitrogen for ammonia synthesis [12]. Syngas creates flexibility for the chemical industry and for the manufacture of synthetic fuels (synfuels) thus is important in energy conversion [16]. Almost any carbon source, natural gas, oil products, coal and biomass, can produce syngas. Recent trends in syngas application concentrate on the conversion of cheap remote natural gas into liquid fuels (GtL). Oil is the most versatile fossil fuel with high energy density and is easy to ship with the existing pipelines and infrastructure.
Industry and academy are looking for : 1) scaling up to large scale GtL plants (more than 500 000Nm3
syngash−1), or, 2) scaling down to small, compact syngas units, for example fuel
cells (5 – 100Nm3
syngash−1) [12].
Syngas production may be responsible for 60 % of the total investment of a large-scale natural gas conversion plant [12]. Therefore, we need to optimize syngas production processes.
2.1 Syngas production processes
Conventional processes to produce syngas from methane include : Steam Methane Reforming (SMR), Dry Reforming (DRM), Partial Oxidation (POX), and Auto-Thermal Reforming (ATR).
2.1.1 Steam Methane Reforming (SMR) and Dry Reforming (DRM)
Among all the syngas production methods, the steam reforming process is a mature techno-logy [17]. It is the most widely used technique in industry for large scale production. In SMR, methane reacts with steam to produce hydrogen and carbon monoxide at a H2/CO ratio of 3.
CH4+ H2O = CO + 3H2 ∆H = 206 kJ mol−1 (2.1) The process operates between 430◦C and 1000◦C and pressure between 1.5 MPa to 3 MPa. SMR is highly endothermic and its catalyst is normally Ni on a stable support due to their cheap cost [18]. A typical SMR process includes tubular and packed reactors with heat recovery to preheat the feed gas or to increase steam in waste heat boilers [10]. It is an energy intensive process. The large capital cost makes it uneconomical for small scale units ; also its high H2/CO ratio need separation for follow up Fischer-Tropsch process.
Another appealing reforming process is carbon dioxide reforming (dry reforming, DRM). It is also a strong endothermic reaction with higher enthalpy than SMR :
CH4+ CO2 = 2CO + 2H2 ∆H = 247 kJ mol−1 (2.2) CO2 reforming is suitable for treating CO2 rich associated gas and its H2/CO ratio of 1 is ideal for carbonylation reactions but not for Fischer-Tropsch process.
2.1.2 Auto Thermal Reforming (ATR)
In Auto Thermal Reforming process, oxygen and steam react with methane to produce syngas [18]. ATR is a hybrid of homogeneous partial oxidation and steam reforming. The exothermic oxidation provides the energy to sustain the endothermic steam methane reforming reaction, so the maximum reaction temperature decreases and the oxygen consumption is lower. ATR reactor consists of a burner, a combustion chamber, and a fixed catalyst bed placed in a compact refractory lined vessel [19]. The process operates between 900◦C to 1150◦C with
pressure between 1 to 8 MPa. Typically, O/C is between 0.5 – 0.6 with O2 as oxidant [20] and the temperature of the flame core exceeds 2000◦C. One advantage of ATR is the controllable H2/CO ratio based on the downstream need. The adiabatic heat balance determines the exit temperature ; the thermodynamic equilibrium at that temperature determines the product gas ratio [12]. The ATR reactor is more compact than a SMR reformer, however, larger than a POX unit. The catalyst should withstand high temperature without excessive sintering and contain no volatile components at extreme conditions. Industry often employs nickel on magnesium alumina spinel catalysts.
2.1.3 Partial oxidation (POX)
In partial oxidation reaction, methane reacts with a substoichometric amount of oxygen to produce hydrogen and carbon monoxide at a 2 : 1 ratio. It is a mildly exothermic reaction.
CH4+12O2 = CO + 2H2 ∆H = −36 kJ mol−1 (2.3)
Homogeneous POX
Homogeneous partial oxidation operated at high temperature (1200◦C to 1500◦C) without catalysts [18]. Non catalytic POX needs high temperature to ensure complete conversion and to reduce coke formation. A separate soot scrubber system in the downstream should be installed to remove the coke.
High temperature POX may have fewer CH4 and CO2 in the outlet than ATR [12]. However, higher reaction temperature calls for burning additional fuel. The POX reactor is less efficient than a steam reformer due to the less efficient heat recycle [12].
Catalytic partial oxidation (CPOX)
A catalyst would significantly reduce the operating temperature of the POX reaction, which is economically attractive [21].
Catalytic partial oxidation of methane with oxygen produces syngas at high space velocity over solid catalysts below 1000◦C. In 1929 Liander, who was interested in the ammonia process, first suggested CPOX that occurred above 850◦C [21]. Unlike the intensive develop-ment of SMR, CPOX remained almost unexplored until 1990 [4]. Pioneer work of Hickman and Schmidt demonstrated that CPOX reaction with Rh catalyst can achieve almost fully conversion of methane directly to H2 and CO at reaction times as short as 1 ms [22, 23, 24].
What’s more, following the initial employment of Pt-10% Rh [22, 25], researchers have studied various metallic gauze catalysts. Methane conversion and CO selectivity are low on Pt gauze operating between 200◦C to 900◦C [4]. Adding Rh to the Pt (Pt/Rh = 9) increased the conversion to 30 % [26]. Surface oxides of Pd, Pt and Pt-Ir form and degrade catalytic activity more than Pt-10%Rh [4, 26, 27, 28, 29]. CO selectivity was 95 % at 1000◦C and 0.1 MPa in a 15 mm quartz reactor operating with a CH4/O2 ratio of 2 [27]. Pd and Ni metals on stainless steel gauzes and FeCralloy woven metal fibres convert almost 100 % of the methane at 90 % CO selectivity with little coke ( 0.1 %) [30, 31].
In summary, advantages of CPOX are as following :
1) it is mildly exothermic, which makes it convenient for industrial processes from an energy management perspective ;
2) The H2/CO molar ratio of 2 is ideal for the Fischer-Tropsch reaction, and it avoids the process to remove excess hydrogen as SMR ;
3) the CO2 content can be quite low, suitable for direct further process ; 4) it avoids the large capital cost in superheated steam ;
5) it allows higher gas hourly space velocities and thus the capital cost and production scale to achieve large capacity are lower.
2.2 Catalysts of methane catalytic partial oxidation
The CPOX catalysts enhance reaction rate and allow high gas velocities while approaching thermodynamic equilibrium. The choice of catalyst is a crucial component of the CPOX reac-tion. Therefore, the investigation of their composition, structure, and preparation methods is essential for better understanding catalyst performance.
2.2.1 Metals and their activation
The group VIII metals are active in methane activation. Therefore CPOX catalysts divide into two main groups : non-noble metals (Ni, Co and Fe, etc.) and noble metals (Pt, Pd, Rh Ru, and Ir, etc.).
The low price of Ni ($0.013/g) based catalysts makes them the most widespread used catalysts in steam reforming. However, methane cokes on Ni more rapidly than noble metals and surface carbon species, such as carbide species and filaments, form on the surface and may alter the catalyst structure [32]. More importantly Ni sinters at high temperature, resulting in a Ni particle growth and a loss of surface area and activity [12]. Co presents a lower activity than
Ni, as it easily become oxides under the process conditions [33]. Iron is active in SMR when under strong reducing conditions in the hot part of a shaft furnace [12].
The noble metals catalysts show better performance in terms of stability and reactivity [34], and resist to coke formation because carbon does not dissolve in those elements [35]. Although they are more expensive (for example Pt $28/g), they operate at high space velocity in CPOX thus decreasing the metal loading and the total cost. Among all the noble metals, Rh and Pt are the most active and stable CPOX catalyst [18]. Pt showed lower activity and H2 yield than Rh [23, 36, 37], , but its price is lower. CPOX reaction rate increases with pressure when maintaining the constant gas hourly space velocity over Pt, but the rate is less prominent for Rh [18]. Rh and Ru showed 10 times higher turnover frequency (TOF) values than Ni, Pt, or Pd [38, 39]. One study [40] declared Pt to be the most active metal.
Pre-reduction of the catalysts is to have stable metallic state, and the reduced catalysts will be oxidized again when exposed to an oxidative atmosphere [12]. The reduction of pure nickel oxide by hydrogen starts at temperature between 200◦C – 250◦C. Supported catalysts require higher reduction temperature due to the interaction with support [12]. The addition of small amounts of Pt, Pd or Cu to the catalyst may enhance the activation rate, probably by providing more active sites for the dissociation of hydrogen [33].
Industrial catalyst are activated by various reducing agents, such as hydrogen, steam, hydro-carbons, etc, [33]. Hydrogen or carbon from thermal cracking of hydrocarbons could act as an initiator for the reduction process [12]. In SMR, when metallic nickel is available, sufficient hydrogen forms to reduce the catalysts quickly [12].
The ignition temperature of the activation depends on the reactivity of the source material and the state of the catalyst [16]. Activation starts in the hot part of the reactor and the activation zone moves backwards to colder inlet [15]. The mechanism may involve H2 back diffusion from activated catalysts to the neighboring inactivated ones. In lab-scale systems for SMR process, operating at different conditions, additional H2 should be present in the feed gases to prevent catalyst from oxidation [12].
2.2.2 Non-metal catalysts
Sulphur poisons VIII group metals. Problems in desulphurizing heavy feedstocks lead to investigate non-metallic catalyst, although their reaction rates are often lower than transition metals [12]. In SMR and CPOX, molybdenum carbide and tungsten carbide reflected high activity [41, 42]. In syngas atmosphere, carbides are stable only at elevated pressures (9 bar) or high concentration of CO, and convert into oxides at ambient pressure [12]. Molybdenum
carbide is hardly stable in a plug-flow reactor [42], because it easily becomes oxidized from the inlet.
Others attempted ceria as catalysts for reforming processes, especially in high temperature fuel cells. CeO2 has an activity of two orders lower than Ni [43].
2.2.3 Supports
CPOX reaction occurs on the catalyst surface, so the exposed surface area determines the catalyst performance. Stabilization of the metal catalyst by distributing it on the support maximize its surface area. The industrial catalyst exposed to severe conditions, for example in a tubular reformer involving steam partial pressure close to 30 bar and temperature above 800◦C [12]. The support should be able to withstand these conditions without losing strength. Furthermore, it should not contain volatile components.
There has been a widely trend towards ceramic-based catalysts. Al2O3, MgO, SiO2, etc. are not easy reducible ones oxides [44]. They also involved in reactions as followed :
SiO2+ 2H2 ↔SiH4(gas) + 2H2O (2.4) SiO2+ 2H2O ↔ Si(OH)4(gas) (2.5)
Al2O3+ H2O ↔ 2AlO(OH) (2.6)
Al2O3+ 2KOH ↔ 2KAlO2+ H2O (2.7)
MgO + H2O ↔ Mg(OH)2 (2.8)
Silica is volatile (Eq 1.5) at high temperature in high pressure steam (for example, at 600–900 K and 1–100 atm steam pressure, Si(OH)4isthemostlikelysilicon−containinggaseousspecies), unless combining it with alkali. Silica would slowly escape from the catalyst (or brickwork) and deposit on the heat exchangers and catalytic reactors downstream of the reformer [12]. At high temperature, MgO supported catalysts are sensitive to steam at low temperature because of hydration (Eq 1.8). The reaction may result in breakdown of the catalyst due to an expansion of the molecular volume. At pressure typical of tubular reformer, hydration cannot take place at temperature above 350◦C [12]. In industrial circumstance, hydration is a problem only when the magnesia-based catalyst expose to liquid water or close to the condensation temperature [45]. Magnesia reacted with alumina to magnesium aluminium spinel (MgAl2O4) eliminates hydration, because spinel support is robust and withstand high reaction temperature [12].
The most common support is Al2O3, including α-, θ-, δ-, and γ-Al2O3 phases. For Ni based catalysts, the activity for different support is : Ni/γ-Al2O3 < Ni/δ-Al2O3 < Ni/θ-Al2O3 ≈ Ni/α-Al2O3 [46]. α phase alumina is the most stable phase. γ-alumina has high surface area, is suitable catalyst support for low temperature adiabatic reforming. But after reaction at 850◦C for 4 h, Al2O3 of γ phase turns to α phase [46].
CeO2, TiO2, ZrO2, etc. are relatively easy reducible oxides [44]. Rh catalyst supported on reducible oxide deactivated fast, possibly due to the decrease of active catalyst sites which replaced by suboxide [44].
The surface PH affects the catalyst activity and coke formation. Normally, the acid sites on catalyst surface promote the coke formation, as strong acid sites have significant effects on coke formation reactions such as cyclization and hydrogen transfer reaction and these sites are preferentially deactivated by coke [46]. Mehr [47] found that catalysts supported with MgO reduced coking and were more stable, because of the basic state of MgO. Among the irreducible oxides, Rh catalyst with MgO support shows the highest catalytic activity with stability [44].
The oxygen storage capacity of support also affects the catalyst activity. The lattice oxygen of CeO2 could react with carbon to form CO and thus accelerate the methane conversion [48]. Cerium oxides (CeO2, Ce2O3) found out to improve noble metal stability and the oxygen adsorption rates [49].
The support is either a powder or a pre-shaped solid. The conventional granule catalysts have problems like high pressure drop, uneven metal dispersion, large temperature gradient of catalyst bed, etc. Structured catalysts like monolith and gauze (fibers) combining mechanical strength and thermal resistance, can overcome those problems.
Monolith catalyst have 3 main parts, support body (ceramic or metallic), washcoat (oxides, such as Al2O3) and active species (noble metals). The surface area of monolith support is usually low, therefore, preparing a washcoat with high surface area is necessary.
Metal gauze acts as active component and also support. Gauze catalysts can achieve ex-tremely high space velocities (12 000 000 h−1), allowing greater throughput for an industrial scale. Initial gauze catalysts in CPOX are pure Pt and Rh metal gauzes [22, 25]. FeCral-loy metal woven fibre is also an suitable support for preparing CPOX catalyst, however, there is few study on it [30, 31, 50]. Table 2.1 summarizes the experimental conditions and performance of gauze catalysts in CPOX reaction.
2.2.4 Promoters
Three types of promoters often participate in CPOX reaction : rare earth (Ce, La, etc.) oxides, alkaline earth metal (Mg, Ca, Ba, etc.) oxides and precious metal elements.
Adding promoters improves catalyst activity and stability [46]. Wang [51] found that the effect of promoters on Ni/α-Al2O3 catalyst is more significant than on Ni/γ-Al2O3 catalyst. A low loading of Ce serves a well dispersion, but high loading forms bulk CeO2 and decreases the catalytic activity. Promoters also show resistance to carbon deposition by increasing surface carbon gasification, or inhibiting carbon solubility [18].
However, loading large amount of promoters may decrease the active sites and then decrease the activity [51, 52, 53]. Alkali as a promoter to eliminate carbon formation may escape slowly from the catalyst. High temperature increases the alkali loss while adding acidic components could restrain it [12]. The volatized alkali may deposit in colder parts of the reactor system and hydroxyl ions strongly promote stress corrosion in stainless steel [33]. Moreover, alkali reacts with some catalyst support materials (γ-alumina), causing a decrease in mechanical strength [12].
12 Catalysts Temperature Pressure τ CH4/O2 ratio XCH
4 SCO SH2 ◦C MPa s Pt [54] 500-800 0.1 0.14-0.0002 2 31 7 low Pt [26] 200-900 0.1 0.00021-0.00042 2 20.9 89.9 10.7 Pt [27] 700-1100 0.1 0.00021-0.00033 2 25 95 28 Pt/10%Ir Pt/5%Rh Pt/10%Rh Pt/10%Rh [26] 200-1050 0.1 0.00015-0.0005 2 33 96.3 33.9 Pt [55] 670-920 0.1 0.02–0.2 2.5 5 50 – Pt [56] 800-1100 0.1 – – 25 97 96 Rh [57] 1000-1200 0.1-3 0.024-0.00036 – 97 97 89 Steel gauze [30] 950 0.1 ?70 mL min−1 2.5 32.5 19.6 – Pd/steel gauze 950 90-97 3-97 – FeCrAl foil 900 38.5 49.5 – Pd/FeCrAl foil 920 99.2 88.6 –
2.2.5 Catalyst preparation methods
The common CPOX catalyst preparation methods include : 1) Impregnation
The metal precursors dissolves in an aqueous or organic solution and contact a porous sup-port. Capillary action dominates the adsorption process. By drying and calcining to drive off the volatile components we can obtain the catalyst.
2) Co-precipitation
One or more metals are precipitated together with the mixture of the precursors and support. It is a one step reaction and can reach high metal loading up to 80 %. The drawback is the particle agglomeration and uneven composition.
Methods such as sol-gel or electrochemical methods are limited in industrial process due to the high cost. In our study we also consider other preparation methods.
3) In situ spray-pyrolysis
Figure 2.1 A typical in-situ spray pyrolysis system [2] : (1) Compressed air supply ; (2) Syringe pump and controller ; (3) Spray nozzle ; (4) Substrate holder ; (5) Temperature controller ; (6) Step motor and controller.
In situ spray pyrolysis [2] is a versatile technique to produce materials with various compo-sition, size and morphology. One typical spray pyrolysis apparatus consists compressed air supply to atomize the precursor solution through a nozzle (Figure 2.1). Spray pyrolysis is
suitable for industrial applications, as it allows widely solution recipes ; moderate operation temperature ; easy controlling film thickness, and no local overheating.
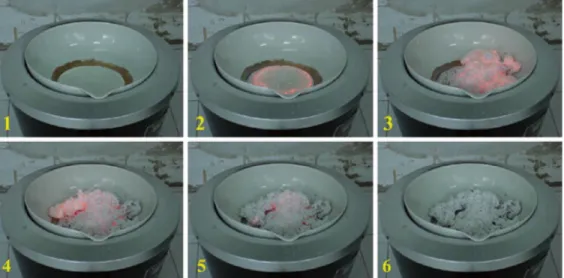
Figure 2.2 A SCS example : the evolution of combustion reaction. When heated the solution containing Ca(NO3)2, Al(NO3)3and β-alanine below 1000
◦C, we observed a smoldering flame and fine particles formed [3].
4) Solution combustion synthesis
The principle of solution combustion synthesis (SCS) method [3] is that once initiate one reaction by heating, an exothermic reaction can self-sustain the temperature for combustion and to produce homogeneous powder product (Figure 2.2). By preparing the combination of metal salts (nitrates, sulfates and carbonates) as oxidants in an aqueous solution with a fuel (glycine, urea and other soluble carbohydrates) as reducing reagents, the reaction occurs when reaching the ignition temperature. The powder can be a single phase pyrolysed product with/without subsequent heat treatment.
SCS is a relatively simple, cheap and fast process ; it can be adapted to coat nanocrystalline metal oxides, such as Al2O3, and zero-valent metal onto monoliths, honeycombs and gauzes. Prepared by SCS, Ru/Al2O3 loaded on monolith catalyst for oxy-steam reforming of methane [58], and palladium on zirconiastabilised lanthanum manganese oxide perovskite on FeCralloy gauzes for natural gas combustion [50] are quite active.
2.2.6 The effect of different reaction conditions
The CPOX system consists multiple reactions besides SMR (Eq 1.1), DRM (Eq 1.2) and POX (Eq 1.3) [4] :
CH4+ 2O2 →CO2 + 2H2O (2.9) H2+12O2 →H2O (2.10) CO + 1 2O2 →CO2 (2.11) CH4 C + 2H2 (2.12) CO + H2 C + H2O (2.13) CO + H2O CO2+ H2 (2.14) 2CO CO2+ C (2.15)
Figure 2.3 Effect of reaction conditions on CPOX over Ru catalyst [4] : (a) Temperature ; (b) Pressure ; (c) CH4/O2 ratio ; (d) Gas hourly space velocity. (Square : XCH4, Sphere : SCO,
Effect of temperature
At temperatures lower than 450 K, CPOX cannot occur [21]. For temperatures between 500 K and 1120 K, thermodynamics equilibrium calculations [4] can predict the POX products. It suggests that higher temperature increases methane conversion and CO and H2 selectivity (Figure 2.3 (a)).
Effect of pressure
Increasing the pressure decreases both the methane conversion and CO and H2 selectivity, predicted by the thermodynamics [4]. Otherwise, at increasing pressures, higher temperatures are necessary to obtain high conversion, and high selectivity to H2and CO. Elevated pressure inhibits the reforming reactions since they result in gas expansion, while hardly affecting the complete oxidation of methane. Therefore more CO2 and H2O form with increasing pressure. The experimental results of CPOX are very close to the thermodynamic predictions (Figure 2.3 (b)).
Effect of CH4/O2 ratio
The effect of the CH4/O2 ratio on the product distribution from the CPOX reaction is shown in Figure 2.3 (c). A CH4/O2 ratio of 2 is ideal for CPOX. A ratio higher than 2 brings excess methane and lower the methane conversion, but increases H2 and CO selectivities as stoichiometry is unfavor the total combustion reaction. A ratio below 2 with more oxygen generates more CO2 and H2O. Feeding CH4/O2 at a ratio of 0.5 yields complete combustion products (CO2 and H2O) [4].
Effect of gas flow rate
At space velocities lower than 40 000 h−1, CPOX can reach thermodynamic equilibrium. At higher space velocities, kinetics become limiting the CPOX and may not reach equilibrium (Figure 2.3 (d)).
2.3 Catalyst deactivation
Catalyst deactivation, the loss of catalytic activity and/or selectivity with time, is tricky but inevitable in industrial practice [1]. The expenses of process shut-down and replacement of the catalyst is frustrating. The life time of the catalysts vary from seconds to years. For example, chemical cracking catalysts deactivate in seconds but the catalyst for ammonia synthesis may
function over 5 years. Although it is inevitable, we could postpone its deactivation by better catalyst design and a well-management system.
2.3.1 Deactivation mechanism
The presence of contaminants in the reaction atmosphere, blockage or fouling of the catalyst active sites, or coke all lead to the deactivation of the catalyst [1]. The causes of catalyst deactivation are thermal, mechanical and chemical. Table 2.2 summarized the mechanisms of solid catalyst deactivation.
Table 2.2 Mechanism of catalyst deactivation [1]
Mechanism
Type
Phenomenon
poisoning
chemical
chemisorption on active sites
blocking active sites
fouling
mechanical physical desorption on surface and pores
thermal degradation
thermal
and active phase-support reaction
loss of specific surface area
vapour formation
chemical
volatile compounds formation
vapour-solid and
chemical
inert phase by reaction among gas–phase,
solid-solid reactions
support or promoter
attrition/crushing
mechanical
loss of internal surface area
loss of catalytic material
2.3.2 Poisoning
Poisoning [59], a strong chemisorption of impurities or even reactants or products, blocks the adsorption sites and changes the electronic and geometric structure of the catalyst surface [60]. Based on their chemical structure, catalyst poisons classified as [1] :
• Groups VA and VIA : N, P, As, Sb, O, S, Se, Te. • Group VIIA : F, Cl, Br, I.
• Toxic heavy metals and ions : As, Pb, Hg, Bi, Sn, Zn, Cd, Cu, Fe.
•Molecules that adsorb with multiple bonds : CO, NO, HCN, benzene, acetylene, unsaturated hydrocarbons.
Table 2.3 presents examples of common poisons for some catalytic reactions over specific catalysts.
Table 2.3 Common poisons for specific catalytic reactions over selected catalysts [1]
Catalyst Reaction Poisons
SiO2-Al2O3, zeolites Cracking Organic bases, hydrocarbons heavy metals
Ni, Pt, Pa De-/hydrogenation Compounds of S, P, As, Zn, Hg, SMR halides, Pb, NH3, C2H2 Fe, Ru Ammonia synthesis O2, H2O, CO, S, C2H2, H2O Co, Fe FT synthesis H2S, COS, As, NH3, metal carbonyls Noble metals on zeolites Hydrocracking NH3, S, Se, Te, P
Ag C2H4 oxidation C2H2
Vanadium oxide Oxidation/selective As/Fe, K, Na catalytic reduction from fly ash Pt, Pa CO xidation Pb, P, Zn, SO2, Fe
Co and Mo sulfides Hydrotreating of residuum Asphaltenes, N compounds, Ni, V
2.3.3 Fouling, coking and carbon deposition
Different from poisoning, fouling is the physical (mechanical) deposition of species from the fluid phase on the catalyst surface and blocks active sites or pores [1]. For example, the deposition of coke and carbon in porous catalysts [61]. Regarding the origin of the carbon and coke, their definition differs : carbon forms from CO disproportionation while coke is from by decomposition and/or condensation of hydrocarbons [62].
The chemical structures of coke or carbon vary with reaction type, catalyst type, and reaction conditions [1]. Menon [62] classified the catalytic reactions accompanied by carbon or coke formation to coke-sensitive and coke-insensitive reactions. In the former reactions, such as catalytic cracking, catalysts lose activity as the deposited coke is unreactive. In the latter reaction, such as FT reaction and catalytic reforming, coke is reactive to a gasifying agent (H2, etc) The structure and location of the coke and also its formation mechanism affect catalyst activity. Carbon and Coke formed on supported metal catalysts may
1) block reactants to reach active sites by monolayer chemisorption or multilayer physi-sorption ;
(2) completely encapsulate thus deactivate metals ;
(3) plug micro- and meso- pores and decrease effective surface area.
(4) in extreme cases, strong carbon filaments build up in pores and break down catalysts and clog reactor voids [1].
regenera-tion of these systems are feasible [12].
2.3.4 Thermal degradation and sintering
Thermal deactivation refers to the loss of catalytic surface area due to crystalline growth, loss of support porosity and conversion of catalytic phases to non-catalytic phases [1]. The first two processes are sintering which typically occurs at reaction temperatures higher than 500◦C ; the third refers to solid–solid reaction. The rate of sintering depends on temperature, atmosphere, metal type, metal dispersion promoters, support surface area, texture, and the porosity [63]. Depending on the type of the reaction, the activity of the catalyst differs with increasing metal crystallite size [64]. The principal mechanisms of metal crystallite growth are (1) crystallite migration ; (2) atomic migration and (3) vapour transport [1]. In some cases, it is not single mechanism and could be a couple of several or all mechanisms. Thermal degradation is generally slow and irreversible. Therefore regeneration of a sintered catalyst is not feasible [12].
2.3.5 Gas-vapour/solid and solid state reactions Other chemical routes are [64] :
(1) gas-vapour phase reacts with the catalyst surface to produce inactive bulk and surface phases and volatile compounds and chemical-assisted sintering (due to adsorbate interactions, different from thermal sintering). For example, Fe and Ru are active phases in ammonia synthesis while their oxides are inerts.
(2) catalytic solid-support or solid-promoter reactions, however, it is difficult to keep track of its degree as diffusion and solid-state reaction are affected by surface reactions. For example, The presence of gas-phase oxygen or steam may enhance the diffusion rate of Al2O3 to the surface to form an aluminate.
(3) solid-state transformations of the catalytic phases during reaction.
2.3.6 Mechanical failure of catalysts
Mechanical failure includes : (1) crushing in fixed bed ; (2) attrition in slurry or fluidized bed reactors and (3) erosion in any reactor [64]. Attrition leads to a reduction of particle size, rounding or smoothing of particles and washcoat loss. A rise in pressure drop indicates fouling and the plugging of the lines by accumulation of the worn catalysts.
2.3.7 Catalyst deactivation and regeneration in syngas production Catalyst deactivation in syngas production
The most probable mechanism for the deactivation of catalysts in laboratorial scale syngas production is coke formation. There are three types of coke [33] whisker-like, encapsulating film, and pyrolytic carbon. Table 2.4 summarizes carbon species formed in syngas routes, especially in SMR with Ni catalysts [1, 12].
Table 2.4 Routes to carbon
Carbon type Reaction Phenomena Critical parameters
Whisker carbon Eq. 1.12, 1.13, Break-up catalyst > 450◦C, low H2O/C ratio 1.15, 2.16 Pressure drop rise olefins or aromatic feed Encapsulated films Eq. 2.17 Blocking Ni surface < 500◦C, low H2O/C ratio
progressive deactivation low H2/CnHm, aromatic feed
Pyrolytic coke Eq. 2.18 Encapsulation of catalyst > 600desposits on tube wall high pressure, acidic catalyst◦C, long residence time Reactions relate to carbon formation (besides Eq 1.12, 1.13 and 1.15) [12] :
CnHm → nC + 0.5mH2 (2.16)
CnHm → olef ins → coke (2.17)
CnHm →(CH2)n→ encapsulated coke (2.18)
Whisker carbon typically grows as carbon fiber (nanotube) from the dissociation of hydro-carbons or CO on the catalyst surface [33]. Its strength is high enough to destroy the pores of catalyst particle. Damaged catalyst and accumulated carbon lead to maldistribution of the feed and hot spots or hot tubes, further partially or totally clog the reactor [33]. Low tempe-rature encapsulated coke blocks the catalyst surface by a film of polymerized carbonaceous compounds. Thermal pyrolysis in steam crackers leads to pyrolytic coke which encapsulates the catalyst or deposits on the tube wall.
The type and crystallite size of metal, promoter and support all affect the coke formation rate. For example, supported Co, Fe, and Ni catalysts actively produce filamentous carbon above 350◦C ; the order of coke formation rate for these non-noble metals is Fe > Co > Ni [65]. Noble metals like Pt, Ru, and Rh, with equal or much higher activity than Ni, generate little coke. According to Claridge et al [5], the relative rate of carbon deposition is in the order Ni > Pd > Rh > Ru > Pt, Ir. The rate of carbon formation on precious metals
![Figure 2.1 A typical in-situ spray pyrolysis system [2] : (1) Compressed air supply ; (2) Syringe pump and controller ; (3) Spray nozzle ; (4) Substrate holder ; (5) Temperature controller ; (6) Step motor and controller.](https://thumb-eu.123doks.com/thumbv2/123doknet/2337881.33238/33.918.273.664.536.874/pyrolysis-compressed-syringe-controller-substrate-temperature-controller-controller.webp)
![Figure 2.3 Effect of reaction conditions on CPOX over Ru catalyst [4] : (a) Temperature ; (b) Pressure ; (c) CH4/O2 ratio ; (d) Gas hourly space velocity](https://thumb-eu.123doks.com/thumbv2/123doknet/2337881.33238/35.918.150.798.121.902/figure-effect-reaction-conditions-catalyst-temperature-pressure-velocity.webp)
![Table 2.3 Common poisons for specific catalytic reactions over selected catalysts [1]](https://thumb-eu.123doks.com/thumbv2/123doknet/2337881.33238/38.918.112.810.153.442/table-common-poisons-specific-catalytic-reactions-selected-catalysts.webp)