Publisher’s version / Version de l'éditeur:
Vous avez des questions? Nous pouvons vous aider. Pour communiquer directement avec un auteur, consultez la
première page de la revue dans laquelle son article a été publié afin de trouver ses coordonnées. Si vous n’arrivez pas à les repérer, communiquez avec nous à [email protected].
Questions? Contact the NRC Publications Archive team at
[email protected]. If you wish to email the authors directly, please see the first page of the publication for their contact information.
https://publications-cnrc.canada.ca/fra/droits
L’accès à ce site Web et l’utilisation de son contenu sont assujettis aux conditions présentées dans le site LISEZ CES CONDITIONS ATTENTIVEMENT AVANT D’UTILISER CE SITE WEB.
Proceedings of the 25th International Conference on Port and Ocean Engineering under Arctic Conditions, June 9-13, 2019, Delft, The Netherlands, 2019-06
READ THESE TERMS AND CONDITIONS CAREFULLY BEFORE USING THIS WEBSITE. https://nrc-publications.canada.ca/eng/copyright
NRC Publications Archive Record / Notice des Archives des publications du CNRC :
https://nrc-publications.canada.ca/eng/view/object/?id=4f561fa6-5398-4ef7-a36a-b20b8efdd674 https://publications-cnrc.canada.ca/fra/voir/objet/?id=4f561fa6-5398-4ef7-a36a-b20b8efdd674
NRC Publications Archive
Archives des publications du CNRC
This publication could be one of several versions: author’s original, accepted manuscript or the publisher’s version. / La version de cette publication peut être l’une des suivantes : la version prépublication de l’auteur, la version acceptée du manuscrit ou la version de l’éditeur.
Access and use of this website and the material on it are subject to the Terms and Conditions set forth at Modeling of a full scale DP in ice scenario using an advanced ice dynamics model
Proceedings of the 25th International Conference on
Port and Ocean Engineering under Arctic Conditions
June 9-13, 2019, Delft, The Netherlands
Modeling of a Full Scale DP in Ice Scenario using an Advanced
Ice Dynamics Model
Shameem Islam1, David Watson2, Jeffrey Brown1, Mohamed Sayed2
1 Ocean Coastal and River Engineering, National Research Council, St. John’s, NL Canada
2 Ocean Coastal and River Engineering, National Research Council, Ottawa, ON Canada
ABSTRACT
This paper presents a comparison between a recently completed physical model test program, a full scale expedition and predictions using an NRC-OCRE Ice Dynamics Model (IDM), for a representative scenario of dynamic positioning of an ice management vessel. This work aims at enhancing the confidence in the numerical results, and to make it possible to extrapolate ice basin tests and field observations to a wider range of conditions.
Full scale data were obtained during field trials of a dynamically positioned multi-purpose vessel, Magne Viking (MV). The collected data include thrust values, ship motion and observations of ice conditions. In parallel to the field measurements, physical model tests examined ice-vessel interactions and ship performance. In this paper, a representative trial scenario was selected from the full scale expedition for modelling in NRC-OCRE’s ice basin as well as for numerical modeling using the IDM code for predicting the ice forces on the hull. A comparison of the thruster forces and vessel movements derived from the three studies is presented in this paper. This work indicates that the numerical simulations can predict the full-scale stationkeeping scenarios with reasonable accuracy. Thus, numerical simulations may be used to examine many practical scenarios which cannot be obtained in the basin and in the field. KEY WORDS: Dynamic positioning; Ice-ship interactions; Ice dynamics; Managed ice; ice forces; Full scale trial; Ice basin testing; Numerical modelling.
INTRODUCTION
Drill-ships, offshore supply vessels, floating production, storage and off-loading (FPSO) units, and icebreakers are required to operate under challenging sea ice drift conditions in the Arctic and sub-arctic regions. There is a potential for increase in activities in deep water arctic and sub-arctic regions, which is expected to result in demand for customized dynamic positioning (DP) capabilities for these vessels.
Understanding and modeling the dynamic interactions between various ice parameters and the stationkeeping vessel are key for effective and reliable operations. There is a knowledge gap in the understanding of the magnitude and nature of ice forces (event frequency, limiting events, failure modes etc.) encountered by the DP controlled drilling and production systems operating in the managed ice fields. Full scale trials are the most reliable approach of gathering
information on ice forces, although these are often very expensive and challenging due to poor control over the ice conditions and highly complex instrumentation requirements. Physical model testing for DP controlled structures in simulated ice fields can be a more feasible and economical option to obtain better understanding of the loads on the structure in the challenging environments; however, this also has measurements and scaling uncertainties. A high-fidelity ice dynamics model with the capability to accurately and reliably predict the ice-vessel interaction phenomena in full-scale can be valuable for reducing the gap.
Experience with stationkeeping in ice remains too limited to provide a basis for planning of stationkeeping operations. Past operations in the southern Beaufort Sea during the 1970s and 1980s gave some information on ice forces and the effectiveness of ice management. In spite of renewed interest in stationkeeping in ice over the past decade, only a few new field observations have become available. They include the Fram Strait ice management trials (Maddock et al., 2011), the Arctic Coring Expedition (ACEX) (Keinonen et al., 2006; Pilkington et al., 2006; and Gurtner et al., 2012), and NE Greenland trials (Scibilia et al., 2014). The reported information from those projects gives only sporadic insights into ice management and stationkeeping operations. There are other routinely performed stationkeeping (primarily with mooring) with ice management operations in other arctic areas; however, no information is available in the public domain.
From early developments in the 1970s until now, ice basin tests have served as the main source of detailed information on vessel stationkeeping in ice for design purposes. The early studies, for example, dealt with ice action on moored vessels. More recent research projects examined various aspects of stationkeeping in ice for DP vessels as well. One such main project, DYPIC, was carried out at the HSVA ice basin. That project addressed several aspects of ice interaction with drillships and issues of concern to stationkeeping (see for example Jochmann and Evers, 2014; and Kerkeni et al., 2014). Other stationkeeping in ice tests were also carried out at Aker’s ice model basin on both moored and DP systems (Jenssen et al., 2012).
As numerical models have developed, they have become increasingly utilized in examining issues of stationkeeping in ice. A number of efforts relied on various implementations of the Discrete Element approach (e.g. Metrikin and Løset, 2013; and Daley et al., 2014). A different approach developed at the NRC is based on solving ice dynamics equations to simulate various ice interaction scenarios with drillships (e.g., Sayed et al., 2016).
The Marine Institute’s Centre for Marine Simulation (CMS), National Research Council’s Ocean Coastal and River Engineering Research Centre (NRC-OCRE), Petroleum Research Newfoundland and Labrador (PRNL) ), Atlantic Canada Opportunities Agency (ACOA), InnovateNL (previously known as Research Development Corporation), and its Kongsberg Digital Simulation (KDS) Ltd., have been pursuing a five-year project aimed at improving the safety and efficiency of oil and gas operations in ice environment with emphasis on developing technologies to assist operators in determining ice loads on floating structures used for exploration, drilling and production. Under this project, a sea trial of the Ice-1A classed anchor handling tug supply (AHTS) vessel, Magne Viking (MV), in managed ice was conducted in March, 2017 (Brown and Garvin, 2017). This trial program led to a physical testing program with the same vessel at a scale of 1:19 with the aim to validate numerical ice force models using both model-scale and full-scale measurements (Islam et al. 2018).
Objectives and Scope
The primary objectives of the work presented here are:
Compare NRC-OCRE’s Ice Dynamic Model (IDM) predictions with the field trial and model scale basin measurements for a representative DP vessel in managed ice operation scenario; and
Enhance the confidence and quantify the accuracy of the NRC-OCRE’s Ice Dynamic Model (IDM) code for better predictions of DP vessel-managed ice interactions. The general objectives of the work are to:
Augment ice basin test programs with numerical simulations, and to extrapolate ice basin data to wider range of conditions; and
Improve understanding of the effects of various ice parameters, ice-vessel interaction scenarios/ events and ice failure modes on the vessel’s DP operational performance. The scope of the work includes analysis of a field measurement case and the corresponding model scale measurements for a representative DP vessel and managed ice interactions. Next is to numerically model the scenario using NRC-OCRE’s in-house IDM code and compare the predictions with the corresponding model-scale measurements.
MAGNE VIKING TRIAL Magne Viking Trial Overview
The Centre for Marine Simulation (CMS) had engaged Viking Ice Consultancy (and by proxy, Viking Supply and the NRC-OCRE) to perform full scale trials with the Magne Viking, over the course of 6 days, between 20th and 26th of March of 2017 (Brown and Garvin, 2017). The
vessel departed from and returned to Luleå, Sweden. Two distinct data sets were collected, yielding insight to the performance of the vessel in two operations: Ice Management and DP in Ice.
The trials program generated nearly 50 hours of mostly successful DP in Ice operations. Observed floe sizes overlapped with previously executed model scale tests (Islam et al., 2018) for 3 to 4 days of the 6 day trial, observed thicknesses overlapped with the model tests for 2 out of 6 days, and floe sizes and drift speeds overlap with the model tests for 5 out of 6 days. All ship and DP performance parameters, met-ocean and ice conditions and ice loads on ship hull were recorded. Multiple camera systems (over-side and far-field, 360° around the ship) recorded the incoming ice conditions and vessel-ice interactions.
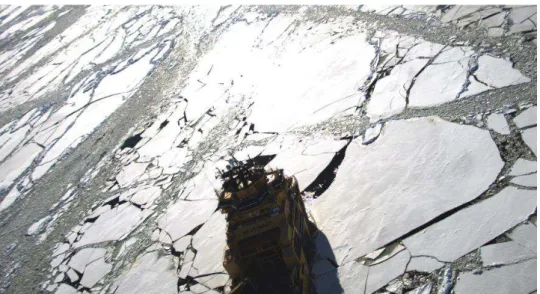
It was observed that the ice failure modes in the trials were similar to observations from previous basin work; however ice fracture/cracking appeared to be more dominant in full-scale. Overall, the trial program provides valuable information and it is expected to provide the important validation data for physical model testing and numerical ice modelling efforts on various performance aspects of DP or IM vessels. Figure 1 presents an overhead image taken from one of the trial cases (Brown and Garvin, 2017).
Magne Viking Trial Case
The trial condition under consideration took place on the 21st of March, 2017. The ice
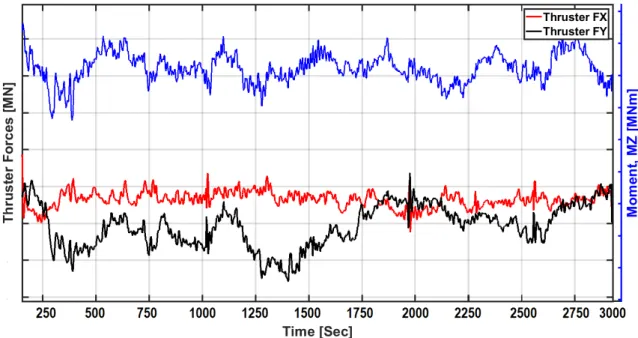
thicknesses was in the range of 0.3 m – 0.4 m with variable snow, and almost no ridges. The day’s ice management operations sought to replicate NRC-OCRE’s ice basin work (Islam et al. 2018) by performing three sets of ice management & DP tests in the same ice. The managed ice field characteristics for the selected scenario is summarized in Table 1. Figure 2 presents preliminary qualitative as-recorded data of the thruster forces/moment of the selected trial case. The forces along the surge and sway directions show a cyclic pattern. The yawing moment showed a similar trend. Further analysis of the data is beyond the scope of this paper.
Figure 2: Thruster forces/moment for the selected MV trial case (preliminary) MAGNE VIKING BASIN TESTING
Magne Viking Basin Testing Overview
A comprehensive series of model scale measurements with the fully DP controlled MV hull at 1:19 scale was conducted in various managed ice conditions in the ice basin facility of the NRC-OCRE in early 2018 (Islam et al. 2018). A total of 160 test runs were carried out in 7 ice sheets to evaluate the ice forces and motion responses of the hull in various managed ice conditions. The model was equipped with fully functional dynamic positioning system with 2 tunnel thrusters and twin-screw systems, which, at full scale, generate approximately 3 MN of propulsion. Vessel’s 6-DOF motion/trajectory was recorded by using optical tracking system. Additional measurements were made on the linear accelerations and rotational rate of the model. Multiple camera systems were also used to record detailed ice movements in various global and local locations. Each of the tests was run for at least 6 hull lengths for each of the drift speeds in the basin.
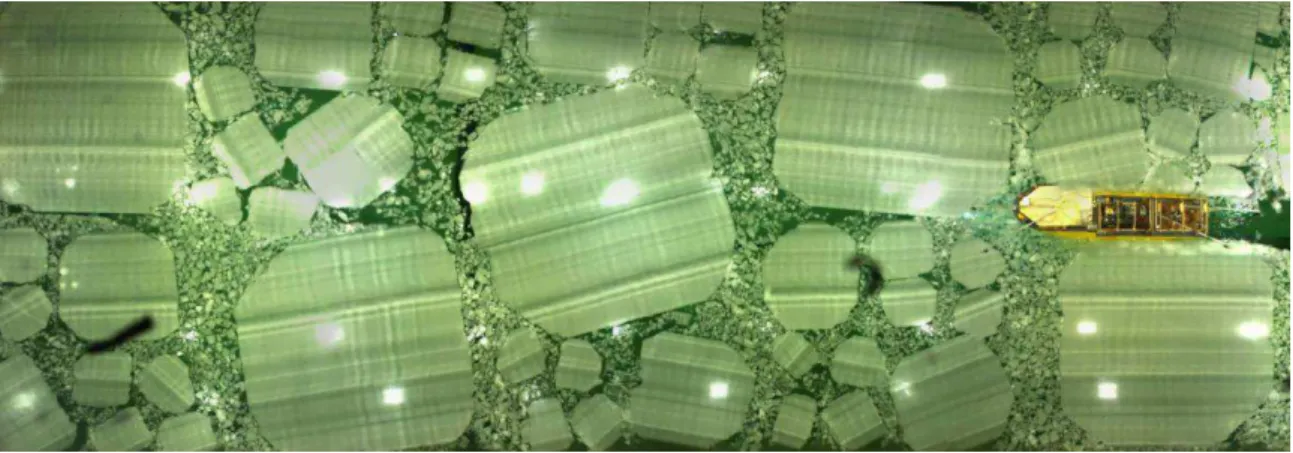
Multiple managed ice configurations were prepared and tested in these model ice sheets to evaluate the effect of ice concentration, floe size, floe thickness, ice drift speed and direction on the vessel loads and motion responses. Two initial conditions were studied, namely, forward ice tests, and oblique ice tests. For each of the tests, the DP system of the vessel was set to track and maintain pre-determined position and heading set points relative to the main carriage in the ice tank. Further details of the experimental program can be found in Islam et al., 2018. See Figure 3 for a representative view of a test case, a forward (straight-ahead) ice test run.
Managed Ice Field Modelling
The representative field floe distributions were extracted from analysis of video data collected during the MV sea trial (Brown and Garvin, 2017). A number of overhead images covering the entire trial time for a selected case is first stitched together to roughly obtain the floe field. The ice floe field is then categorized in terms of floe size. The floe distribution is simplified and specified as consisting of extra large (floe size > 125 m), large (floe size between 75 m and 125 m), medium (floe size between 25 m and 75 m), small (floe size approximately 25 m) and brash ice. A calculation of the area covered by each floe size type revealed approximately 30%, 15%, 20% and 35% of floe coverage with large, medium and small floes and brash ice, respectively, see Figure 3.
Figure 3. View of the ice cover and the MV vessel in the ice basin for the comparison scenario
The NRC-OCRE developed a procedure to produce managed ice with the representative field distribution in the ice basin. The floe cutting pattern ensured that the percentage coverage of various sized floes are similar to those found in the field. Besides the ice floes, the ice field was modelled with approximately 35% of brash ice (characteristic length <2.0m, full scale). Note, the side and end boundary wall effect was minimized by maintaining a 0.5 m wide brash ice channel adjacent to the walls. A similar floe distribution was used in the numerical simulation, see Figure 4.
Magne Viking Basin Testing Case
A basin test case was selected as a representative for conditions used in the trial program, see Table 1 for a summary of the ice field characteristics. Figure 3 shows a view of the ice cover and the vessel for that test case.
The measured thrust force components along the surge and sway directions as well as the yawing moment are plotted versus time in Figure 6. The thrust force along the surge direction shows a cyclic pattern with the highest peak reaching 1.0 MN. The force in the sway direction showed less cyclic, with the highest peak exceeded 0.8 MN. The high value of the sway force was due to the tendency of the vessel moving in-between the floes, hence inducing high offsets in yaw and sway. In the figure, the measured parameters show the combined time series of the two tests (test with a repeat). Note that only thrust forces were measured; ice forces were not measured directly.
The offsets of the vessel from the target position along the longitudinal and transverse directions of the ice basin (labelled as surge and sway directions) are shown in Figure 9. The measured yaw offset had a peak value exceeding 15°. The offsets along the surge (longitudinal) and sway (transverse) directions are plotted against each other, in the familiar manner, as shown in Figure 10. The peak offset approached 6 m.
ICE DYNAMICS MODELLING
NRC-OCRE’s Ice Dynamics Model (IDM)
The governing equations of the ice model account for the conservation of mass and linear momentum. Ice failure is represented by an extended von Mises criterion combined with volumetric strain softening. A hybrid Eulerian-Lagrangian approach is used to solve the governing equations over a Cartesian Eulerian grid. A semi-implicit center finite difference method is used. Advection of the ice is carried out using a Particle-In-Cell (PIC) approach, whereby an ensemble of particles represent the ice cover. Each particle is assigned attributes representing ice cover properties and conditions. The particles are advected in a Lagrangian manner. At each time step, ice concentration, thickness and other attributes are mapped from the particles to the Eulerian grid. The equations of the momentum and failure criterion are solved over the grid to determine the strain rates, stresses, accelerations and velocity fields. Those results are then mapped to the particles. Next, the equation of mass conservation is solved over each particle to update the thickness and concentration, and the particles are advected to their new positions. Boundary conditions are applied at the nodes of the grid and can account for any of the following: fixed (zero velocity), full-slip, specified friction coefficient. Details of the ice model were reported earlier by Sayed and Kubat (2011) and Sayed and Barker (2011). In the present simulations, a depth-averaged version (2.5D) of the model is used since the horizontal dimensions are large compared to ice thickness. In this implementation, velocities and stresses are averaged over ice thickness. Variations of the ice thickness are accounted for.
The vessel is modelled as a three degrees-of-freedom rigid body, allowing for surge, sway and yaw. Forces due to ice action and thrust are considered in solving the linear and angular momentum equations of the vessel. Water drag forces are neglected in the present simulations since they would be relatively small in comparison to ice forces. Thrust forces and moments are calculated using constant gain coefficients (DGain and PGain). The thrust forces along surge
and sway directions are u
Gain Gain
DP P x D
F (1)
Where δx is the offset. The PGain and DGain coefficients would be assigned different values for
the surge and sway motion. Similarly, the moment exerted by the thrusters is expressed as dt d Gain Gain DP P D M (2)
Where θ is the yaw offset. Note that this thrust model avoids the complex issues of thrust allocation, and differs from that used in the ice basin tests (Islam et al., 2018). At each time step, the solution gives the distributions of stresses, strain rates, thickness and velocities over the ice cover. The particles are then advected to give the updated position of the ice cover. The stresses along the boundary of vessel are integrated to give ice force components along the surge and sway directions, as well as the moment along the yaw direction. Those forces and moments are then used to update the velocities and position of the vessel. More details of the model of the vessel were presented by Sayed et al. (2014).
Simulation Setup and Conditions
Figure 4 shows the computational grid, which covers an area of 2 km by 0.6 km. The grid cell size is 2 m. The computational particles (not shown in the figure) are initially placed at a spacing of 0.4 m. The length of the grid is nearly double the length of the ice basin length. The ice cover is modelled as stationary and the vessel moves towards the West, a setup similar
to the basin testing program and most of the full-scale trials. A summary of the ice field characteristics used in the IDM simulation is provided in Table 1. The floe concentration was 65%, which appears to match to that observed from the field trials and basin tests data. Brash ice was placed in the voids between the floes and was assigned a uniform thickness of 0.2 m.
Table 1. Managed Ice Field Characteristics
Ice Field Setup Trial Case Basin Case IDM Case
Ice Concentration 9/10th 9/10th 9/10th +
Floe Concentration ~50% ~65% ~65% Ice Thickness 0.3 m-0.4 m, with variable snow ~0.4 m 0.4 m Ice Drift Speed 0.4 Knots 0.5 Knots 0.5 Knots
Drift Angle ~0° ~0° ~0°
Ice Strength ~350 kPa ~600 kPa 500 kPa
Floe Distribution 100m, 50m, 25m, small ice, brash ice, open water 100m, 50m, 25m, small ice, brash ice, open water 100m, 50m, 25m, brash ice
Figure 4. View of the computational grid, the initial ice cover and the MV vessel The boundaries of the grid were treated using a full-slip condition; i.e. the velocity component perpendicular (and outward from the grid) is set to zero, while other velocity components were not subjected to any restrictions. Note that single nodes at the corners were assigned a fixed, or zero-velocity conditions. At the vessel-ice interface, a Coulomb friction condition was used, with a coefficient of friction of 0.1.
The MV hull parameters at full-scale was used for the modelling. The added mass coefficients were assumed to be 12% and 100% along the surge and sway directions. The moment of inertia (around the yaw axis) was taken as 7.11 x 10⁹ kg m2, with a coefficient of added moment of
inertia of 20%. For thrust force calculations, the gain values used are shown in Table 2, which were the same for the full-scale as well as for the model-scale vessel.
Table 2. Gain Values for the Thrusters Direction Pgain Dgain
Surge 0.09 MN/m 0.15 MN s/m Sway 0.17 MN/m 0.36 MN s/m Yaw 0.785 GN m/rad 3.05 GN m s/rad
Similar to the model testing setup, a set point was assigned a constant velocity of 0.257 m/s (0.5 knots) full-scale. The distance between the center of the vessel and the set-point gives the linear offset. The yaw offset was calculated as the angle between the heading of the vessel and
the West direction (clockwise offsets are considered positive). The simulation started with zero offsets. As the set point moved, the resulting offset increases the thrust forces, which in turn moves the vessel towards the position of the set-point.
RESULTS AND DISCUSSION
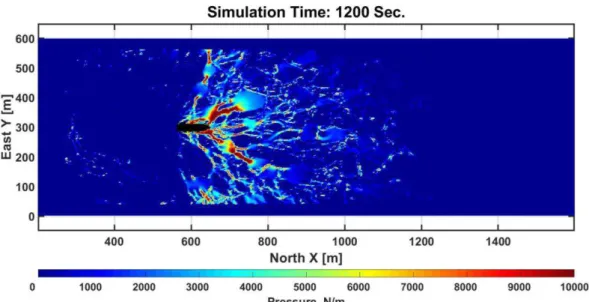
The predicted pressure (mean normal stress) distributions and positions of the vessel are shown at a time interval in Figure 5. Those pressures are presented as forces per unit length of the ice cover (N/m). The distributions show that high pressures occur around the bow as may be expected. The packing of the floes evidently cause the distributions to show some irregularity or tree branch-like patterns as was reported in previous studies (e.g. Sayed et al., 2016). The pressures also appear to increase at the contacts between floes. Some relatively high pressures appear near the boundaries of the grid which represent the walls of the ice tank. That suggests that confinement due to the side walls can influence ice deformation.
Figure 5. Pressure distribution in the ice cover after 1200 s from the start of the simulation. Forces and Moment
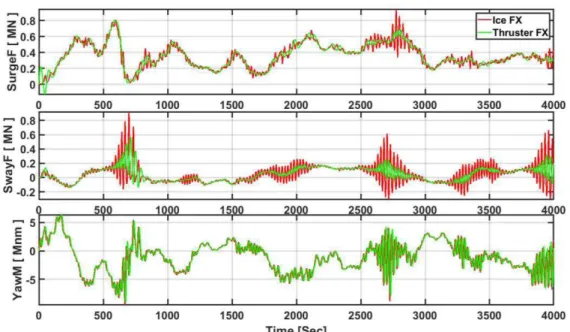
The predicted values of the thruster forces and yawing moment along with the corresponding basin measured values on the vessel are plotted in Figure 6. These show that a number of loading events took place for both cases. The nature of ice-vessel interaction events in the two cases are expected to be different due to differences in the floe locations and orientations and the boundary conditions. Despite, the measured peak surge thrust force was reasonably close to that of the prediction. The peak sway force and the peak moment are higher than the corresponding predicted peak values. The addition of the brash channels contributed to the lack of floe packing in numerical model predictions while the basin wall confinement increased it in the basin testing. There was also an issue of floe packing increasing towards the end of basin testing (end wall effect). This explains the higher moment and sway force of the basin measurements near the end of the time series.
The resulting values of the thrust and ice forces on the vessel are plotted in Figure 7. These show that the peak thrust forces are slightly lower than the peak ice forces. That is expected since the relatively small period fluctuations would not cause immediate response from the vessel. Thrust forces, which depend on the offset and velocity of the vessel, would therefore only respond to longer period ice action.
Figure 6. Thruster forces along the surge and sway directions versus time for the ice basin test case and the corresponding simulation case
Figure 7. Thrust and ice forces along the surge and sway directions from the simulation Vessel Movements
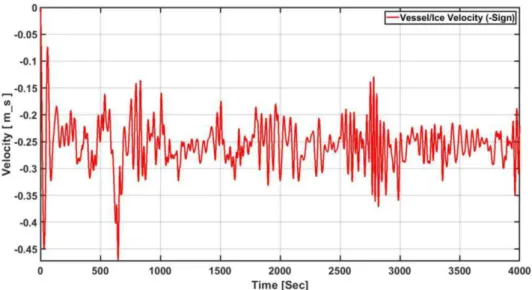
The resulting velocity of the vessel, as predicted by the IDM simulation, is plotted versus time in Figure 8. Evidently the velocity fluctuated around the 0.257 m/s (0.5 knots) steady values of the set-point. Offsets of the vessel are plotted versus time for the test and the prediction case is presented in Figure 9. The peak surge offsets is mostly less than 8 m, which is close to measurements of the ice basin test. The sway offsets stayed relatively low throughout the simulation run, whereas the measured sway showed higher fluctuations, see also Figure 10. Although the vessel primarily maintained the required heading towards the West, significant yaw took place during the basin test, whereas very small yaw was predicted in the simulation. The predicted peak yaw was 1° (anti-clockwise), which is significantly less than the peak value observed during the ice basin tests (exceeding 15°). This is primarily attributed to the differences in the boundary conditions of the two cases. The interactions between the side walls and the end wall with the ice and ship may be more severe during the measurements as compared to the simulations.
Figure 8. Velocity of the vessel versus time from the numerical simulation.
Figure 9. Surge and sway offsets versus time for the ice basin and the numerical simulation
Extreme Value Analysis
The initial ice cover, which is used in the simulations, matched the overall properties of the ice cover that was used in the ice basin test as well as the field trial case. Local details of the ice cover for the three studies, however, could not be matched (e.g. individual floe geometries, positions and orientations). Therefore details of resulting time records of thrust forces for the predictions are not expected to follow those obtained from the ice basin tests or the field trial. In order to compare the resulting forces statistically, peaks from loading events (or force cycles) were extracted for comparison.
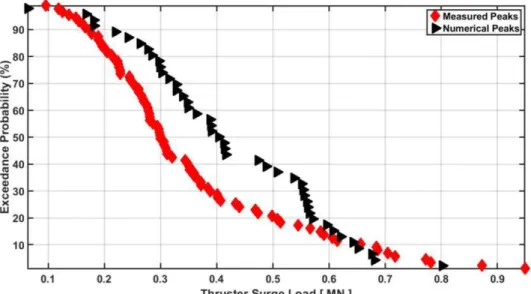
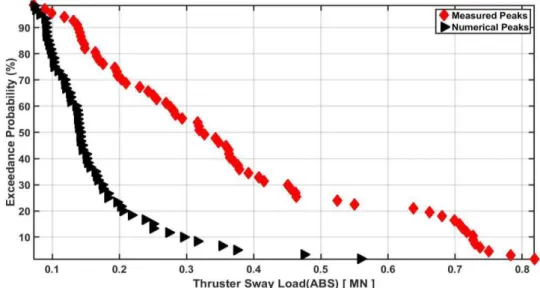
Probability of exceedance plots for thruster forces in surge, sway and yaw due to the thrusters are plotted for both the ice basin test and the numerical simulation in Figure 11, Figure 12, and in Figure 13, respectively. The measured peak thruster surge force values are in good qualitative agreement with that of the predicted ones. The sway force and the moment due to the thrusters from the basin tests, however, are higher than that from the numerical simulations. Quantitatively, the difference between the measured and numerically computed thruster forces at the 5% level of exceedance is 14% for surge, 40% for sway and 50% for yaw. It appears that the effects of wall confinement are more pronounced in the basin test case. A single event with a noticeable wall confinement that was recorded approximately at 3000 sec (full scale) at the basin measurements, may have significantly affected this comparison.
For the sway direction, the basin measurements gave somewhat larger thrust forces than the numerical simulation. Besides the differences in floe location and orientation, the basin ice cover floes were excessively packed between the vessel and the basin side walls, both of which were not as prominent in the numerical models and field trial case. The difference in packing likely caused the increase in the sway-direction thrust forces and yawing moment in the basin testing over those predicted in the numerical simulation. The algorithm used for control of the thrust forces may have also contributed to the difference in the predicted and field measured forces. The numerical simulations employed a simple constant gain formulation. In contrast, the ice basin test utilized a more involved DP algorithm that included thrust allocation priorities, which may also be true for the field vessel. In addition, a depth-averaged version of the numerical model was used for the prediction, which may have not captured the full 3D effect of ice-ship interactions and resulted in under-predictions of thruster forces and moment.
Figure 11. Probability of exceedance plot of the peak surge thrust from the ice basin test and the numerical simulation
Figure 12. Probability of exceedance plot of the peak sway thrust from the ice basin test and the numerical simulation
Figure 13. Probability of exceedance plot of the peak thruster yaw moment from the ice basin test and the numerical simulation
CONCLUSIONS
This paper has described comparisons between numerical simulations based on an ice dynamics model, an ice basin test and, to some extent, a field trial case of the Dynamic positioning (DP) of a vessel in managed ice. The case consisted of a vessel moving through a field of ice floes and brash ice. The set-up was intended to represent stationkeeping of a thruster-controlled vessel under the action of moving ice. The comparison has focused on situations with vessel heading primarily against oncoming ice.
The results show that the basin-measured thrust forces along the surge direction were close to those predicted by the numerical simulations. The ice basin measured peak thruster surge force values are in good qualitative agreement with that of the predicted ones. The sway force and the moment due to the thrusters from the basin tests, however, are higher than that from the numerical simulations. Quantitatively, the difference between the basin measured and numerically computed thruster forces at the 5% level of exceedance is 14% for surge, 40% for sway and 50% for yaw. It appears that the effects of wall confinement are more pronounced in the basin test case. A single event with a noticeable wall confinement may have significantly
affected this comparison.
The numerical simulations also gave estimates of ice forces and moments on the vessel. Ice forces were close to thrust forces. The ice forces and moments were not available from basin and the full scale measurements.
The basin measurements and numerical predictions for the selected case show promising comparison, considering the differences in the two setups. Future work will include numerical and ice basin tests which employ initial ice cover configurations and boundary conditions that more closely represent field conditions. Extensive comparison between the field trial data and numerical predictions is required to build confidence in the tool for predicting full scale performance of DP vessels in managed ice conditions.
ACKNOWLEDGEMENTS
The authors thank the Centre for Marine Simulation of the Fisheries and Marine Institute (CMS-MI) of Memorial University of Newfoundland, Petroleum Research Newfoundland and Labrador (PRNL), Atlantic Canada Opportunities Agency (ACOA), InnovateNL (previously known as Research Development Corporation, RDC), and Kongsberg Digital Simulation (KDS) Ltd. for their financial support. Thanks are extended to all of the NRC-OCRE technical services staff for their work. The authors would also like to acknowledge all affiliated companies for allowing the NRC-OCRE to publish this paper.
REFERENCES
Brown, J., Garvin, M., 2017. DP in Ice Test, Magne Viking. NRC-RC Technical Report OCRE-TR-2017-013, NRC-OCRE-RC, St. John’s, NL, Canada.
Gash, R. and Millan, J. 2012. Managed Ice Loads on a Dynamically Positioned Vessel. In Proc. of the Arctic Technology Conference.
Gurtner, A., Baardson, B.H.H., Kaasa, G-O, and Lundin, E., 2012. Aspects of Importance Related to Arctic DP Operations. Proc of the ASME 31st Int Conf on Ocean, Offshore and Arctic Eng (OMAE), Rio de Janiro, Brazil, July 1-6, OMAE2012-84226.
Islam, S., Wang, J., Mills, J., Sayeed, T., Gash, B., Lau, M., Millan, D. and Millan, J., 2016. DP in Ice Environment – Improving Safety and Efficiency of Arctic Operations. In Proc. of the Arctic Technology Conference, St. John’s, NL, October 24-26, 21p.
Islam, S., Wang, J., Brown, J., Lau, M., Gash, B., Millan, D. and Millan, J., 2018. Physical Model Testing for Supporting Ice Force Model Development of DP Vessels in Managed Ice. In Proc. of the Arctic Technology Conference, Houston, TX, November 7-9, 21p.
Jenssen, N. A., Hals, T., Jochmann, P., Haase, A., dal Santo, X., Kerkeni, S., Doucy, O., Gürtner, A., Støle Hetschel, S., Moslet, P. O., Metrikin, I., and Løset, S. 2012. DYPIC - A Multi-National R&D Project on DP Technology in Ice. In Proc. of the Dynamic Positioning Conference.
Jochmann, P., and Evers, K.U., 2014. Best Practice in Ice Model Testing on Moored Floaters. Proc Arctic Technology Conf (ATC), Houston, Texas, USA, 10-12 February, Paper OTC 24565.
Keinonen, A.J., Shirley, M., Liljestrom, G., and Pilkington, R., 2006. Transit and Stationary Coring Operations in the Central Polar Pack. Proc ICETECH, Paper No. ICETECH06-125-RF.
Kerkeni, S., Dal Santo, X., Doucy, O., Jochmann, P., Haase, A., Metrikin, I., Loset, S., Jenssen, N., Hals, T., Gurtner, A., Moslet, P., and Støle-Hentschel, S. 2014. DYPIC Project: Technological and Scientific Progress Opening New Perspectives. Offshore Technology Conference. doi:10.4043/24652-MS.
Millan, J. and Wang, J., 2011. Ice Force Modeling for DP Control Systems. In Proc. of the Dynamic Positioning Conference.
Maddock, B., Bush, A., Wojahn, T., Kokkinis, T., Younan, A., and Hawkins, J.R., 2011. Advances in Ice Management for Deepwater Drilling in the Beaufort Sea. Proc Int Conf on Port and Ocean Eng under Arctic Conditions (POAC), Montreal, Quebec, July 10-14.
Metrikin, I., 2015. Experimental and Numerical Investigation of Dynamic Positioning in Discontinuous Ice. PhD. Dissertation, NTNU, Norway.
Metrikin, I., and Løset, S. 2013. Non-Smooth 3D Discrete Element Simulation of a Ship in Discontinuous Ice. Proceedings of the International Conference on Port and Ocean Eng under Arctic Conditions (POAC), June 9-13, Espoo, Finland.
Pilkington, R., Keinonen, A., and Sheikin, I., 2006. Ice Observations and Forecasting During the Arctic Coring project, August- Spetember 2004. Proc ICETECH, Paper No. ICETECH06-171-RF.
Sayed, M., Barker, A., 2011. Numerical Simulations of Ice Interaction with a Moored Structure. Proc Arctic Technology Conf (OTC), paper OTC22101, Houston, Texas, USA, February 7-9.
Sayed, M., and Kubat, I., 2011, Forces on Ships Transiting Pressured Ice Cover. Proc Int Offshore and Polar Eng Conf (ISOPE), Maui, Hawaii, 19-24 June, pp.1087-1092.
Sayed, M., Kubat, I., Wright, B., and Millan, J., 2014. Numerical Simulations of Ice Forces on Moored and Thruster-Assisted Drillships. Proc Arctic Technology Conf (ATC), Houston, Texas, USA, 10-12 February, Paper OTC 24647.
Sayed, M., Islam, M., Watson, D., Kubat, I., Gash, R., Wright, B., 2016. DP Drillship Stationkeeping in Ice - Comparison between Numerical Simulations and Ice Basin Tests. Proc Int Offshore and Polar Eng Conf (ISOPE), San Fransisco, CA, 25-30 June.
Scibilia, F., Metrikin, I., Gurtner, A., and Teigen, S.H., 2014. Full-Scale Trials and Numerical Modeling of Sea Ice management in the Greenland Sea. Proc Arctic Technology Conf (ATC), Houston, Texas, USA, 10-12 February, Paper OTC 24643.