SUPPLEMENTARY MATERIAL
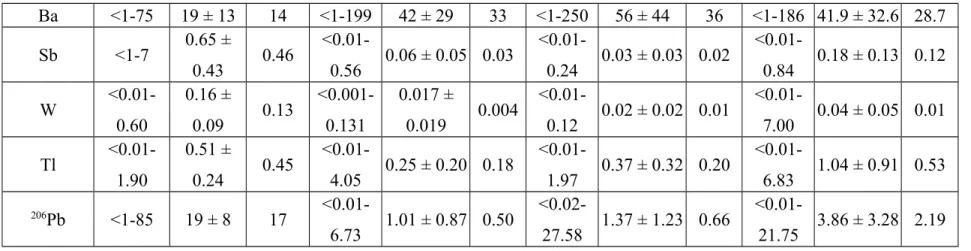
Table S1. Range of elemental composition in soils, leaves, stems and roots harvested on the mine site. Results are reported in μgmetal.gdryweight-1. Min: minimum, Max: maximum, Avg: average, MD: mean deviation, MED: median, n=: number of replicate.
Elements
Soils (n = 433) Leaves (n = 356) Stems (n = 294) Roots (n = 284) Min-Max Avg ± MD Med Min-Max Avg ± MD Med Min-Max Avg ± MD Med Min-Max Avg ±
MD Med Na <1-146 31 ± 24 23 <1-87 19 ± 11 14 <1-191 11 ± 8 8 4-5314 1315 ± 574 1405 Mg <1-6547 1722 ± 944 1324 <1-5399 1853 ± 897 1814 25-1750 811 ± 227 758 <1-1913 751 ± 232 711 Al <1-7011 2466 ± 972 2182 <1-607 90 ± 73 49 1-284 62 ± 48 41 <1-1818 333 ± 250 209 P <1-157 38 ± 26 25 <1-4674 1067 ± 840 851 45-2299 752 ± 424 781 4-2170 554 ± 403 431 K <1-1834 383 ± 304 239 106-20540 7438 ± 3176 6797 1180-12500 4370 ± 1694 3834 31-6192 2373 ± 832 2333 Ca 5-58235 5333 ± 7735 280 12-29271 8373 ± 3888 7870 <1-14512 4848 ± 2245 4481 7-14307 3070 ± 1918 2356 Ti <1-167 18 ± 13 12 <1-5 0.63 ± 0.64 0.26 <0.01-8.37 0.58 ± 0.55 0.30 <1-43 2 ± 2 1 V <1-29 6 ± 4 4 <1-2 0.14 ± 0.12 0.07 <0.01-0.35 0.08 ± 0.06 0.05 <0.01-2.80 0.40 ± 0.27 0.28 Table S1. Continued
Elements Soils (n = 433) Leaves (n = 356) Stems (n = 294) Roots (n = 284) Min-Max Avg ± Med Min-Max Avg ± MD Med Min-Max Avg ± MD Med Min-Max Avg ± MD Med
MD Cr <1-36 7 ± 4 5 0.01-1.12 0.24 ± 0.17 0.15 <0.01-0.35 0.08 ± 0.06 0.05 <0.01-2.80 0.63 ± 0.43 0.43 Mn <1-1421 238 ± 243 82 <1-1448 350 ± 232 250 11-725 142 ± 82 116 <1-289 58 ± 32 47 Fe 1- 84649 31788 ± 11277 29109 2-5610 735 ± 640 385 <1-1799 354 ± 279 228 <1-15920 2415 ± 1746 1570 Co <1-19 4.7 ± 3.1 3.2 <1-3.1 0.6 ± 0.5 0.4 <1-1.7 0.4 ± 0.3 0.2 <1-3.4 0.7 ± 0.4 0.5 Ni <1-33 9.1 ± 5.3 6.9 <1-9.7 2.2 ± 1.5 1.7 <1-4.8 0.1 ± 4.8 0.9 <1-3.9 1.2 ± 0.6 0.9 Cu <1-675 221 ± 97 221 <1-63.8 16.5 ± 10.4 12.8 <1-46.4 13.8 ± 6.7 10.7 <1-163.7 34.7 ± 24.0 24.4 Zn <1-137 51 ± 20 45 <1-514.8 140.9 ± 95.6 94.9 <1-451.2 123.5 ± 73.1 89.6 <1-159.5 56.4 ± 24.6 54.1 As <1-3643 483 ± 270 405 <1-108.6 12.4 ± 11.0 6.1 <1-31.1 5.32 ± 4.6 3.1 <1-130.8 30.1 ± 21.6 19.6 Se <1-516 6 ± 3 4 <1-2.0 0.4 ± 0.3 0.3 <1-1.2 0.3 ± 0.2 0.2 <1-3.56 0.8 ± 0.5 0.6 Mo <1-162 12 ± 6 11 <1-22 1.64 ± 1.39 0.92 <0.03-9.27 0.83 ± 0.60 0.66 <0.01-40.06 2.24 ± 1.74 1.33 Table S1. Continued Elements
Soils (n = 433) Leaves (n = 356) Stems (n = 294) Roots (n = 284) Min-Max Avg ±
MD Med Min-Max Avg ± MD Med Min-Max Avg ± MD Med Min-Max Avg ± MD Med Ag <1-8 3 ± 1 3 <0.01-3.99 0.24 ± 0.21 0.13 <0.01-1.07 0.18 ± 0.13 0.13 <0.01-29.39 2.59 ± 1.97 1.83 Cd <1-2 0.14 ± 0.09 0.1 <0.01-1.18 0.07 ± 0.06 0.03 <0.01-0.91 0.10 ± 0.07 0.07 <0.01-0.40 0.09 ± 0.06 0.07
Ba <1-75 19 ± 13 14 <1-199 42 ± 29 33 <1-250 56 ± 44 36 <1-186 41.9 ± 32.6 28.7 Sb <1-7 0.65 ± 0.43 0.46 <0.01-0.56 0.06 ± 0.05 0.03 <0.01-0.24 0.03 ± 0.03 0.02 <0.01-0.84 0.18 ± 0.13 0.12 W <0.01-0.60 0.16 ± 0.09 0.13 <0.001-0.131 0.017 ± 0.019 0.004 <0.01-0.12 0.02 ± 0.02 0.01 <0.01-7.00 0.04 ± 0.05 0.01 Tl <0.01-1.90 0.51 ± 0.24 0.45 <0.01-4.05 0.25 ± 0.20 0.18 <0.01-1.97 0.37 ± 0.32 0.20 <0.01-6.83 1.04 ± 0.91 0.53 206Pb <1-85 19 ± 8 17 <0.01-6.73 1.01 ± 0.87 0.50 <0.02-27.58 1.37 ± 1.23 0.66 <0.01-21.75 3.86 ± 3.28 2.19
Table S2. Number of replicate (n=) associated with each figure.
Figure 3A and figure 4.
VDC-1 (tailings) VDC-2 ((bulk soils) VDC-3 (bulk soils) VDC-4 (bulk soils) VDC-5 (boreal forest soils) VDC-6 (boreal forest soils) (n=) 106 alder = 25, birch = 48, spruce = 28 alder = 21, birch = 22, spruce = 20 alder = 33, birch = 42, spruce = 46 29 10
Figure 3B and figure 5 (leaves). VDC-2 VDC-3 VDC-4 VDC-5 VDC-6 Alder (n=) 27 22 23 10 10 Birch (n=) 55 23 42 10 9 Spruce (n=) 34 23 51 10 7 Figure 6A (leaves). VDC-2 VDC-3 VDC-4 Alder (n=) 27 22 23 Birch (n=) 55 23 42 Spruce (n=) 34 23 51 Figure 6B (stems). VDC-2 VDC-3 VDC-4 Alder (n=) 24 21 24 Birch (n=) 55 22 43 Spruce (n=) 32 25 48 Figure 6C (roots). VDC-2 VDC-3 VDC-4 Alder (n=) 23 22 28 Birch (n=) 51 21 41 Spruce (n=) 28 21 49