HAL Id: inserm-00135063
https://www.hal.inserm.fr/inserm-00135063
Submitted on 10 Jan 2012
HAL is a multi-disciplinary open access
archive for the deposit and dissemination of
sci-entific research documents, whether they are
pub-lished or not. The documents may come from
teaching and research institutions in France or
abroad, or from public or private research centers.
L’archive ouverte pluridisciplinaire HAL, est
destinée au dépôt et à la diffusion de documents
scientifiques de niveau recherche, publiés ou non,
émanant des établissements d’enseignement et de
recherche français ou étrangers, des laboratoires
publics ou privés.
Reliability of bioimpedance analysis compared with
other adiposity measurements in children: the FLVS II
Study.
Adrien Kettaneh, Barbara Heude, Agnès Lommez, Jean-Michel Borys, Pierre
Ducimetière, Marie-Aline Charles
To cite this version:
Adrien Kettaneh, Barbara Heude, Agnès Lommez, Jean-Michel Borys, Pierre Ducimetière, et al..
Reliability of bioimpedance analysis compared with other adiposity measurements in children: the
FLVS II Study.: Bioimpedance fat measurement in children. Diabetes and Metabolism, Elsevier
Masson, 2005, 31, pp.534-41. �inserm-00135063�
measurements in children: the FLVS II Study
Adrien Kettaneh 1 * , Barbara Heude 1 , Agn s Lommez è 2 , Jean-Michel Borys 2 , Pierre Ducimeti re è 1 , Marie-Aline Charles 1
Epid miologie cardiovasculaire et m tabolique
1 é é INSERM : U258 , INSERM : IFR69 , Universit Paris XI - Paris Sud é , H pital Paulô Brousse 16, Avenue Paul Vaillant-Couturier 94807 VILLEJUIF CEDEX,FR
Association Fleurbaix-Laventie Ville Sant
2 é22 rue du 11 Novembre, 62840 Laventie,FR
* Correspondence should be adressed to: Adrien Kettaneh <kettaneh@vjf.inserm.fr >
Abstract
Summary
Objective
To evaluate the reproducibility of the measurement of body fat by bipedal biometrical impedance analysis (BIA) compared with%
anthropometric measurements of adiposity in children and the correlations between these methods in children and adults. Methods: A
cross-sectional study in a total of 1080 adults and children enrolled in 1999 in the Fleurbaix-Laventie Ville Sant II (FLVS II)é
population-based study in northern France. The reproducibility of anthropometrical and BIA methods was determined by a nested analysis of variance of repeated measurements by 2 investigators and a bipedal BIA device (Tanita TBF 310) in 64 pupils of two 5® th
grade classes. The correlation of BIA and anthropometric adiposity measurements with the unknown relative fat mass or volume of the body estimated by a latent adiposity variable (LAV) was established by the triads method in 1080 subjects of the FLVS II cohort.’
Results
The reproducibility was similar for the sum of skinfolds, waist circumference and BIA % fat measurements (intraclass correlation coefficients: 0.979 0.992). Correlation coefficient between BIA body fat and the LAV was higher than 0.86 in all sex and Tanner– %
stage related groups, and similar in children and adults, except in pubertal boys (0.76). Conclusion
With a high level of reproducibility, foot-to-foot BIA analysis provides a valuable measurement of total % fat for epidemiologic studies in children. However further studies are needed before extrapolating these results to overweight children.
Author Keywords Epidemiology ; Anthropometric ; Reproducibility ; Correlations ; Bioimpedance
MESH Keywords Adipose Tissue ; anatomy & histology ; Adolescent ; Adult ; Analysis of Variance ; Body Height ; Body Mass Index ; Body Size ; Body Weight ; Child ; Electric Impedance ; Female ; France ; Humans ; Male ; Middle Aged ; Reproducibility of Results ; Skinfold Thickness
Adiposity is a predictive factor for diabetes [1 2 , ], cardiovascular diseases [3 ], and disability in the elderly [4 ]. Prevalence of obesity has increased dramatically over the past 30 years in both developed and developing countries [5 –7 ]. This trend is apparent in adults but also in children. In France, prevalence of childhood obesity and overweight reached 12 to 18 in the past ten years with a fourfold rise%
since 1960 [8 9 , ]. An accurate measurement of absolute or relative (i.e. proportional to total body mass or volume) fat mass is a key point to study this obesity epidemic, its causes and consequences. Relative fat mass estimation from the body mass index (BMI) is corrupted by fat-free mass variations, particularly in normal or underweighted subjects in which the ratio between fat-free and fat masses is high. Reference methods, such as underwater weighting or isotope dilution used in medical research, are difficult to perform in large populations where anthropometrical methods are preferred. Even though relying on human intervention, anthropometrical measurements are highly reproducible [10 11 , ]. Skinfolds and circumference measurements are less dependent on fat-free mass than the BMI but may reflect more subcutaneous than visceral or total fat [12 ]. Nevertheless, predictions of adiposity by BMI, skinfolds and circumference measurements, in adult and children populations, are all correlated satisfactorily and robust enough for use in epidemiological studies [12 –15 ].
In the recent years, foot-to-foot biometrical impedance analysis (BIA) provided a convenient method for the measurement of body composition in large populations. According to the National Institutes of Health Technology Assessment Conference Statement on BIA in body composition measurement [16 ], BIA is more accurate than BMI and may be more accurate than skinfolds measurements for the estimation of comparative fat mass. Accuracy of BIA and skinfolds estimation of fat percentage have been validated against reference methods in adults [17 –20 ]. However it has been suggested that BIA based on equations established in adults may not provide a reliable measurement of fat mass in children, and that skinfolds-based estimation should then be preferred or that specific equations be used [21 ,
Bioimpedance fat measurement in children
Page /2 8
Tanner pubertal stage 2, a prediction equation of fat mass from foot-to-foot BIA, that provided better accuracy than anthropometric≤
methods in this population. DXA had been shown to be a precise method for assessing body composition but may slightly underestimate the body fat compared to reference methods % [24 ]. In addition, heavy cost and time-consumption and lack of portability limit the use of this method in the field of epidemiologic studies.
As there is no perfect measure of total % body fat, an alternative approach to the use of a reference measurement method for the validation of BIA is to construct a reference latent adiposity variable (LAV) from the combination of three adiposity markers. This structural equations model approach described by Kaaks [25 ] for the validation of a dietary questionnaire is based on the assumption that the markers are uncorrelated for their random measurement errors. He proposed the use of a biochemical marker as the mean of controlling this assumption. Plasma leptin is highly correlated with adiposity measurements and may then be viewed as a biochemical marker of adiposity [26 ], and combined with anthropometrical and BIA measurements to construct a LAV of adiposity.
The aim of this study was to evaluate the use of foot-to-foot bioimpedance as a tool for measurements of body fat in children in an%
epidemiologic study by:
Comparing the reproducibility of the method to that of the widely used anthropometric measurements
Comparing in children adolescents and adults, the correlations between BIA body fat and the measurements of adiposity provided%
by the different methods, including plasma leptin, and between each measurement and the unknown relative fat mass or volume of the body represented by a latent adiposity variable.
Methods
Study population
The reproducibility study included 64 pupils of two 5 grade classes, in the city of Laventie (north of France) who underwent repeatedth
anthropometrical measurements and BIA determination of fat percent of body mass at one to 2 week intervals.
The correlation study included subjects participating in the Fleurbaix-Laventie Ville Sant II (FLVS II) study which purpose is toé
investigate genetic, metabolic and environmental determinants of adiposity development in children and adults. This community-based cohort was constituted on voluntary basis by 1175 inhabitants 8 year-old and over of the cities of Fleurbaix and Laventie previously enrolled in the Fleurbaix-Laventie Ville Sant I study é [27 ]. We included 1080 of these subjects who completed the entire assessment protocol on adiposity measurements and biological parameters at inclusion in 1999. The study protocol of FLVS II had been previously approved by the ethic committee of Lille on July 1998 and the data files have been declared to the Commission Nationale Informatique et“
Libert .é”
Measurements
Height (to the nearest 1 mm) and weight (to the nearest 0.1 kg) were determined barefoot, in light clothes with a stadiometer and the Tanita TBF 310 body fat analyser (Tanita Corp, France). Prevalence of overweight and obesity was assessed with reference to the body® mass index (BMI), according to the standard definitions (respectively 25 and 30 kg/m2) in adults and to the age and sex related cut-off points established by Cole et al. [28 ] in children and adolescents. The bicipital, tricipital, suprailiac and subscapular skinfolds were measured twice (to the nearest 0.1 mm) with a Harpenden calliper and averaged. The waist circumference was recorded at midpoint between the iliac crest level and the lowest rib. Fat percent of total body mass was determined with a tetrapolar foot-to-foot biometrical impedance analyser (Tanita TBF 310). In the reproducibility study, all measurements above were performed twice by two investigators® on two occasions 6 to 14 days apart. In the correlation study, an alternative determination of the fat % was calculated in children with Tanner stage 2, with Tyrrell s formula ≤ ’ [23 ] using the value of body resistance provided by the TBF 310. A 20 ml fasting venous blood sample was used for a radioimmunoassay determination of leptin levels (Human leptin RIA kitDSL-23100, Webster USA GMBH, Germany).
Statistical analysis
The reproducibility study
A 2 level nested analysis of variance model computed the between-subjects, the within-subject (between-days), and the remaining measurement error. Moreover for skinfolds and waist circumference measurements, a 3 level analysis of variance model determined the between-investigators part of the variance, nested in the within subject factor. Pearson s correlation coefficients between the means of the 3’
anthropometrical measurements and the BIA measurement, were also computed.
As adiposity level and variation differs among genders and during puberty, we conducted an analysis separated in 6 groups according to sex, age (<18 or 18 years-old) and Tanner stage ( 2 or >2) to avoid bias of differential relations among variables according to these≥ ≤
parameters. Logarithmic transformation of all indicators of adiposity was performed because of a skewed distribution. In each group, we estimated the correlation coefficients between a LAV and each of three adiposity indicators by the triads method [25 ]. This methods uses 2x2 Pearson s correlation (r’ ab , rbc , rac ) coefficients between 3 variables (a, b, c) related to an unknown latent variable (t), to estimate correlation coefficients (r , r , r ) between each of these variables and the latent variable:at bt ct
The model assumes linear interrelations and independence of errors between the 3 variables.
We constructed 2 triad s models, hypothesizing that measurement errors were independent and that variables were linked only through’
their relation to the theoretical true adiposity figured by the LAV. Both models comprised the BIA fat of total mass and plasma leptin%
variables. An anthropometric measurement served as the third marker in each model: skinfolds or height-adjusted waist circumference. As BIA estimation of fat mass and waist circumference both depend on height, we used the residuals of a linear regression adjusting waist circumference on height to ensure that correlation between the two variables was only related to their link with adiposity. All 2x2 Pearson’
s correlation coefficients between adiposity variables were determined and used to calculate a correlation coefficient between each adiposity marker and the LAV. In the groups of children with Tanner stage 2, the fat of total mass was estimated either by the value≤ %
given by the Tanita TBF 310 or by Tyrrell s formula ® ’ [23 ].
All analyses were performed with the SAS statistical package (version 8.2, SAS, Cary, NC).®
Results
The reproducibility study
The population included 25 boys (mean age 10.7, range 9 12) and 39 girls (mean age 10.9, range 10 12). One girl (2.6 ) was obese,– – %
two boys (8 ) and 6 girls (15.4 ) were overweight. Mean values of measurements revealed a systematic difference between investigators% %
in the determination of the sum of skinfolds and the waist circumference (Table I ).
For all adiposity measurements, the between-subjects factor was the main source of variation. The reproducibility, assessed by the intra-class correlation coefficient equivalent to the of total variance attributable to the between-subjects factor (% Table I ), was similar for sum of skinfolds, waist circumference and BIA fat % of mass (97.9 99.2 of total variance). For all measurements, a significant– %
within-subject source of variation was distinguished from the remaining measurement error. The 4 level analyses of variance for the sum of skinfolds and the waist circumference (Table II ) showed that the main source of within-subject variation was actually the between-investigators factor which in the model accounted for 2.7 2.8 of total variance. Anthropometric and BIA measurements were– %
highly correlated in both sexes (Table III ).
The correlation study
Sum of skinfolds, BIA % body fat and plasma leptin were higher in females than in males whatever the age-group (all P values <0.003) (Table IV ). Waist circumference was systematically lower in females (all P values <0.03) and BMI higher in adult males than adult females (P 0.0001).=
In both sexes, all adiposity measurements increased with age, except for plasma leptin and BIA body fat in boys that were lower in%
the pubertal (Tanner > 2) than in other groups (all P values <0.0001). The Tyrrell formula [23 ] applied to our population of children with Tanner stage 2 yielded mean body fat values almost two times greater than the values given by the Tanita TBF 310.≤ % ®
Correlations between adiposity measurements
Except in boys at pubertal stage, correlations between BIA fat and other adiposity measurements (% Table V ) were high and similar in children and adults. In pre-pubertal children, the Tyrrell formula [23 ] strengthened slightly, but not significantly, the correlations of BIA fat with all other adiposity measurements except for waist circumference in girls.%
Correlations with the latent adiposity variable
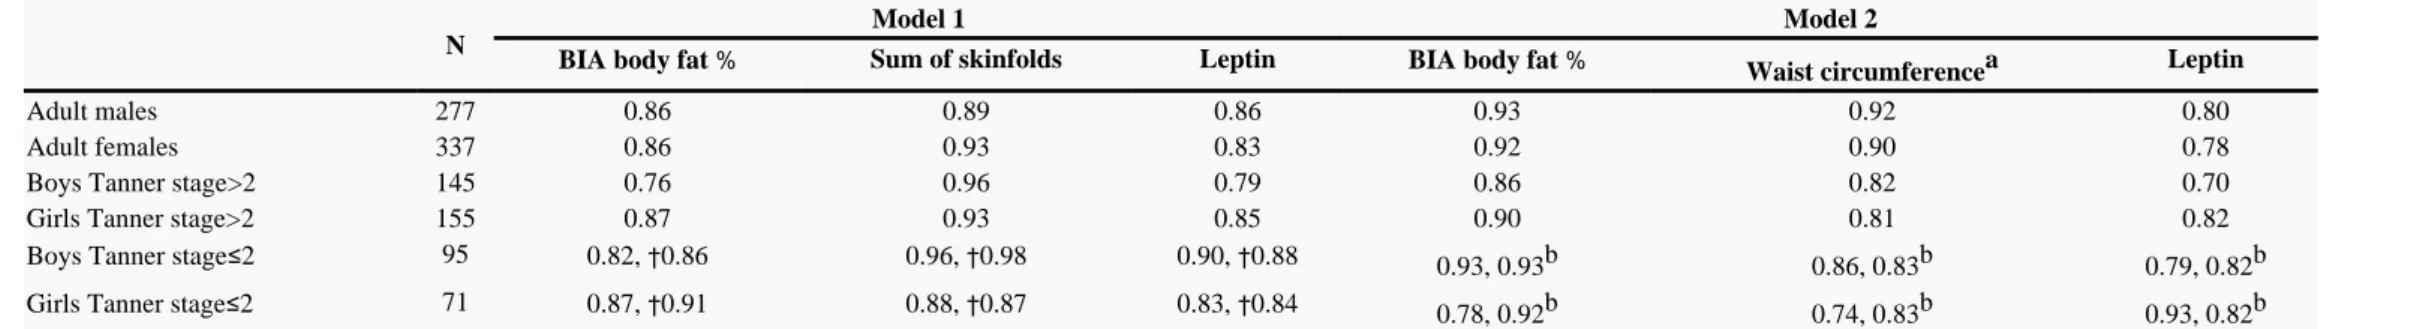
Pearson s correlation coefficients between adiposity variables (’ Table V ) were used to construct 2 models predicting correlation coefficients between 3 adiposity indicators and a latent unknown true adiposity value (Table VI ). In Model 1, sum of skinfolds yielded a higher correlation coefficient with the latent adiposity variable than BIA body fat or plasma leptin in all groups. Discrepancies between%
Bioimpedance fat measurement in children
Page /4 8
Discrepancy between BIA body fat and waist circumference correlations with the LAV was more pronounced in children than in adults.%
Among children, discrepancy between BIA body fat and waist circumference correlations with the LAV was lower in pubertal boy than%
in other groups. In both models, correlation coefficient between BIA body fat and the LAV were similar in children and adults, higher%
than 0.86 in all cases except in pubertal boys in model 1. However, this group was also that in which correlation coefficient between leptin and theoretical adiposity was the lowest in both models.
Discussion
Anthropometric measurements are commonly used indicators of adiposity in epidemiologic studies. The new foot-to-foot BIA devices provide an easy and time sparing measurement of total and body fat mass. However few data are available in children in the condition of%
field studies to help epidemiologists decide whether they can rely on these measurements. A level of reproducibility at least equivalent to that of waist circumference and skinfolds measurements, thought to be investigator-dependent, would be a first argument. In our study, within-subject variability of measurement with the TBF 310 was low, similar to that of anthropometrical measurements. Our results confirm that anthropometrical measurement of adiposity vary between investigators. However, with trained investigators, such as our investigator 1, these sources of variation and error of measurement are rather low. Except in pubertal boys, correlations between BIA and anthropometrical measurements were strong, similar in children and adults.
Underwater weighting, isotope dilution or dual-energy X-ray absorptiometry (DXA) are not convenient for epidemiologic purpose but are often used as references for comparison of more approximate methods. However these methods can not be viewed as providing a perfect measure of adiposity as they all rely on assumptions to estimate the body compartments. By taking into account three distinct markers of adiposity, the triads method [25 ] is a mathematical approach to theoretical true adiposity through a latent variable. Our“ ”
correlation study confirms that bipedal BIA body fat is strongly correlated to theoretical true adiposity, giving coefficients similar to% “ ”
those obtained with anthropometrical measurements. These coefficients were in the same range as those previously established between a precise method such as dual-energy x-ray absorptiometry (DXA) and anthropometrical measurements [29 ] or BIA [30 ]. However correlations measured with the Tanita TBF 310 tended to be weaker in children and teenagers than in adults, especially in boys. BIA is® designed to measure body water and then calculate fat % of mass. This method tends to underestimate fat when the water content of fat-free mass increases [24 ]. Sex, pubertal stage and age are important short term sources of variation of the body composition [29 ], and water content of the fat-free mass [31 ].
By using a DXA body composition reference, Tyrrell et al. [23 ] established a prediction equation of fat mass from bipedal BIA in a population of children of Tanner stage 2. BIA was strongly correlated with DXA measurements in children, even more than what was≤
previously reported in adults. Furthermore they demonstrated that, with reference to DXA, bipedal BIA was more accurate than the body mass index in this population. In our study, in children with Tanner stage 2, the Tyrrell formula ≤ [23 ] provided slightly higher correlation with adiposity than the TBF 310, similar to those in adult groups. However, we disclosed a systematic difference between the body fat %
given by the Tyrrell formula and the TBF 310. The mean values of fat mass provided by the Tanita TBF 310 in our Tanner stage 2% ® ≤
groups were much closer to that determined by DXA in similar European populations than the values calculated with Tyrrell s formula ’ [30 . Tyrrell s formula has been validated in a population with an age range of 4 11. Compared to our Tanner stage 2 groups, this population
] ’ – ≤
was younger and had a much higher prevalence of obesity (30 ). Compared to DXA, BIA may underestimate fat mass in obese children%
and adolescents [32 ]. Thus adjusting a BIA equation in obese children with reference to DXA may have lead to an overestimation of fat mass in normal weight children.%
In the triad models, both including leptin concentration, correlation of bipedal BIA to adiposity in children groups, was weaker than that of skinfolds measurements but stronger than that of waist circumference. In pre-pubertal and pubertal children, serum leptin levels are better correlated to subcutaneous than to global adiposity [33 ]. Thus the model 1 may better reflect the correlation between bipedal BIA and subcutaneous adiposity than between bipedal BIA and total adiposity which may be better estimated by the model 2 which includes waist circumference.
Leptin concentration is strongly correlated to percentage of fat body mass in adults [34 ]. However in normally weighted children a sexual dimorphism exists for the relation between adiposity and leptin concentration [35 ]. Before puberty, leptin concentration is more elevated in girls than in boys and increases with age in both sexes. After the onset of puberty, leptin concentration continues increasing in girls while it declines in boys [33 –35 ]. Short term changes in leptin concentrations in boys around puberty onset, may then explain that the weakest correlations between the body fat and the theoretical adiposity were objectified in Model 1, in boys with Tanner stage >2.%
In conclusion, the reproducibility of anthropometrical and BIA foot-to-foot measurements of fat mass were comparable in children. Except in pubertal boys, the correlation of foot-to-foot BIA measurements of fat mass with anthropometric measurements of fat mass, or plasma leptin were similar in adults and children. The weaker performances in pubertal boys are probably related to their relatively lower
proportion of fat mass and decreasing leptin concentrations. The BIA provides a valuable and time sparing estimation of total adiposity, convenient for epidemiologic studies in children. However further studies are needed before extrapolating these results to overweight children.
Ackowledgements:
The FLVS II study was supported by Knoll, CEDUS, Groupe Fournier, Lesieur, Nestl France, Produits Roche and CISB. We thank directorsé
and teachers of the schools who made the study possible, and all the children and their parents who agreed to participate.
References:
1 .Fagot-Campagna A . Emergence of type 2 diabetes mellitus in children: Epidemiological evidence . J Pediatr Endocrinol Metab . 2000 ; 13 : 1395 - 402
2 .Hypponen E , Virtanen SM , Kenward MG , Knip M , Akerblom HK . Obesity, increased linear growth, and risk of type 1 diabetes in children . Diabetes Care . 2000 ; 23 : 1755 - 60
3 .Singh RB , Niaz MA , Beegom R , Wander GS , Thakur AS , Rissam HS . Body fat percent by bioelectrical impedance analysis and risk of coronary artery disease among urban men with low rates of obesity: The indian paradox . J Am Coll Nutr . 1999 ; 18 : 268 - 73
4 .Visser M , Langlois J , Guralnik JM . High body fatness, but not low fat-free mass, predicts disability in older men and women: The cardiovascular health study . Am J Clin Nutr . 1998 ; 68 : 584 - 90
5 .Gutierrez-Fisac JL , Banegas Banegas JR , Artalejo FR , Regidor E . Increasing prevalence of overweight and obesity among spanish adults, 1987 1997 – . Int J Obes Relat Metab Disord . 2000 ; 24 : 1677 - 82
6 .Olds TS , Harten NR . One hundred years of growth: The evolution of height, mass, and body composition in australian children, 1899 1999 – . Hum Biol . 2001 ; 73 : 727 -38
7 .Caballero B . Introduction. Symposium: Obesity in developing countries: Biological and ecological factors . J Nutr . 2001 ; 131 : 866S - 70S 8 .Pr valence de l ob sit chez l enfant é ’ é é ’ . Expertise, Collective . Ob sit é é. INSERM ; 2000 ; 17 - 27
9 .Rolland-Cachera MF , Castetbon K , Arnault N . Body mass index in 7 9-y-old french children: Frequency of obesity, overweight and thinness – . Int J Obes Relat Metab Disord . 2002 ; 26 : 1610 - 6
10 .Wilmore JH , Stanforth PR , Domenick MA . Reproducibility of anthropometric and body composition measurements: The heritage family study . Int J Obes Relat Metab Disord . 1997 ; 21 : 297 - 303
11 .Mueller WH , Malina RM . Relative reliability of circumferences and skinfolds as measures of body fat distribution . Am J Phys Anthropol . 1987 ; 72 : 437 - 9 12 .Bonora E , Micciolo R , Ghiatas AA . Is it possible to derive a reliable estimate of human visceral and subcutaneous abdominal adipose tissue from simple anthropometric measurements? . Metabolism . 1995 ; 44 : 1617 - 25
13 .Deurenberg P , Weststrate JA , Seidell JC . Body mass index as a measure of body fatness: Age- and sex-specific prediction formulas . Br J Nutr . 1991 ; 65 : 105 - 14 14 .Lean ME , Han TS , Deurenberg P . Predicting body composition by densitometry from simple anthropometric measurements . Am J Clin Nutr . 1996 ; 63 : 4 - 14 15 .Lohman TG , Caballero B , Himes JH . Estimation of body fat from anthropometry and bioelectrical impedance in native american children . Int J Obes Relat Metab Disord . 2000 ; 24 : 982 - 8
16 . . Bioelectrical impedance analysis in body composition measurement: National institutes of health technology assessment conference statement . Am J Clin Nutr . 1996 ; 64 : 524S - 32S
17 .Eaton AW , Israel RG , O Brien ’ KF , Hortobagyi T , McCammon MR . Comparison of four methods to assess body composition in women . Eur J Clin Nutr . 1993 ; 47 : 353 - 60
18 .Desport JC , Preux PM , Guinvarc h ’ S . Total body water and percentage fat mass measurements using bioelectrical impedance analysis and anthropometry in spinal cord-injured patients . Clin Nutr . 2000 ; 19 : 185 - 90
19 .Swinburn BA , Ley SJ , Carmichael HE , Plank LD . Body size and composition in polynesians . Int J Obes Relat Metab Disord . 1999 ; 23 : 1178 - 83 20 .Reilly JJ , Murray LA , Wilson J , Durnin JV . Measuring the body composition of elderly subjects: A comparison of methods . Br J Nutr . 1994 ; 72 : 33 - 44
21 .Hammond J , Rona RJ , Chinn S . Estimation in community surveys of total body fat of children using bioelectrical impedance or skinfold thickness measurements . Eur J Clin Nutr . 1994 ; 48 : 164 - 71
22 .Mast M , Sonnichsen A , Langnase K . Inconsistencies in bioelectrical impedance and anthropometric measurements of fat mass in a field study of prepubertal children . Br J Nutr . 2002 ; 87 : 163 - 75
23 .Tyrrell VJ , Richards G , Hofman P , Gillies GF , Robinson E , Cutfield WS . Foot-to-foot bioelectrical impedance analysis: A valuable tool for the measurement of body composition in children . Int J Obes Relat Metab Disord . 2001 ; 25 : 273 - 8
24 .Bray GA , DeLany JP , Volaufova J , Harsha DW , Champagne C . Prediction of body fat in 12-y-old african american and white children: Evaluation of methods . Am J Clin Nutr . 2002 ; 76 : 980 - 90
25 .Kaaks RJ . Biochemical markers as additional measurements in studies of the accuracy of dietary questionnaire measurements: Conceptual issues . Am J Clin Nutr . 1997 ; 65 : 1232S - 9S
26 .Ruhl CE , Everhart JE . Leptin concentrations in the united states: Relations with demographic and anthropometric measures . Am J Clin Nutr . 2001 ; 74 : 295 - 301 27 .Lafay L , Basdevant A , Charles MA . Determinants and nature of dietary underreporting in a free-living population: The Fleurbaix Laventie Ville Sante (FLVS) study . Int J Obes Relat Metab Disord . 1997 ; 21 : 567 - 73
28 .Cole TJ , Bellizzi MC , Flegal KM , Dietz WH . Establishing a standard definition for child overweight and obesity worldwide: International survey . Bmj . 2000 ; 320 : 1240 - 3
29 .Ogle GD , Allen JR , Humphries IR . Body-composition assessment by dual-energy x- ray absorptiometry in subjects aged 4 26 y – . Am J Clin Nutr . 1995 ; 61 : 746 - 53 30 .Boot AM , Bouquet J , de Ridder MA , Krenning EP , de Muinck Keizer-Schrama SM . Determinants of body composition measured by dual-energy x-ray absorptiometry in dutch children and adolescents . Am J Clin Nutr . 1997 ; 66 : 232 - 8
31 .Roemmich JN , Clark PA , Weltman A , Rogol AD . Alterations in growth and body composition during puberty. I. Comparing multicompartment body composition models . J Appl Physiol . 1997 ; 83 : 927 - 35
32 .Eisenkolbl J , Kartasurya M , Widhalm K . Underestimation of percentage fat mass measured by bioelectrical impedance analysis compared to dual energy x-ray absorptiometry method in obese children . Eur J Clin Nutr . 2001 ; 55 : 423 - 9
33 .Roemmich JN , Rogol AD . Role of leptin during childhood growth and development . Endocrinol Metab Clin North Am . 1999 ; 28 : 749 - 64
34 .Ho SC , Tai ES , Eng PH , Ramli A , Tan CE , Fok AC . A study in the relationships between leptin, insulin, and body fat in asian subjects . Int J Obes Relat Metab Disord . 1999 ; 23 : 246 - 52
35 .Nakanishi T , Li R , Liu Z , Yi M , Nakagawa Y , Ohzeki T . Sexual dimorphism in relationship of serum leptin and relative weight for the standard in normal-weight, but not in overweight, children as well as adolescents . Eur J Clin Nutr . 2001 ; 55 : 989 - 93
Bioimpedance fat measurement in children
Page /6 8
Table I
Nested analysis of variance for anthropometric and BIA measurements of adiposity in 64 children.
Sum of skinfolds (mm) Waist circumference (cm)
Fat of mass%
Investigator 1 Investigator 2 Investigator 1 Investigator 2
Mean value (95 CI)% 34.1 (32.0 36.4)– 31.3 (29.5 33.2)– 58.7 (58.0 59.4)– 59.7 (59.0 60.4)– 16.8 (15.7 17.8)–
of total variance
%
Between subjects 99.2 98.0 98.6 97.9 98.9
Within subjects (between days) 0.64 1.7 0.92 1.3 0.92
Error of measurement 0.16 0.30 0.48 0.74 0.14
Sum of skinfolds, and waist circumference were logtransformed and expressed as geometric mean values and 95 CIs.%
P values are the result of the comparison between the variability of the corresponding factor and the factor immediately nested inside. All between-subjects and within-subjects P values <0.0001.
Table II
Nested analysis of the variance of anthropometrical measurements in 64 children.
Source of variation
% of total variance (P)
Sum of skinfolds Waist circumference
Between subjects 97.0 (<0.0001) 96.7 (<0.0001)
Between-days within subjects 0.00 (0.99) 0.00 (0.99)
Between investigators within subjects and days 2.78 (<0.0001) 2.67 (<0.0001)
Error of measurement 0.22 0.60
P values are the result of the comparison between the variability of the corresponding factor and the factor immediately nested inside.
Table III
Coefficients of correlation between anthropometric and BIA subjects mean values of measurements in 64 children.
Boys Girls
Body mass indexa 0.87 0.95
Sum of skinfoldsa 0.94 0.90
Waist circumferencea b 0.88 0.93
a Logtransformed. b
Adjusted for height. all P values <0.0001.
Table IV
Population characteristics.
Adults Pubertal stage (Tanner stage>2) Pre-pubertal stage (Tanner stage 2)≤
Males Females Boys Girls Boys Girls
N 277 337 145 155 95 71
Age (range) 39.6 (18.0 67.1)– 38.6 (18.0 60.6)– 15.1 (11.3 17.9)– 14.9 (10.5 17.9)– 11.3 (8.1 15.5)– 10.5 (8.00 13.8)–
Body mass index (kg/m2)a 24.9 (24.5 25.4)– 23.7 (23.3 24.2)– 19.3 (18.9 19.8)– 19.8 (19.4 20.3)– 16.9 (16.4 17.4)– 16.5 (16.0 17.0)–
Overweight N ( )% 109 (39.4) 75 (22.3) 12 (8.3) 12 (7.8) 9 (9.6) 8 (11.3)
Obese N ( )% 27 (9.8) 36 (10.7) 2 (1.4) 4 (2.6) 1 (1.06) 1 (1.41)
Body Fat ( )%a 20.1 (19.2 21.0)– 30.8 (29.9 31.7)– 11.4 (10.5 12.3)– 24.0 (23.0 25.2)–
13.5 (12.4 14.7)– 15.8 (13.8 18.1)–
25.0 (23.6 26.5)– b 29.5 (28.1 31.0)– b
Sum of Skinfolds (mm)a 50.7 (48.0 53.6)– 66.2 (63.2 69.4)– 33.8 (31.2 36.5)– 49.2 (46.2 52.4)– 29.1 (26.5 31.9)– 37.1 (33.7 41.0)– Waist circumference (cm)a 88.6 (87.3 89.9)– 77.2 (76.0 78.3)– 70.2 (69.0 71.5)– 67.1 (66.1 68.1)– 62.6 (61.1 64.1)– 59.3 (57.9 60.7)– Plasma leptin (ng/ml)a 3.35 (3.01 3.74)– 12.4 (11.5 13.4)– 1.97 (1.69 2.31)– 9.7 (8.7 10.7)– 3.02 (2.51 3.63)– 5.05 (4.14 6.15)– Values are expressed as mean (95 CI) unless stated otherwise.%
a Geometric mean. b
Tyrrell s formula.’
Table V
Pearson s correlation coefficients between adiposity measurements.’
Adults Pubertal stage (Tanner stage>2) Pre-pubertal stage (Tanner stage 2)≤
Males Females Boys Girls Boys Girls
N 277 337 145 155 145 71
BIA body fat /Sum of skinfolds% 0.76 0.80 0.73 0.81 0.79, 0.84b 0.77, 0.80b
BIA body fat /Waist circumference% a 0.85 0.83 0.70 0.72 0.80, 0.77b 0.57, 0.77b
BIA body fat /Leptin% 0.75 0.71 0.60 0.74 0.74, 0.76b 0.72, 0.76b
BIA body fat /BMI% 0.90 0.85 0.74 0.85 0.82, 0.90b 0.72, 0.88b
Leptin/Sum of skinfolds 0.76 0.77 0.76 0.79 0.87 0.73
Leptin/Waist circumferencea 0.73 0.70 0.57 0.66 0.68 0.68
Leptin/BMI 0.74 0.74 0.55 0.76 0.76 0.76
Sum of skinfolds/Waist circumferencea 0.77 0.81 0.80 0.77 0.80 0.72
Sum of skinfolds/BMI 0.80 0.83 0.80 0.85 0.88 0.80
Waist circumference /BMIa 0.90 0.90 0.86 0.82 0.84 0.80
All variables Logtransformed. All P values <0.0001
a Adjusted for Height; b
Bioimpedance fat measurement in children
Page /8 8
Table VI
Correlation coefficients between adiposity measurements and a latent adiposity variable by the triads method.
N
Model 1 Model 2
BIA body fat % Sum of skinfolds Leptin BIA body fat %
Waist circumferencea Leptin
Adult males 277 0.86 0.89 0.86 0.93 0.92 0.80
Adult females 337 0.86 0.93 0.83 0.92 0.90 0.78
Boys Tanner stage>2 145 0.76 0.96 0.79 0.86 0.82 0.70
Girls Tanner stage>2 155 0.87 0.93 0.85 0.90 0.81 0.82
Boys Tanner stage 2≤ 95 0.82, 0.86† 0.96, 0.98† 0.90, 0.88† 0.93, 0.93b 0.86, 0.83b 0.79, 0.82b
Girls Tanner stage 2≤ 71 0.87, 0.91† 0.88, 0.87† 0.83, 0.84† 0.78, 0.92b 0.74, 0.83b 0.93, 0.82b
The correlation coefficients measure the strength of the relation between each adiposity variable and a latent adiposity variable taking into account 3 adiposity variables. All variables Logtransformed
a
Adjusted for Height;