HAL Id: inserm-00175995
https://www.hal.inserm.fr/inserm-00175995
Submitted on 2 Oct 2007HAL is a multi-disciplinary open access archive for the deposit and dissemination of sci-entific research documents, whether they are pub-lished or not. The documents may come from teaching and research institutions in France or abroad, or from public or private research centers.
L’archive ouverte pluridisciplinaire HAL, est destinée au dépôt et à la diffusion de documents scientifiques de niveau recherche, publiés ou non, émanant des établissements d’enseignement et de recherche français ou étrangers, des laboratoires publics ou privés.
associations and interactions with childhood body fat
mass and insulin secretion in normal children.
Barbara Heude, Clive Petry, Alspac Study Team, Marcus Pembrey, David
Dunger, Ken Ong
To cite this version:
Barbara Heude, Clive Petry, Alspac Study Team, Marcus Pembrey, David Dunger, et al.. The insulin gene variable number of tandem repeat: associations and interactions with childhood body fat mass and insulin secretion in normal children.: INS VNTR, fat mass and insulin secretion. Journal of Clinical Endocrinology and Metabolism, Endocrine Society, 2006, 91 (7), pp.2770-5. �10.1210/jc.2005-2055�. �inserm-00175995�
The insulin gene VNTR: associations and interactions with childhood body fat
mass and insulin secretion
Short title: INS VNTR, fat mass and insulin secretion
Barbara Heude1, Clive J Petry2, the ALSPAC study team3, Marcus Pembrey4, David B
Dunger2, Ken K Ong1,2
1
Medical Research Council Epidemiology Unit, Cambridge, UK
2
Department of Paediatrics, University of Cambridge, UK
3
Unit of Paediatric and Perinatal Epidemiology, Department of Community Based
Medicine, University of Bristol, UK
4
Clinical and Molecular Genetics Unit, Institute of Child Health, University College
London, UK
Correspondence to:
Dr Ken Ong
MRC Epidemiology Unit
Strangeways Research Laboratory, Wort's Causeway
Cambridge CB1 8RN UK
Tel: +44 1223 740 003
Fax: +44 1223 740050
Email: [email protected]
HAL author manuscript inserm-00175995, version 1
Abstract
Context Polymorphism at the insulin gene (INS) VNTR shows variable associations
with childhood BMI in different populations.
Objective To study INS VNTR associations with body composition and insulin
secretion in children.
Design Prospective birth cohort study
Participants 947 children genotyped for the INS VNTR
Main outcome measures Whole body DXA at 9 years to estimate height-corrected
fat mass index (FMI), truncal fat index (TFI) and fat-free mass (FFM). Insulin
secretion post-oral glucose at 8y.
Results Homozygous III/III children had higher BMI (p=0.020), FMI (p=0.015) and
TFI (p=0.022) at 9y than class I bearers, but no difference in FFM (p=0.23). Gain in
weight SD score between birth to 3y was positively associated with BMI, FMI and
TFMI in class I bearers, but not in III/III children (p-interaction with genotype =
0.009 to 0.066). INS VNTR genotype was not overall associated with insulin secretion
at 8y (p=0.64), but class I bearers showed a stronger positive correlation between
insulin secretion and BMI at 8y (regression coefficient ± SE: 0.26±0.05, p<0.0001)
than III/III children (-0.10±0.07, p=0.48) (p-interaction=0.003).
Conclusion We clarified that the overall association between INS VNTR class III/III
genotype and larger BMI in this population relates to fat mass, but not fat-free mass.
In contrast, among the sub-group of children who showed rapid infancy weight gain,
class I bearers tended to have larger BMI and fat mass than III/III children. This
genetic interaction could relate to insulin secretion, which in class I bearers increased
more rapidly with overweight and obesity.
Introduction
Hopes of preventing childhood obesity rely not only on effective interventions, but
also on the early identification of those children who are at highest risk of becoming
overweight or obese. Several studies have recently reported that rapid weight gain
during early postnatal life predicts subsequent increased obesity risk during later
childhood, and this risk persists in young adults (1-4). We hypothesised that
childhood adiposity relates to both genetic factors and rate of early postnatal weight
gain.
We recently reported confirmation of association between the insulin gene (INS)
variable number of tandem repeat (VNTR) polymorphism and size at birth in the
Avon Longitudinal Study of Parents and Children (ALSPAC), both by repeated
association in a 2nd ALSPAC sub-group, and by demonstrating association with
parental transmitted alleles (5). The class III alleles were recessively associated with
larger head circumference at birth, higher cord blood levels of insulin-like growth
factor-2, and those associations showed significant interaction with birth order and
postnatal rapid weight gain, a marker of previous intra-uterine growth restriction.
In that study of normal representative UK children, we also observed that class III/III
children had greater body weight, BMI and waist circumference at age 8 years;
however those postnatal associations appeared to be reversed among the 25% of
children who showed early postnatal rapid weight gain (5). Similarly, among obese
French children the INS VNTR class I alleles, rather than the class III, were associated
with increased BMI gains (6). A further study in obese children reported that the INS
VNTR was a quantitative trait locus for the insulin response to oral glucose, and those
authors hypothesised that class I alleles could confer greater insulin secretion for the
degree of BMI compared to class III alleles (7).
We have now reanalysed our existing INS VNTR genotype data in the ALSPAC
children with new phenotype data on body composition at age 9 years, in order to
distinguish between genetic associations with fat mass or lean mass. We also aimed to
confirm the reported interactive effects of INS VNTR genotype and BMI on insulin
secretion.
Methods
Subjects
As part of the ALSPAC study, previously described (8), the “Children in Focus” and
“Control” sub-cohorts were measured at age 3 years, in addition to the whole
ALSPAC cohort measurements at birth, 7 years and 9 years, when all children also
had a whole body dual X-ray emission absorptiometry (DXA) scan. Analysis of body
composition at age 9 years was based on 947 children with full data on DXA
parameters, early growth phenotypes and INS VNTR genotype. Analysis of insulin
secretion at age 8 years was based on 750 children with complete data. The subjects
analysed in this paper did not differ from the whole ALSPAC cohort with respect to
childhood growth at age 9 years (data provided to reviewers). Preparation of DNA
and genotyping for INS VNTR were previously described (5).
Body composition
At age 9.9 (+/- 0.33) years all ALSPAC children were invited to attend for a 3-hour
hands-on assessment. Height was measured with shoes and socks removed using a
Harpenden stadiometer (Holtain Ltd, Crymych, Pembs, UK). Weight was measured
using a Tanita TBF 305 body fat analyser and weighing scales (Tanita UK Ltd,
Yewsley, Middlesex, UK). Total fat (FM), central fat and lean mass (LM) were
measured using a Lunar Prodigy DXA scanner (GE Medical Systems Lunar,
Madison, WI, USA). The scans were visually inspected and realigned where
necessary. Trunk fat mass was estimated using the automatic region of interest that
included chest, abdomen and pelvis.
Body composition variables were corrected for differences in height by calculating
the fat mass index (fat mass/ height2) and truncal fat mass index (truncal fat mass/
height2) (9).
Insulin secretion
At age 8 years (mean ± SD: 8.2 ± 0.1, range 8.0 to 8.5 years), 851 children (750 with INS VNTR genotype data) from the Children in Focus or Control sub-cohorts attended the research clinic to in the morning after an overnight fast (10). Fasting was validated by
questionnaire and data were excluded if they were taking oral steroids, or had any
current infection. A venous blood sample was taken to measure glucose and insulin
levels, before and 30-min after an oral glucose load (1.75 g/kg, maximum 75g) as a
drink (Lucozade Energy Original, GlaxoSmithKline PLC, Greenford, Middlesex,
UK).
Insulin sensitivity was estimated using the Homeostasis model computer program,
kindly provided by Dr Jonathan Levy, University of Oxford, UK (11). Insulin
secretion was calculated as the corrected insulin response from 30mins insulin and
glucose levels: [Insulin30 / (Glucose30 x (Glucose30 – 3.9))] (mU/mmol2) (12).
Following oral glucose there is a dose-response relationship between glucose and
insulin (12), and this correction for the attained glucose level has been shown to
correlate most closely with the first-phase insulin response (13). Similar results were
found when insulin secretion was estimated using the insulinogenic index (insulin30 –
insulin0) / (glucose30 – glucose0) (14).
Statistical analysis
All data were explored for normality of distribution and log transformed where
appropriate. The association between genotype and phenotype was analysed using a
linear regression model under both global and recessive models.
For the association with DXA, adjustment was performed on age, gender, parity,
education level of the mother and change in weight between birth and 3 years.
Interaction between genotype and postnatal weight gain was examined by introducing
and testing the interactive term (genotypeÎweight gain) in the previous models. Adjusted regression coefficients are shown separately for each genotype group.
The association between genotype and insulin secretion at 8 years was examined
adjusting for age, gender and BMI at 8 years. The interaction effect between BMI and
genotype was analysed introducing and testing the interactive term (genotypeÎBMI). Analyses were performed using SPSS for Windows version 11.0 (SPSS, Chicago, IL).
Results
Mean body size and body composition at age 9 years are displayed by genotype in
Table 1. Overall, homozygous III/III children had larger body weight, BMI, fat mass
index and truncal fat mass index at age 9 years than class I bearers (p=0.01 to 0.02),
but there was no difference in fat-free mass (Table 1).
Rate of early postnatal weight gain between birth to 3 years was positively associated
with BMI at age 9 years in class I/I and I/III children (p<0.0001), but not in III/III
children (p=0.74); and the difference in regression slopes between class I bearers and
homozygous III/III children was significant, (p-interaction with genotype=0.009;
Table 2, Figure 1). Similarly, rate of weight gain between birth to 3 years was
positively associated with fat mass index at age 9 years in class I bearers (p<0.0001),
but not in III/III children (p=0.68), (p-interaction=0.064; Table 2).
Mean fasting insulin levels, insulin sensitivity and parameters of insulin secretion at
age 8 years are displayed by genotype in Table 3. No differences in mean values were
observed between genotypes. However, in class I bearers insulin secretion showed a
much closer correlation with BMI at 8 years than in homozygous III/III children
(p-interaction=0.003; Table 3; Figure 2). A closer correlation between insulin secretion
and insulin sensitivity was also seen in class I bearers (I/I: r= -0.22, p<0.0001; I/III: r=
-0.31, p<0.0001) than in homozygous III/III children (III/III: r=0.09, p=0.6)
(p-interaction=0.01).
Discussion
In this representative cohort of UK children the INS VNTR class III/III genotype was
associated with increased childhood body fat mass in the overall population. These
results do not represent independent confirmation of our previous reported association
between INS VNTR with BMI at age 8 years in this same group of subjects (5),
however they clarify that the association is with body fat mass rather than lean mass.
Furthermore, we provide significant confirmation of two recently reported genetic
interactions, which many go some way towards explaining the different INS VNTR
genotype associations seen in different childhood sub-groups. First, as we previously
observed (5), the III/III genotype association with larger size was particularly seen
among those children who did not gain weight rapidly during infancy. In contrast,
with increasing rate of early postnatal weight gain class I bearers, but not III/III
genotype children, had larger BMI and fat mass at age 9 years. Secondly, similar to
another previous study (7), we found that in class I bearers insulin secretion increased
significantly more rapidly with increasing BMI compared to class III/III children.
In childhood populations obesity risk has been variably associated with either class III
or class I INS VNTR alleles. Among children with early onset obesity those with the
class I allele had greater BMI gains (6), and class I allele have been associated with
overweight in a further French childhood growth study (15); in contrast in another
study of non-obese girls the III/III homozygotes had greater fat mass by DXA (16).
Recent adult population studies the INS VNTR showed no overall association with
obesity risk (17, 18). Our findings of genetic interaction with early postnatal weight
gain on subsequent BMI and body composition could provide a possible explanation
for these contrasting reports. Our findings could suggest two separate pathways to
later obesity risk: rapid infant weight gain associated with the INS VNTR class I
allele, and non-rapid infant weight gain associated with the III/III genotype. Genetic
association studies for obesity should consider such potential interactions with early
postnatal weight gain.
A further complexity is that effects of INS VNTR alleles may differ according to
parent-of origin (19). Among French children with early onset obesity, those who
inherited a class I allele from their father (but not from their mother) had a 1.8-fold
increased risk of obesity (20). Our studies in this ALSPAC sub-cohort do not have
sufficient power to explore parent-of-origin effects (5). Selection of children with
extreme early-onset obesity would also provide much greater power to detect the class
I association with obesity, however population-based studies are more generalisable
and may be more likely to confirm interactive effects with the wider range of early
growth trajectories.
Our studies have consistently shown apparent recessive effects of class III alleles on
size at birth, childhood growth and IGF2 protein levels at birth (5, 21), and the mean
values and regression coefficients reported here in I/I and I/III children were near
identical. However, other studies have found apparent dominant effects of class III
alleles (7, 22, 23). Recently Rodriguez et al. reported confirmation of associations
with a haplotype in IGF2-INS-TH region tagged by INS VNTR class I alleles,
together with allele A of IGF2 ApaI, and allele 9 of TH01, with both lower BMI and
lower insulin secretion in adult men from two population-based UK cohorts (24, 25).
Thus, the genetic associations we observed could possibly be explained by specific
sub-types of INS VNTR allele class, or by linkage disequilibrium with other
neighbouring variants (26).
The INS VNTR could directly influence postnatal body size by altering INS or IGF2
transcription in utero (23, 27), or during postnatal life. The increased type 1 diabetes
risk associated with class I alleles (22, 26) has been attributed to reduced fetal thymic
insulin mRNA expression leading to loss of immune tolerance to insulin (23, 28). In
contrast to those studies in the thymus, in transfected pancreatic cell lines and fetal
pancreas class I alleles are associated with increased insulin mRNA expression
(29)(30). Polymorphism at the INS VNTR minisatellite may alter a transcription
promoter binding site (31), and transfection of class I alleles has been reported to
influence alternative splicing of INS intron 1 resulting in longer, mature mRNA
transcripts and higher proinsulin levels (32). In adults class I allele are associated with
pulsatility of beta-cell insulin secretion (33).
Thus, it is possible that the class I allele, could confer a greater responsiveness in
insulin secretion to changes in BMI and insulin sensitivity, and therefore a
predisposition to storing adipose rather than lean tissue during periods of rapid weight
gain, or in obese children (6). This could predispose to future type 2 diabetes, in
particular related to the development of insulin resistance. Conversely, relatively
lower insulin secretion in class III/III subjects in the face of increasing BMI or insulin
resistance could also contribute to increased type 2 diabetes risk (34). Recent large
studies in adults have shown no overall influence of INS VNTR genotype on type 2
diabetes risk (35). However, similar to obesity risk, we hypothesise that the
pathogenesis and phenotype of type 2 diabetes could differ according to both early
weight gain patterns and INS VNTR genotype.
In conclusion, in these representative children the INS VNTR class III/III genotype
was overall associated with increased adiposity. However significant genetic
interactions were seen with BMI and insulin secretion that could also support a class I
allele predisposition to obesity following rapid infant weight gain. Different INS
VNTR genotypes and patterns of early postnatal weight gain could underlie discrete
developmental pathways to obesity and type 2 diabetes risks.
Acknowledgments
We are extremely grateful to all the children and parents who took part in the study
and to the midwives for their co-operation and help in recruitment. ALSPAC is
supported by the Medical Research Council (MRC), the Wellcome Trust, the
Department of Health, the Department of the Environment, the European
Commission, and many others. DD is supported by the Wellcome Trust and the
Juvenile Diabetes Research Foundation.
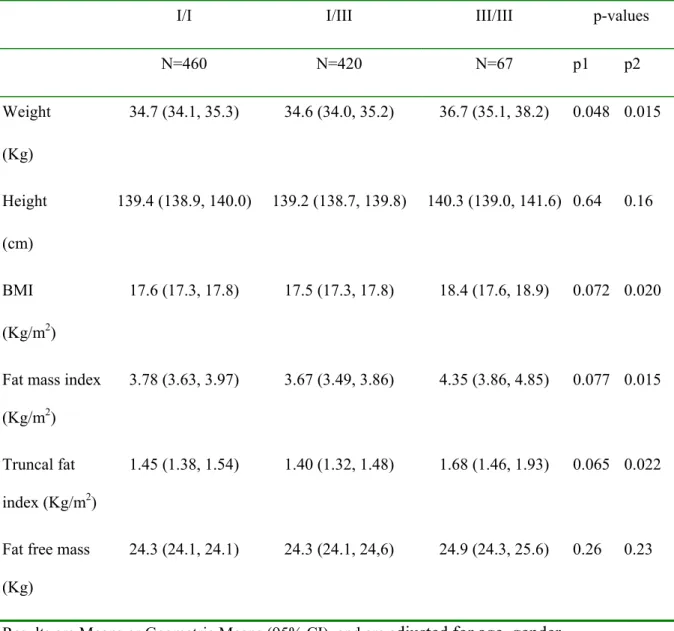
Table 1: Body size and body composition at age 9 years, stratified by INS VNTR
genotype.
I/I I/III III/III p-values
N=460 N=420 N=67 p1 p2 Weight (Kg) 34.7 (34.1, 35.3) 34.6 (34.0, 35.2) 36.7 (35.1, 38.2) 0.048 0.015 Height (cm) 139.4 (138.9, 140.0) 139.2 (138.7, 139.8) 140.3 (139.0, 141.6) 0.64 0.16 BMI (Kg/m2) 17.6 (17.3, 17.8) 17.5 (17.3, 17.8) 18.4 (17.6, 18.9) 0.072 0.020
Fat mass index (Kg/m2)
3.78 (3.63, 3.97) 3.67 (3.49, 3.86) 4.35 (3.86, 4.85) 0.077 0.015
Truncal fat index (Kg/m2)
1.45 (1.38, 1.54) 1.40 (1.32, 1.48) 1.68 (1.46, 1.93) 0.065 0.022
Fat free mass (Kg)
24.3 (24.1, 24.1) 24.3 (24.1, 24,6) 24.9 (24.3, 25.6) 0.26 0.23
Results are Means or Geometric Means (95% CI), and are adjusted for age, gender, mother’s education level, parity and weight change between 0 to 3 years.
p1: Difference between means under the global model (I/I vs. I/III vs. III/III)
p2: Difference between means under the recessive model (III/III vs. I/I and I/III)
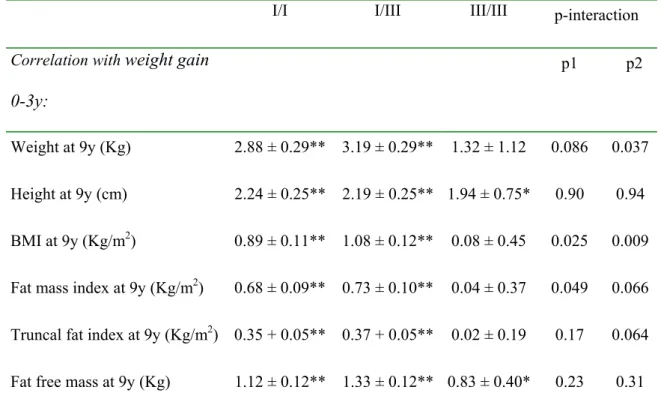
Table 2: Correlations between early postnatal weight gain (change in weight SD
score from birth to 3 years) and body size and composition at 9 years, stratified by
INS VNTR genotype.
I/I I/III III/III p-interaction
Correlation with weight gain
0-3y:
p1 p2
Weight at 9y (Kg) 2.88 ± 0.29** 3.19 ± 0.29** 1.32 ± 1.12 0.086 0.037 Height at 9y (cm) 2.24 ± 0.25** 2.19 ± 0.25** 1.94 ± 0.75* 0.90 0.94 BMI at 9y (Kg/m2) 0.89 ± 0.11** 1.08 ± 0.12** 0.08 ± 0.45 0.025 0.009 Fat mass index at 9y (Kg/m2) 0.68 ± 0.09** 0.73 ± 0.10** 0.04 ± 0.37 0.049 0.066 Truncal fat index at 9y (Kg/m2) 0.35 + 0.05** 0.37 + 0.05** 0.02 ± 0.19 0.17 0.064 Fat free mass at 9y (Kg) 1.12 ± 0.12** 1.33 ± 0.12** 0.83 ± 0.40* 0.23 0.31
Regression coefficients are displayed (± SE), adjusted for age, gender, mother’s
education level, and parity.
P-values for regression coefficients within each group: *p<0.05; **p< 0.0001
P-interaction: p1: Difference between regression coefficients under the global model
(I/I vs. I/III vs. III/III); p2: Difference between regression coefficients under the
recessive model (III/III vs. I/I and I/III)
Table 3: Insulin sensitivity and secretion at 8 years, stratified by INS VNTR
genotype.
I/I I/III III/III p-values
N=349 N=341 N=60 p1 p1 Fasting insulin (mU/l) 5.1 (4.8, 5.5) 5.2 (4.9, 5.6) 5.2 (4.4, 6.2) 0.86 0.90 Fasting glucose (mmol/l) 4.9 (4.9, 5.0) 5.0 (4.9, 5.0) 5.0 (4.9, 5.1) 0.66 0.44 Insulin sensitivity (%HOMA) 189 (177, 201) 185 (173, 197) 183 (156, 213) 0.87 0.82
Corrected insulin response
(mU/mmol2)
1.38 (1.27, 1.51) 1.39 (1.27, 1.52) 1.49 (1.20, 1.84) 0.83 0.55
Insulinogenic index (mU/mmol)
12.7 (11.7, 13.9) 13.2 (12.0, 14.4) 14.4 (11.6, 17.8) 0.58 0.36
Results are Means or Geometric Means (95% CI), adjusted for age and gender. p1: Difference between means under the global model (I/I vs. I/III vs. III/III)
p2: Difference between means under the recessive model (III/III vs. I/I and I/III)
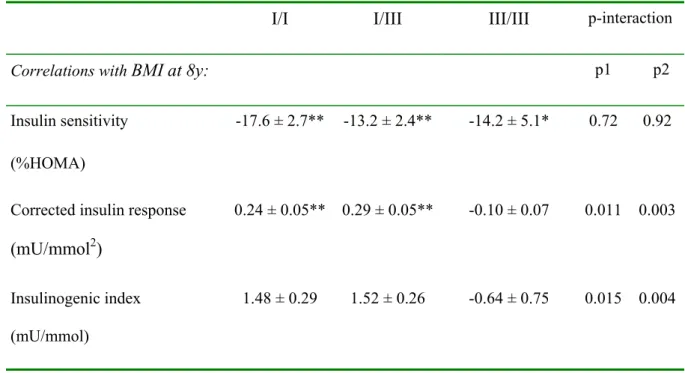
Table 4: Correlations between BMI at 8 years and indices of insulin sensitivity and
insulin secretion at 8 years, stratified by INS VNTR genotype.
I/I I/III III/III p-interaction
Correlations with BMI at 8y: p1 p2
Insulin sensitivity (%HOMA)
-17.6 ± 2.7** -13.2 ± 2.4** -14.2 ± 5.1* 0.72 0.92
Corrected insulin response
(mU/mmol2)
0.24 ± 0.05** 0.29 ± 0.05** -0.10 ± 0.07 0.011 0.003
Insulinogenic index (mU/mmol)
1.48 ± 0.29 1.52 ± 0.26 -0.64 ± 0.75 0.015 0.004
Regression coefficients are displayed (± SE), adjusted for age and gender.
P-values for regression coefficients within each group: *p<0.05; **p< 0.0001
P-interaction: p1: Difference between regression coefficients under the global model
(I/I vs. I/III vs. III/III); p2: Difference between regression coefficients under the
recessive model (III/III vs. I/I and I/III)
Figure 1: BMI at age 9 years was positively related to early postnatal weight gain (change
in weight SD score from birth to 3 years) in INS VNTR class I bearers (I/I and I/III:
p<0.0001, N=880) but not in III/III children (p=0.74, N=67) (p-interaction with genotype =
0.009).
Change in W eight SDS 0-3y
4 3 2 1 0 -1 -2 -3 -4 B M I a t a g e 9 y e a rs ( K g /m 2 ) 40 30 20 10 III/III I/III I/I
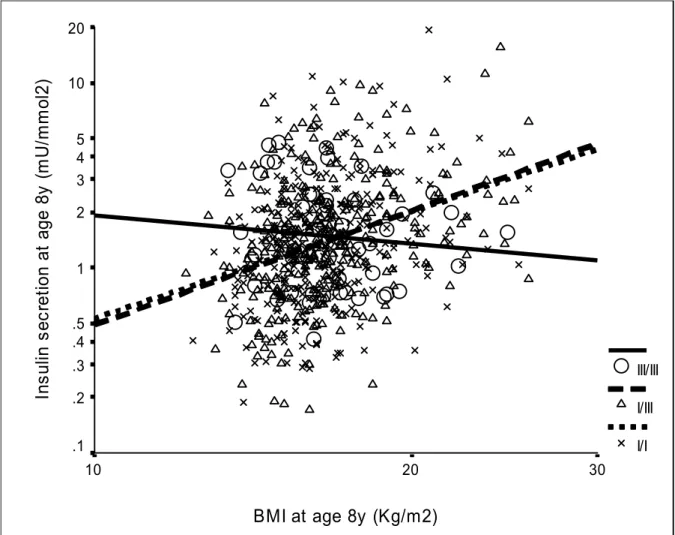
Figure 2: Insulin secretion at age 8 years (corrected insulin response) was positively related
to BMI at age 8 years in INS VNTR class I bearers (I/I and I/III, p<0.0001, N=690) but not
in III/III children (p=0.48, N=60) (p-interaction=0.003).
BMI at age 8y (Kg/m2) 30 20 10 In s u lin s e c re ti o n a t a g e 8 y ( m U /m m o l2 ) 20 10 5 4 3 2 1 .5 .4 .3 .2 .1 III/III I/III I/I
References
1. Ong KK, Ahmed ML, Emmett PM, Preece MA, Dunger DB, the-ALSPAC-Study-Team 2000 Association between postnatal catch-up growth and obesity in
childhood: prospective cohort study. BMJ 320:967-971
2. Stettler N, Zemel BS, Kumanyika S, Stallings VA 2002 Infant weight gain and
childhood overweight status in a multicenter cohort study. Pediatrics 109:194-199 3. Stettler N, Kumanyika SK, Katz SH, Zemel BS, Stallings VA 2003 Rapid weight
gain during infancy and obesity in young adulthood in a cohort of African Americans. Am J Clin Nutr 77:1374-8
4. Ekelund U, Ong K, Linne Y, Neovius M, Brage S, Dunger DB, Wareham NJ, Rossner S 2004 Both infancy and childhood weight gain predict obesity risk at age
17 years: Prospective birth cohort study (SWEDES). Obes Res 12:A186
5. Ong KK, Petry CJ, Barratt BJ, Ring S, Cordell HJ, Wingate DL, Pembrey ME, Todd JA, Dunger DB 2004 Maternal-fetal interactions and birth order influence
insulin variable number of tandem repeats allele class associations with head size at birth and childhood weight gain. Diabetes 53:1128-33
6. Le Stunff C, Fallin D, Schork NJ, Bougneres P 2000 The insulin gene VNTR is
associated with fasting insulin levels and development of juvenile obesity. Nat Genet 26:444-446
7. Dos Santos C, Fallin D, Le Stunff C, LeFur S, Bougneres P 2004 INS VNTR is a
QTL for the insulin response to oral glucose in obese children. Physiol Genomics 16:309-13
8. Golding J, Pembrey ME, Jones R 2001 ALSPAC--the Avon Longitudinal Study of
Parents and Children. I. Study methodology. Paediatr Perinat Epidemiol 15:74-87 9. Wells JC, Cole TJ 2002 Adjustment of fat-free mass and fat mass for height in
children aged 8 y. Int J Obes Relat Metab Disord 26:947-52
10. Ong KK, Petry CJ, Emmett PM, Sandhu MS, Kiess W, Hales CN, Ness AR, the-ALSPAC-study-team, Dunger DB 2004 Insulin sensitivity and secretion in
normal children related to size at birth, postnatal growth, and plasma insulin-like growth factor-I levels. Diabetologia 47:1064-1070
11. Levy JC, Matthews DR, Hermans MP 1998 Correct homeostasis model
assessment (HOMA) evaluation uses the computer program. Diabetes Care 21:2191-2192
12. Sluiter WJ, Erkelens DW, Reitsma WD, Doorenbos H 1976 Glucose tolerance
and insulin release, a mathematical approach I. Assay of the beta-cell response after oral glucose loading. Diabetes 25:241-244
13. Hanson RL, Pratley RE, Bogardus C, Venkat Narayan KM, Roumain JM, Imperatore G, Fagot Campagna A, Pettitt DJ, Bennett PH, Knowler WC 2000
Evaluation of simple indices of insulin sensitivity and insulin secretion for use in epidemiologic studies. Am J Epidemiol 151:190-198
14. Phillips DI, Clark PM, Hales CN, Osmond C 1994 Understanding oral glucose
tolerance: comparison of glucose or insulin measurements during the oral glucose tolerance test with specific measurements of insulin resistance and insulin secretion. Diabet Med 11:286-292
15. Heude B, Dubois S, Charles MA, Deweirder M, Dina C, Borys JM, Ducimetiere P, Froguel P 2004 VNTR polymorphism of the insulin gene and childhood
overweight in a general population. Obes Res 12:499-504
16. Thorsby PM, Berg JP, Birkeland KI 2005 Insulin gene variable number of tandem
repeats is associated with increased fat mass during adolescence in non-obese girls. Scand J Clin Lab Invest 65:163-8
17. Bennett A, Sovio U, Ruokonen A, Martikainen H, Pouta A, Taponen S, Hartikainen AL, Franks S, Peltonen L, Elliott P, Jarvelin MR, McCarthy MI
2005 No association between insulin gene variation and adult metabolic phenotypes in a large Finnish birth cohort. Diabetologia 48:886-91
18. Sandhu MS, Heude B, Young EH, Luben R, Luan J, Khaw KT, Todd J, Wareham NJ 2005 INS VNTR class genotype and indexes of body size and
obesity: population-based studies of 7,999 middle-aged men and women. Diabetes 54:2812-5
19. Moore GE, Abu-Amero SN, Bell G, Wakeling EL, Kingsnorth A, Stanier P, Jauniaux E, Bennett ST 2001 Evidence that insulin is imprinted in the human yolk
sac. Diabetes 50:199-203
20. Le Stunff C, Fallin D, Bougneres PF 2001 Paternal transmission of the very
common class I INS VNTR alleles predisposes to childhood obesity. Nat Genet 29:96-99
21. Dunger DB, Ong KK, Huxtable SJ, Sherriff A, Woods KA, Ahmed ML, Golding J, Pembrey ME, Ring S, Bennett ST, Todd JA 1998 Association of the
INS VNTR with size at birth. Nat Genet 19:98-100
22. Bennett ST, Lucassen AM, Gough SC, Powell EE, Undlien DE, Pritchard LE, Merriman ME, Kawaguchi Y, Dronsfield MJ, Pociot F, al e 1995 Susceptibility
to human type 1 diabetes at IDDM2 is determined by tandem repeat variation at the insulin gene minisatellite locus. Nat Genet 9:284-292
23. Bennett ST, Wilson AJ, Cucca F, Nerup J, Pociot F, McKinney PA, Barnett AH, Bain SC, Todd JA 1996 IDDM2-VNTR-encoded susceptibility to type 1
diabetes: dominant protection and parental transmission of alleles of the insulin gene-linked minisatellite locus. J Autoimmun 9:415-421
24. O'Dell SD, Bujac SR, Miller GJ, Day IN 1999 Associations of IGF2 ApaI RFLP
and INS VNTR class I allele size with obesity. Eur J Hum Genet 7:821-7
25. Rodriguez S, Gaunt TR, Dennison E, Chen XH, Syddall HE, Phillips DI, Cooper C, Day IN 2006 Replication of IGF2-INS-TH(*)5 haplotype effect on
obesity in older men and study of related phenotypes. Eur J Hum Genet 14:109-16 26. Barratt BJ, Payne F, Lowe CE, Hermann R, Healy BC, Harold D, Concannon
P, Gharani N, McCarthy MI, Olavesen MG, McCormack R, Guja C, Ionescu-Tirgoviste C, Undlien DE, Ronningen KS, Gillespie KM, Tuomilehto-Wolf E, Tuomilehto J, Bennett ST, Clayton DG, Cordell HJ, Todd JA 2004 Remapping
the insulin gene/IDDM2 locus in type 1 diabetes. Diabetes 53:1884-9
27. Paquette J, Giannoukakis N, Polychronakos C, Vafiadis P, Deal C 1998 The INS
5' variable number of tandem repeats is associated with IGF2 expression in humans. J Biol Chem 273:14158-14164
28. Pugliese A, Zeller M, Fernandez A, Jr., Zalcberg LJ, Bartlett RJ, Ricordi C, Pietropaolo M, Eisenbarth GS, Bennett ST, Patel DD 1997 The insulin gene is
transcribed in the human thymus and transcription levels correlated with allelic variation at the INS VNTR-IDDM2 susceptibility locus for type 1 diabetes. Nat Genet 15:293-297
29. Lucassen AM, Screaton GR, Julier C, Elliott TJ, Lathrop M, Bell JI 1995
Regulation of insulin gene expression by the IDDM associated, insulin locus haplotype. Hum Mol Genet 4:501-506
30. Vafiadis P, Bennett ST, Colle E, Grabs R, Goodyer CG, Polychronakos C 1996
Imprinted and genotype-specific expression of genes at the IDDM2 locus in pancreas and leucocytes. J Autoimmun 9:397-403
31. Catasti P, Chen X, Moyzis RK, Bradbury EM, Gupta G 1996 Structure-function
correlations of the insulin-linked polymorphic region. J.Mol.Biol. 264:534-545 32. Kralovicova J, Gaunt TR, Rodriguez S, Wood PJ, Day IN, Vorechovsky I 2006
Variants in the Human Insulin Gene That Affect Pre-mRNA Splicing: Is -23HphI a Functional Single Nucleotide Polymorphism at IDDM2? Diabetes 55:260-4
33. Ahmed S, Bennett ST, Huxtable SJ, Todd JA, Matthews DR, Gough SC 1999
INS VNTR allelic variation and dynamic insulin secretion in healthy adult non-diabetic Caucasian subjects. Diabet Med 16:910-917
34. Huxtable SJ, Saker PJ, Haddad L, Walker M, Frayling TM, Levy JC, Hitman GA, O'Rahilly S, Hattersley AT, McCarthy MI 2000 Analysis of parent-offspring
trios provides evidence for linkage and association between the insulin gene and type 2 diabetes mediated exclusively through paternally transmitted class III variable number tandem repeat alleles. Diabetes 49:126-130
35. Mitchell SM, Hattersley AT, Knight B, Turner T, Metcalf BS, Voss LD, Davies D, McCarthy A, Wilkin TJ, Smith GD, Ben-Shlomo Y, Frayling TM 2004 Lack
of support for a role of the insulin gene variable number of tandem repeats minisatellite (INS-VNTR) locus in fetal growth or type 2 diabetes-related
intermediate traits in United Kingdom populations. J Clin Endocrinol Metab 89:310-7