*Corresponding author: Franziska Baensch, ETH Zurich – Institute for Building Materials, Stefano-Franscini-Platz 3 CH-8093 Zürich, Zürich CH-8093, Switzerland, e-mail: [email protected]; and Eberswalde University for Sustainable Development – Wood Science and Technology, Eberswalde, Germany
Michaela Zauner, Sergio J. Sanabria and Peter Niemz: ETH Zurich – Institute for Building Materials, Zürich, CH-8093, Switzerland Markus G.R. Sause: Institute for Physics, Experimental Physics II – University of Augsburg, Augsburg, D-86135, Germany
Bernd R. Pinzer: Paul Scherrer Institute – SLS Tomcat, Villigen PSI, CH-5232, Switzerland
Andreas J. Brunner: Empa, Swiss Federal Laboratories for Materials Science and Technology – Faculty for Mechanical Engineering, Dübendorf, CH-8600, Switzerland
Marco Stampanoni: Paul Scherrer Institute - SLS Tomcat, Villigen PSI, CH-5232, Switzerland
Franziska Baensch*, Michaela Zauner, Sergio J. Sanabria, Markus G.R. Sause,
Bernd R. Pinzer, Andreas J. Brunner, Marco Stampanoni and Peter Niemz
Damage evolution in wood: synchrotron radiation
micro-computed tomography (SRμCT) as a
complementary tool for interpreting acoustic
emission (AE) behavior
Abstract: Tensile tests of miniature spruce wood
speci-mens have been performed to investigate the damage evo-lution in wood at the microscopic scale. For this purpose, the samples were stepwise tensile loaded in the longitu-dinal (L) and radial (R) directions and the damage evolu-tion was monitored in real-time by acoustic emission (AE) and synchrotron radiation micro-computed tomography (SRμCT). This combination is of outstanding benefit as SRμCT monitoring provides an insight on the crack evolu-tion and the final fracture at microscopic scale, whereas AE permits the detection of the associated accumulation and interaction of single damage events on all length scales with high time resolution. A significant drawback of the AE testing of wood has been overcome by means of calibrating the AE amplitudes with the underlying crack length development. Thus, a setup-dependent and wood species-dependent calibration value was estimated, which associates 1 μm2 crack area generating of 0.0038 mV
in the detected AE amplitude. Furthermore, for both L and R specimens, AE signals were classified into two clusters by using a frequency-based approach of unsupervised pattern recognition. The shares of AE signals of both clus-ters correlate with the ratio of the relative crack area of
the interwall and transwall cracks gained from the fracto-graphic analysis of SRμCT scans.
Keywords: acoustic emission (AE), damage evolution,
in situ monitoring, spruce, synchrotron radiation
micro-computed tomography (SRμCT), tensile test, unsuper-vised pattern recognition (UPR)
DOI 10.1515/hf-2014-0152
Received May 20, 2014; accepted December 4, 2014; previously published online February 6, 2015
Introduction
The observation of the complex hierarchical interdepend-ency of damage phenomena within the wooden structure is a key challenge (Frühmann et al. 2003; Saavedra Flores and Friswell 2013). For an improved understanding of the failure behavior, the acoustic emission (AE) measurement is a useful tool that enables a multiscale analysis of the damage progress with respect to load history in the whole specimen’s volume. An additional advantage of the AE method is the high time resolution during the recording of defect generation. However, the interpretation of AE data is difficult concerning the signal’s origin. In a previous study (Baensch et al. 2015), a new unsupervised pattern recognition (UPR) technique based on AE frequency fea-tures was adopted for wood. This algorithm, which had already been established for composite materials (Sause et al. 2012a,b), seeks for the numerically best partition of selected frequency features to identify the natural classes of AE signals.
A substantial and detailed interpretation of these AE clusters requires additional information. For this purpose,
in situ X-ray tomography is suitable, as it allows a
compre-hensive 3D observation of microstructures (Cazaux et al. 1993; Stampanoni et al. 2006). Further, the feasibility of
real-time studies on submacroscopic damage mechanisms by combining synchronous AE and tomographic monitor-ing has already been proven for several materials (Chotard et al. 2003; Elaqra et al. 2007), whereby an effective pixel length down to 15 μm was reached. Another study was per-formed on metals yielding a spatial resolution of even 1.4 μm3 (Maire et al. 2007). For the investigation of the
anatom-ical features of the wooden microstructure, the suitability of micro-computed tomography proves to be satisfactory, because a spatial resolution down to 1 μm3 is feasible
(Steppe et al. 2004; Trtik et al. 2007; Van den Bulcke et al. 2009). The microstructure of wood under different mois-ture loads has also been investigated by synchrotron radia-tion micro-computed tomography (SRμCT) (Derome et al. 2011). Moreover, for a miniature wood specimen under bending load, Forsberg et al. (2008) showed the potential of the SRμCT method to evaluate the deformation at micro-scale by means of digital volume correlation.
In the present study, tensile tests of miniature spruce wood specimens will be performed to investigate the damage evolution in wood at the microscopic scale, which should be simultaneously monitored by AE and SRμCT. The expectation is that the SRμCT results will provide complementary evidence for interpreting AE signal clus-ters already presented in a previous study by Baensch et al. (2015).
Materials and methods
The investigations were carried out on approximately 250-year-old clear spruce wood [Picea abies (L.) Karst.] grown at 1000 m altitude in the canton of Grisons (Switzerland). The specimens were taken from the same wood stock whose mechanical properties were already described by Sonderegger et al. (2008) and Baensch et al. (2015).
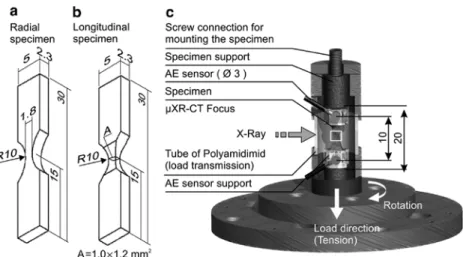
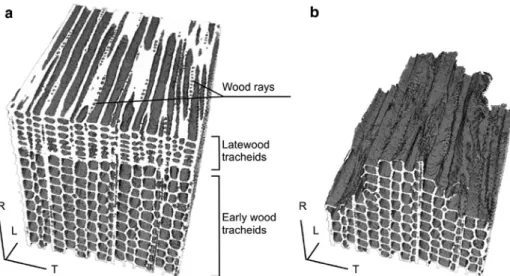
Two specimens differing in fiber-load-angle were in focus. The radial (R) specimen was loaded in the R direction, and the longitu-dinal (L) specimen was loaded parallel to the grain (Figure 1a and b), whereby an L specimen was selected that only contained earlywood within the tested cross-section. The specimens were manufactured from blanks with dimensions of 30 × 5.7 × 2.3 mm3 (length × width × thick-ness). To ensure a defined crack initiation within the volume of inter-est (VOI), which can be monitored by both AE and SRμCT (Figure 1c), the specimens were tapered. The L specimen was taper shaped at all four sides, yielding a test cross-section of 1 mm2 (Figure 1b), whereas the R specimen had only a two-sided taper of approximately 4 mm2 test cross-section (Figure 1a), which could not be reduced further due to the fragile structure. The specimen geometry is in accordance with that tested by Baensch et al. (2015).
The SRμCT trials were carried out at the TOMCAT beam line, a synchrotron beamline at the Paul Scherrer Institute in Villigen, Swit-zerland (Stampanoni et al. 2007). The tensile tests were performed with a loading device (load cell of 1 kN) for miniature specimens designed for implementation at the synchrotron beam line (Zauner et al. 2012). The R specimen was loaded with a cross-head speed of 0.005 mm s-1 and the L specimen was loaded with 0.01 mm s-1 (Table 1). For load transmission, a plug system of three tubes was put over the specimen and fixed by a thread washer at the upper end (Figure 1c). This three-pieced plug system was needed to facilitate the mounting of AE sensors. The center tube was made of polyamide-imide (PAI 4203, Fa. Quadrant EPP Deutschland GmbH, Sinsheim, Germany). The duroplast PAI (165 MPa compression strength) was suitable for the SRμCT monitoring of load tests on wood specimens because of its low absorption of the radiation.
To enhance the contrast of the X-ray images, a propagation-based phase-contrast reconstruction algorithm was applied ( Paganin et al. 2002). The details on the SRμCT monitoring parameters are pre-sented in Table 2. The resolution was changed for both specimen types, allowing a field of view large enough to monitor the total VOI of the taper shape. Thus, for the L specimen, a digital resolution of 0.65 μm px-1 could be realized, whereas, in the case of the R specimen, a lower digital resolution of 1.62 μm px-1 was reached.
AE monitoring was performed with an digital AE equipment (AMSY-6, Vallen Systeme GmbH, Icking, Germany). Two miniature piezoelectric sensors type M31 (Fuji Ceramics Corp. Shizuoka, Japan) with a coupling area of 3 mm diameter were mounted single sided
USA) were mounted onto the testing device and on the mounting table at the beam line.
For AE analysis, only the first signal of an AE event detected by both sensors (maximum distance of 10 mm) was evaluated by means of 1D localization (Kurz et al. 2008). AE signals were windowed with a Hamming window function (Table 3), and the selected frequency features were extracted from the frequency spectra. For the UPR algo-rithm, nine features in total (Table 4) were chosen as input, namely, the peak frequency (PF), the center of gravity frequency (CGF), weighted peak frequency (WPF), and six partial power (PP) levels (Sause et al. 2012a).
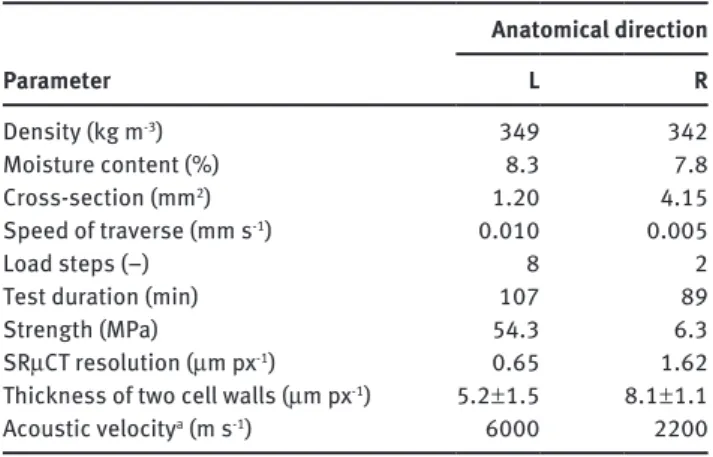
Before each test, the specimens were preloaded to < 20% of the ultimate stress and an initial SRμCT of the intact structure was recorded. The tensile tests were performed stepwise by stopping the traverse at predetermined positions, which were preliminarily defined with respect to the predicted AE occurrence. Specifically, in pre-tests (Baensch et al. 2015), the AE onset was evaluated by means of the applied traverse displacement. Before and after each load step, the quality of the AE sensor coupling was checked by autocalibration (in the course of which, each sensor served subsequently as an emit-ter and a sensor). When the displacement ceased, the load imme-diately decreased, indicating the relaxation processes of the wood. To minimize the risk of recording artifacts (structural movement) within the tomograms due to relaxation, an idle time of 1–2 min was allowed before starting the SRμCT scan, which was also monitored by AE. However, performing the SRμCT scan might have a destruc-tive impact on the tiny, wooden test cross-section due to relaxation processes during the time the traverse is arrested. For this reason, only selected SRμCT scans were performed. Thus, the tests imply a Table 1 Characterization of the investigated spruce wood
specimens. Parameter Anatomical direction L R Density (kg m-3) 349 342 Moisture content (%) 8.3 7.8 Cross-section (mm2) 1.20 4.15 Speed of traverse (mm s-1) 0.010 0.005 Load steps (–) 8 2
Test duration (min) 107 89
Strength (MPa) 54.3 6.3
SRμCT resolution (μm px-1) 0.65 1.62 Thickness of two cell walls (μm px-1) 5.2 ± 1.5 8.1 ± 1.1 Acoustic velocitya (m s-1) 6000 2200 aSonderegger et al. (2008).
Table 2 Acquisition settings for SRμCT monitoring.
Energy of radiation 20 keV
Mode Phase contrast
Scintigram size; CCD camera 2048 × 2048 px
Rotation 180° in 0.12° steps
Projections 1501
Dark field projections 32
White field projections 150
Recording time of one scan 6 min
Monitoring L specimens (UPLAPO10x)a
Field of view, digital resolution 1.43 × 1.43 mm2, 0.65 μm px-1 Monitoring R specimen (UPLAPO4x)a
Field of view, digital resolution 3.58 × 3.58 mm2, 1.62 × m px-1 aObjectives.
Table 3 Acquisition of AE waveform detection and settings of frequency spectra calculation.
Threshold setting 32.1 dBAE (≈0.04 mV)
Rearm time 1 ms
Sampling rate 10 MHz
Signal duration 409.6 μs, 18 μs pre-trigger included Signal evaluation First signal of AE event; 1D localization FFT of waveform
Extraction window
in time domain 0–25.6 μs (18 μs pre-trigger excluded)First 256 samples of the waveform Window function Hamming window of 256 samples
Frequency spectra 0–1200 kHz
Table 4 AE frequency features used to perform the UPR.
Feature Abbreviation Definition
Amplitude (mV) A Measured AE amplitude (mV)
Peak frequency PF Frequency of maximum magnitude in frequency spectrum Center of gravity frequency CGF
∫
⋅∫
( ) ( ) f U f df U f dfWeighted peak frequency WPF f fPF CGF⋅
Partial power PP
∫
∫
2 1 end start 2 2 ( ) ( ) f f f f U f df U f df PP1: 0–200 kHz, PP2: 200–400 kHz, PP3: 400–600 kHz, PP4: 600–800 kHz, PP5: 800–1000 kHz, PP6: 1000–1200 kHz on the surface of the specimen (Figure 1c). The sensor coupling wasachieved by silicone-free vacuum grease (Pöllath J.P. Labortechnik, Bamberg, Germany). AE sensors were sensitive to the frequency range of 300–800 kHz. The frequency range of the preamplifi-ers (AEP3, gain of 34 dB into 50 Ω, Vallen Systeme GmbH, Icking, Germany) was limited to the range from 30 to 960 kHz. Moreover, guard sensors (SE 150-M, Dunegan Engineering Co., Inc. Midland,
Figure 2 Clustering of AE signals yields the two clusters A (filled symbols) and B (unfilled symbols).
PP4 versus WPF (Table 4) are presented for AE signals detected during tensile tests on spruce specimens loaded in the (a) L and (b) R directions. The reproducibility of the clusters is demonstrated by comparing the seven pre-trial results in the laboratory (gray squares) with the specimens tested at the SRμCT beamline (black circles).
share of high-frequency components, which is character-ized by an average WPF of approximately 575 kHz. A first working hypothesis to explain this AE behavior assumed that the A clusters indicated slow crack growths (e.g., cell separation mechanisms), whereas the B clusters signi-fied brittle crack growths due to cell wall cracks (Baensch et al. 2015).
L specimen
During four test stages (I–IV), a total of eight load steps were applied to the L specimen until its ultimate failure (Figure 3). AE and SRμCT monitoring gained complete data sets for the test stages I to III (Figure 3a–c), whereas an SRμCT scan of the fractured specimen after the last test stage IV (Figure 3d) yielded insufficient quality for reconstruction on account of the artifacts that dis-torted the tomograms due to the movement of the speci-mens. The cuboid in Figure 4a represents the volume (650 × 650 × 650 μm3) including all damages detected by
SRμCT until the test stage III. In total, the observed cracks affected approximately 140 tracheids, which is equiva-lent to 10% of the tracheids within the entire VOI of the specimen.
During the first load step (Figure 3a), only AE events of cluster BL were generated. However, in light of the pre-investigations consistent with the current results (Baensch et al. 2015), the cluster type matching the AE onset is rather random. In the test stage II (Figure 3b), the traverse was displaced four times to yield a sufficient stress application for AE generation. Because no AE was detected during the first three steps, an SRμCT scan was not performed. However, AE was detected during relaxa-tion after the fourth traverse displacement in the test stage II, whereby cluster BL already yielded AE amplitudes more than 3 mV (Table 5). During the test stage III (sixth load step) and the subsequent relaxation (Figure 3c), cluster BL yielded the maximum AE amplitude of 8.4 mV for the whole test, whereas cluster AL only generated AE ampli-tudes < 4.1 mV (Table 5). During the last two load steps in the test stage IV (Figure 3d; Table 5, steps 7 and 8), the intention was to increase the load application until the ultimate failure of the L specimen was achieved. For this reason, an SRμCT scan was omitted after the seventh load step. For both load steps 7 and 8, the generated AE showed a high number of signals in both clusters with a wide range of AE amplitudes.
Although no cracks were observed after the first load step (I), the reconstructions after reloading the specimen (II) revealed significant damages (Figure 5). As the crack
sequence of test stages comprising one or more loading steps, which are completed by one SRμCT scan. The tests were continued up to the ultimate failure of the specimens. AE and SRμCT data were synchro-nized by the load signal output of the testing device.
Results and discussion
UPR
For each specimen, the UPR technique yielded the numerically best separation of the detected AE into two clusters (Figure 2). These clusters (Figure 2, black circles) are in good agreement with those from the pre-investi-gation (without SRμCT) by Baensch et al. (2015) (Figure 2, gray squares); thus, the validity of the tests is proven. One cluster (A) comprises AE events of a relatively high share of low-frequency components, expressed by an average WPF of approximately 350 kHz. In contrast, the other cluster (B) contains AE events of a relatively high
is only visible in the surrounding cell wall, 3D volume subsets visualize the cell walls rather than single slice images. Thus, with respect to the average tracheid dimen-sions in the radial-tangential (RT) plane, the selected volume (Figure 4a) was cut along the R direction into
15 sections of 50 px thickness (32.5 μm) corresponding to the white lines marked in the RT plane in Figure 4b. Addi-tionally, this subdivision into 15 sections was repeated along the tangential (T) direction. The diameter of one tra-cheid (27 ± 3.7 μm) is smaller than the section’s thickness
Figure 3 Tensile test on the L specimen: (a) test stage I, (b) test stage II, (c) test stage III, and (d) test stage IV with the ultimate failure (load step 8).
Stress and AE signal amplitude vs. test duration. The two AE signal clusters AL and BL are separated in the plots.
Figure 4
(a) Initial state of the L tested specimen. This cubic section includes the state of crack after the load steps 1–3. Dimensions:
650 × 650 × 650 μm3. Resolution of the reconstruction: 1 px = 0.65 μm. Sections A and B are shown in detail in Figure 5. (b) For the crack length measurements, the cube is cut into 15 sections of 50 px thickness in the R direction. (c) Crack length cT is measured along the cell walls in the LT plane for each of these 15 sections. Analogously, the crack length (cR) is determined. Based on both measurements, the average crack length c is estimated.
(32.5 μm); therefore, the focus was only on one bound-ary containing cell walls of the two connected tracheids within the sections.
For sections A and B (Figure 4a), the initial state and the states of the crack after test stages II and III are pre-sented in Figure 5. After the test stage II, the LT plane in section A already shows cracks crossing the tracheid cell wall boundaries (Figure 5a), which indicates transwall cracks as well as cracks within the middle lamella. The
identified crack tip (Figure 5a, detail a) propagated further in the test stage III with larger and stepped displacements (Figure 5a, detail c) in the L direction. Moreover, the crack path avoids passing through the wood rays. The LR plane in section B (Figure 5b) shows no damage in the test stage II, whereas the crack path in stage III (Figure 5b, details b and c) also switches its propagation along the L direc-tion. Hence, it seems that interwall cracks are of more relevance during the test stage III than in the earlier
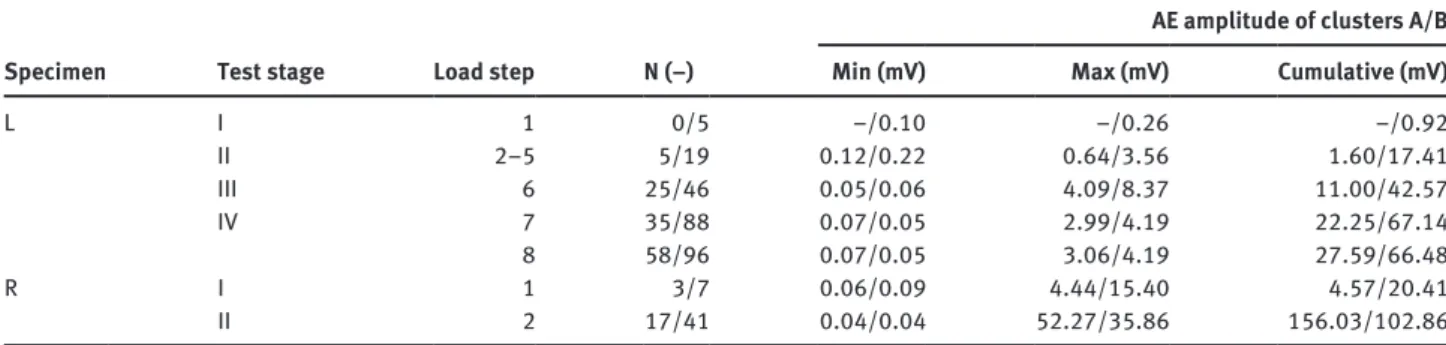
Table 5 AE parameters of the loading steps for the L and R specimens.
Specimen Test stage Load step N (–)
AE amplitude of clusters A/B
Min (mV) Max (mV) Cumulative (mV)
L I 1 0/5 –/0.10 –/0.26 –/0.92 II 2–5 5/19 0.12/0.22 0.64/3.56 1.60/17.41 III 6 25/46 0.05/0.06 4.09/8.37 11.00/42.57 IV 7 35/88 0.07/0.05 2.99/4.19 22.25/67.14 8 58/96 0.07/0.05 3.06/4.19 27.59/66.48 R I 1 3/7 0.06/0.09 4.44/15.40 4.57/20.41 II 2 17/41 0.04/0.04 52.27/35.86 156.03/102.86
N, number of AE events of the clusters A/B.
Figure 5 Crack growths through the microscopic structure of the L stressed specimen.
The cube represents the part of the specimen involving the whole crack evolution detected after load steps 2 and 3. (a) In section A, the crack growth is tracked in the LT plane. (b) In section B, the crack growth is tracked in the LR plane. The dimensions of sections A and B are 650 × 650 × 32.5 μm3.
cumulative AE amplitude is found to behave proportion-ally to the area of the crack (Lysak 1996). Based on this, a scale factor b was approximated by the ratio of the cumu-lative amplitude A (73.5 mV) to the averaged crack area S (19 547 μm2) at the test stage III [Equation (2)].
2 A mV b 0.0038 S m ∑ = = ∑ µ (2)
However, the amplitude of AE events is setup dependent; therefore, SRμCT is required to calibrate the coefficient b for crack size measurements. For the tests presented here, a crack area of 1 μm2 is associated to approximately
0.0038 mV in the detected AE amplitude [Equation (2)]. This correlation allows an estimation of the length scale of the damage events detected in AE. Consequently, the threshold setting of 0.04 mV might enable detecting damage events that are too small for observation within the tomograms. The correlating crack area of approxi-mately 10.5 μm2 (whereas the averaged double cell wall
thickness is 5.2 μm) implies a crack length of 2 μm, which falls beyond the effective resolution of the SRμCT measure-ments. The same applies for the maximum AE amplitude measured during the first load step (Table 6, I). During the ultimate failure, the maximum AE amplitude of 8.4 mV was generated in cluster BL (Table 5), whereby the result-ing crack length c of approximately 424 μm consistently correlates with half the edge length of the specimen’s test cross-sections (Table 1).
Nevertheless, the correlation value of 0.0038 mV μm-2
has to be treated with caution, as it assumes homogeneous material properties. Thus, a differentiation of the cracking components is lacking, although their Young’s modulus has a main impact on the measured AE amplitude (Scruby 1985). For instance, the Young’s modulus of lignin in the middle lamellae (3 GPa; Cousin 1978) is smaller by a factor of about 10 than that of the cell wall (25 GPa; Eder et al. 2009), and this is the reason why cracks in the middle lamellae of 1 μm2 should yield AE amplitudes lower than
0.0038 mV. A direct and unambiguous correlation is not feasible between the cumulative AE amplitudes generated by each cluster and the attributed crack types because the crack’s origin cell wall layers are difficult to track within the SRμCT reconstructions.
R specimen
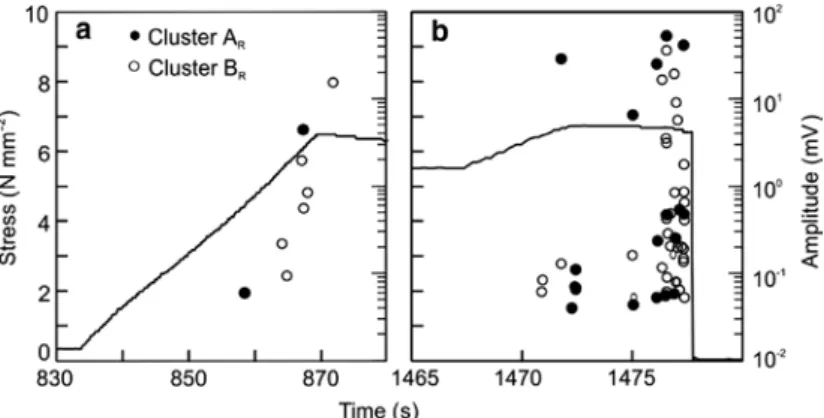
The R specimen was tested in two test stages. During the first load step (Figure 6a), 10 AE events were recorded, which already revealed a significant range of AE signal amplitudes (0.06–15.4 mV; Table 5). However, no structural stage. This additionally coincides with the ratio of the
signal numbers attributed to clusters AL and BL, changing from 5:19 after the test stage II to 25:46 after the stage III (Table 5).
The crack at three different stages (I–III) was recorded by both AE and SRμCT, and a calibration between the results of both methods was attempted. For this purpose, the AE amplitude was taken as a measure of damage mag-nitude. This approach is probably closest to the amplitude of the elastic wave that is proportional to the newly formed crack area (Radon and Pollock 1972; Lysak 1996; Sause 2010). Thus, the crack area (square micrometer of cell wall matter) and the corresponding cumulative AE amplitudes after each test stage II and III were compared (Table 6). The crack length in both states was measured within the 15 SRμCT sections along the R direction as well as along the T direction (Figure 4c). The crack length is measured within the tracheid cell wall volume containing both cell walls of two adjacent tracheids. The average crack length c was estimated from the measured crack length, once in the R direction cR and a second time in the T direction cT (Figure 4c) for the stages II and III (Table 6). For the L spec-imen, the averaged double cell wall thickness tCW is of 5.2 μm (Table 1). Hence, the averaged crack area S (Table 6) is calculated based on the averaged crack length c and on the double cell wall thickness tCW [Equation (1)].
CW m S 0.65 c( px) t ( m) px µ = × × µ (1)
The crack size in the ultimate failed state is unknown; thus, the crack area after the test stage III (19 547 μm2)
is defined as 100% (Table 6, III). The corresponding AE amplitude of 73.5 mV cumulated for stages I to III is equally defined as 100%. With respect to the crack size at the test stage III, the crack area measured after the test stage II is 30% (Table 6). Although no damages were found within the sample reconstruction of the SRμCT scan after the test stage I (possibly due to relaxation and crack closing processes), the AE detected there indicates initial pre-damages of the later crack. As a result, the AE ampli-tudes of the test stages I and II are summed up, also yield-ing 30% of the total cumulative AE amplitude. By this, the
Table 6 Correlation between crack growth c and cumulative AE amplitudes A for the L specimen.
State cR (px) cT (px) c (px) S (μm2) ΣA (mV) Correlation (%)
I 0 0 0 0 0.92 =30
II 1470 2088 1780 6016 19.02
changes and damages were observed within the corre-sponding SRμCT scan. The second loading reached the maximum stress of 6.7 MPa, whereas the ultimate failure of the R specimen occurred during the subsequent relaxa-tion process, a few seconds after the traverse had been stopped (Figure 6b). During the ultimate failure, AE events of both AR and BR clusters yielded amplitudes above 10 mV (Table 5). The damage analysis is supported only by the SRμCT scan of the failed state; thus, the whole fracture surface was analyzed (i.e., particularly the broken speci-men’s bottom half). The obtained results are exemplarily presented by means of the selected detail C (Figure 7). Detail C has dimensions of 650 × 650 × 650 μm3 and thus
represents 10% of the total fracture zone, which is located within the earlywood zone, clearly identifiable by com-paring the initial state (Figure 8a) and the failed state (Figure 8b). A fractographic analysis of the fracture zone differentiates between transwall cracks and the peeling of
Figure 6 Tensile test of the R specimen: (a) test stage I and (b) test stage II, including the ultimate failure. Stress and AE signal amplitude vs. test duration. The two AE signal clusters AR and BR are distinguished.
Figure 7 Dimension of the fracture zone of the spruce wood speci-men tensile loaded in the R direction is represented by the black cube.
The back side of the cube shows the fracture path through the RT plane. Exemplarily, the results are presented for the selected detail C. The position and dimension (650 × 650 × 650 μm3) are represented by the smaller gray cube. Resolution of the reconstruction from SRμCT monitoring: 1 px = 1.62 μm.
the tracheids by interwall cracks within the middle lamel-lae or possibly by intrawall cracks within the primary cell wall (cell separation phenomena). The procedure from this analysis performed for the whole fracture zone is demonstrated by detail C in Figure 9a.
To provide a quantitative assessment of the contri-bution ratio of both fracture types, the fracture surface was subdivided into units. Each of these units is limited in size to one tracheid in the T direction and 80 μm (50 px) in the L direction; see the definition in Figure 9a. A projection map of the damaged surface in the LT plane was obtained, which indicates the relative positions of tracheids and wood rays and further distinguishes the units characterized by transwall cracks or cell separa-tion (Figure 9a). Approximately 70% of the total fracture surface shows cell wall cracks. Overall, 100 wood rays and 50 tracheids are affected, and each of the tracheids shows both damage types. This observation is in agree-ment with the study by Ashby et al. (1985), who pre-dicted the occurrence of both cell wall cracks and cell separation phenomena for a ratio of the raw density to the cell wall density (1500 kg m-3) beyond 0.2, as is the
case for the spruce wood tested here. The impact of the wood rays’ mechanical performance on the crack forma-tion through the walls of the adjacent tracheids becomes obvious, because all parts of those tracheids that com-pletely enclose one wood ray show a similar damage type (Figure 9a). For an improved visualization of this linkage in the fracture formation (Figure 9b), the intact wood rays were segmented from the reconstruction of the initial state (black) and finally were superimposed onto the reconstruction of the failed state (gray). For the section in Figure 9b, the failure within the earlywood implies three wood rays a to c. The failure in the vicinity of both wood rays a and b occurred close to the latewood zone, and they are assumed to have induced strong reinforcing
effects on the adjacent earlywood tissue. In contrast, the weak point of the wood ray c was located deeper inside the earlywood zone. The failure of that wood ray induced a pullout mechanism, yielding a complex tensile shear fracture of the adjacent tracheids in the first row and even in the second row (Figure 9b, tracheids 9 and 10). The mechanical performance of wood rays and their position
relative to each other affect the magnitude of the damage events (Reiterer et al. 2002) and therefore influence the AE amplitude during loading the tissue in R direction.
The scale factor b [Equation (2)] was applied to AE signals detected during the first load application of the R specimen, for which a maximum AE amplitude of 15 mV (≈3950 μm2) was monitored, whereas the damage was Figure 8 Spruce wood specimen tensile stressed in the R direction.
Detail C (650 × 650 × 650 μm3) at initial state (a) and failed state (b).
Figure 9 Fractographic analysis.
(a) Fracture surface of detail C presented as a 2D projection pattern (LT plane). For the fractographic analysis, the surface is divided into units. In the L direction, the length of one unit is 50 px (∼80 μm); in the T direction, the size of one unit is due to one tracheid. Cell wall cracks and cell separation are differentiated in the TL plane. In the RL plane, the complex shear fractures include 29 units of cell wall cracks and 4 units of cell separation. (b) Section of the fracture zone from the detail C (L axis: 1050–1100 px). For the visualization of the wood rays’ influence on damage development, the intact wood rays segmented at the initial state (dark colored) are superimposed on the reconstruc-tion of the ultimate failure (gray). For orientareconstruc-tion, the latewood zone is highlighted. Wood rays a and b failed close to the latewood zone. The weak point of wood ray c, located deeper within the earlywood zone, led to tensile shear failure in RL plane.
not detected in the SRμCT scans. Taking into account the double cell wall thickness of 8 μm (Table 1), the correlated averaged crack length c [Equation (2)] of approximately 490 μm (≈305 px; resolution of 1.62 μm px-1) is physically
possible, particularly because this AE event of cluster BR is assumed to be cell wall damage. If the crack would not have affected the cell wall of two adjacent tracheids and would occur only within the cell wall of one single tracheid, it would not be detectable within the SRμCT scan. Another explanation could be the possibility that the crack closes during the relaxation process before the SRμCT scan is performed. The ultimate failure generated maximum AE amplitudes of 36 mV in cluster BR (Table 5), correlating with an averaged crack length c of approxi-mately 1180 μm, which is more or less half the edge length of the specimen’s test cross-section (Figure 1a; Table 1).
Moreover, a correlation between fiber breakage and the number of detected AE events can be assumed, which is also usually the case in composite materials (Harris et al. 1972). Based on this, the ratio of the relative crack area of the cell wall crack (67%) and cell separation (33%) estimated from SRμCT also might be reflected by the rela-tive number of detected AE events due to cluster BR (70%) and cluster AR (30%) (Table 5).
Conclusion
Tensile tests on miniature spruce specimens, R and L loaded under tension, were monitored by AE and simul-taneously by SRμCT. This combination is very useful because the SRμCT monitoring provides insight on the microscopic structure of tested specimens under initial, crack evolution, and final fracture development. AE is a supplementary data source, which makes possible to detect the associated crack formation and propagation in the spatial domain, which results from the accumulation and interaction of single damage events.
The 3D SRμCT monitoring yields the following main observations at the microscopic level: the crack path usually avoids crossing wood rays, which are the weak points within the wood structure when loading in the L direction. For tensile loading in the R direction, the main impact of the reinforcing wood rays on the fracture pattern shows similar damage types observed for those tracheids that completely enclose one wood ray. Each single trac-heid within the fracture zone shows both transwall and interwall cracks.
An approximate correlation between the crack size from SRμCT scan and the crack formation detected by AE was obtained: a crack area of 1 μm2 was associated to
approximately 0.0038 mV in the detected setup-dependent and wood species-dependent AE amplitude. Depending on the threshold setting of 0.04 mV, the AE method turned out to be sensitive to minimum defect sizes of 10.5 μm2,
which scales with the tracheid cell wall’s thickness. Two clusters were determined by means of the fre-quency-based UPR approach. This supports the previ-ously outlined hypothesis that the low-frequency cluster A is assignable to interwall cracks and the high-frequency cluster B to cell wall cracks in the tracheids. For the L specimen, the increasing share of AE events due to the cluster AL seems to correlate with more pronounced crack propagation switching parallel to the grain. For the R specimen, the shares of AE events of both clusters AR and BR (30%/70%) correlate with the ratio of the relative crack area of the cell wall crack (67%) and cell separation (33%) estimated from the fractographic analysis.
Further insights may be afforded by performing a 3D morphological analysis of SRμCT scans for the evaluation of the deformation at the individual cell scale for the dif-ferent load states as well as by simulating the AE waves’ origin from the damage process and their propagation in the wood materials.
Acknowledgments: The authors acknowledge the
finan-cial support of the Swiss National Science Foundation under grant SNF-Project 127134. The authors want to thank the staff of the TOMCAT beamline at SLS in Villi-gen. Further thanks go to the colleges at the ETH Zürich: S. Ammann, S. Clauss, M.W. Felux, D. Fernandez, P. Hass, O. Kläusler, K. Kránitz, C. Lanvermann, F. Michel, T. Ozy-har, S. Schlegel and F. Wittel for assistance during the measurements and analysis. P. Jenni is acknowledged for manufacturing and assembling the experimental equip-ment. Thanks to T. Schnider for the help with specimen preparation. Finally, the authors warmly thank Quadrant EPP GmbH for providing the Duratron PAI material.
References
Ashby, M.F., Easterling, K.E., Harrysson R., Maiti, S.K. (1985) The frac-ture and toughness of woods. Proc. R. Soc. Lond. A 261–280. Baensch, F., Sause, M.G.R., Brunner, A.J., Niemz, P. (2015)
Damage evolution in wood – pattern recognition based on acoustic emission frequency spectra. Holzforschung 69:357–365.
Cazaux, J., Erre, D., Mouze, D., Patat, J.M., Rondot, S., Sasov, A., Trebbia, P., Zolfaghari, A. (1993) Recent developments in X-ray projection microscopy and X-ray microtomography applied to materials science. J. Phys. III 3:2099–2105.
Chotard, T.J., Smith, A., Bonceur, M.P. Fargeot, D., Gault, C. (2003) Characterisation of early stage calcium aluminate cement
hydration by combination of non-destructive techniques: acoustic emission and X-ray tomography. J. Eur. Ceram. Soc. 23:2211–2223.
Cousin, W.J. (1978) Young’s modulus of hemicellulose as related to moisture content. Wood Sci. Technol. 12:161–167.
Derome, D., Griffa, M., Koebel, M., Carmeliet, J. (2011) Hysteretic swelling of wood at cellular scale probed by phase-contrast X-ray tomography. J. Struct. Biol. 173:180–190.
Eder, M., Jungnikl, K., Burgert, I. (2009) A close-up view of wood structure and properties across a growth ring of Norway spruce (Picea abies [L] Karst.). Trees Struct. Funct. 23:79–84.
Elaqra, H., Godin, N., Peix, G., R’Mili, M.R., Fantozzi, G. (2007) Dam-age evolution analysis in mortar, during compressive loading using acoustic emission and X-ray tomography: effects of the sand/cement ratio. Cem. Concr. Res. 37:703–713.
Frühmann, K., Burgert, I., Stanzl-Tschegg, S.E. (2003) Detection of the fracture path under tensile loads through in situ tests in an ESEM chamber. Holzforschung 57:326–332.
Forsberg, F., Mooser, R., Arnold, M., Hack, E., Wyss, P. (2008) 3D micro-scale deformations of wood in bending: synchrotron radiation μCT data analyzed with digital volume correlation. J. Struct. Biol. 164:255–262.
Harris, D.O., Tetelman, A.S., Darwish, F.A. (1972) Detection of fiber cracking by acoustic emission. ASTM STP 505:238–249. Kurz, J.H., Köppel, S., Linzer, L., Schechinger, B., Grosse, C. (2008)
Source localization. In: Acoustic Emission Testing in Engineer-ing – Basics and Applications. Eds. Grosse, C., Ohtsu, M. Springer-Verlag, Heidelberg. pp. 108–109.
Lysak, M.V. (1996) Development of the theory of acoustic emission by propagating cracks in terms of fracture mechanics. Eng. Fract. Mech. 55:443–452.
Maire, E., Carmona, V., Courbon, J., Ludwig, W. (2007) Fast X-ray tomography and acoustic emission study of damage in metals during continuous tensile tests. Acta Mater. 55:6806–6815. Paganin, D., Mayo, S.C., Gureyev, T.E., Miller, P.R., Wilkins, S.W. (2002) Simultaneous phase and amplitude extraction from a single defocused image of a homogeneous object. J. Microsc. 206:33–40.
Radon, J.C., Pollock, A.A. (1972) Acoustic emission and energy transfer during crack propagation. Eng. Fract. Mech. 4: 295–310. Reiterer, A., Burgert, I., Sinn, G., Tschegg, S. (2002) The radial
reinforcement of the wood structure and its implication on mechanical and fracture mechanical properties – a comparison between two tree species. J. Mater. Sci. 37:935–940.
Saavedra Flores, E.I., Friswell, M.I. (2013) Ultrastructural mecha-nisms of deformation and failure in wood under tension. Int. J. Solids Struct. 50:2050–2060.
Sause, M.G.R. (2010) Identification of Failure Mechanisms in Hybrid Materials Utilizing Pattern Recognition Techniques Applied to Acoustic Emission Signals. Dissertation. ISBN: 978-3-86664-889-0. mbv-Verlag, Berlin, pp. 305.
Sause, M.G.R., Gribov, A., Unwin, A.R., Horn, S. (2012a) Pattern recognition approach to identify natural clusters of acoustic emission signals. Pattern Recog. Lett. 33:17–23.
Sause, M.G.R., Müller, T., Horoschenkoff, A., Horn, S. (2012b) Quantification of failure mechanisms in mode-I loading of fiber reinforced plastics utilizing acoustic emission analysis. Compos. Sci. Technol. 72:167–174.
Scruby, C.B. (1985) Quantitative acoustic emission technique. Non-destr. Test. 8:158–159.
Sonderegger, W., Alter, P., Niemz, P. (2008) Investigations on selected properties of tonal wood of spruce from Grisons. Holz Roh Werkst. 66:345–354.
Stampanoni, M., Groso, A., Isenegger, A., Mikuljan, G., Chen, Q., Bertrand, A., Henein, S., Betemps, R., Frommherz, U., Böhler, P., Meister, D., Lange, M., Abela, R. (2006) Trends in synchrotron-based tomographic imaging: the SLS experience. Proc. SPIE 6318:M1–M14.
Stampanoni, M., Groso, A., Isenegger, A., Mikuljan, G., Chen, Q., Meister, D., Lange, M., Betemps, R., Henein, S., Abela, R. (2007) TOMCAT: a beamline for tomographic microscopy and coherent radiology experiments. Synchroton Radiat. Instrum. 879:848–851.
Steppe, K., Cnudde, V., Girard, C., Lemeur, R., Cnudde, J.-P., Jacobs, P. (2004) Use of X-ray computed microtomography for non-invasive determination of wood anatomical characteris-tics. J. Struct. Biol. 148:11–21.
Trtik, P., Dual, J., Keunecke, D., Mannes, D., Niemz, P., Stähli, P., Kaestner, A., Groso, A., Stampanoni, M. (2007) 3D imaging of microstructure of spruce wood. J. Struct. Biol. 159:46–55. Van den Bulcke, J., Boone, M., Van Acker, J., Stevens, M.,
Van Hoorebeke, L. (2009) X-ray tomography as a tool for detailed anatomical analysis. Ann. For. Sci. 66:508–520. Zauner, M., Keunecke, D., Mokso, R., Stampanoni, M., Niemz, P.
(2012) Synchrotron-based tomographic microscopy (SbTM) of wood: development of a testing device and observation of plastic deformation of uniaxially compressed Norway spruce specimens. Holzforschung 66:973–979.