On The Impact Of Firm Size On Risk And
Return: Fresh Evidence From The American
Stock Market Over The Recent Years
Sabrina Alioui, CRCGM-Université d’Auvergne, FranceBing Xiao, CRCGM-Université d’Auvergne, France Anissa Chaibi, IPAG Business School, France
Abstract
According to the size effect, small cap securities generally generate greater returns than those of large cap securities. Recent studies have however suggested that for certain periods, size cannot be considered as a relevant explanatory variable, and therefore as an anomaly. Our study, based on the American stock market, confirms that there is indeed a size effect applicable to the values of the Russell 3000 index. However, when considering the American market as a whole, the size effect is reversed.
Keywords: Stock Markets; Size Effect; Efficiency
1 – INTRODUCTION
anz (1981) demonstrated that small cap securities generated greater returns, and attributed this overperformance to the remuneration of an additional risk factor. This phenomenon is known as the size effect. On the American market, numerous studies revealed the cyclical nature of the size effect, others hailed the disappearance of this anomaly. Reinganum (1999) suggested that the size effect could be predicted and that large companies outperformed small companies during economic crises. This hypothesis was confirmed by Kim and Burnie (2002), as well as by L'Her, Masmoudi and Suret (2002).
Similarly, concerning the American market, Dijk (2005) noticed that the size effect had been cyclic in the period between 1927 and 2005. He also observed that between 1980 and 1999, small caps were clearly underperforming when compared to large caps. Conversely, the studies conducted by Horowitz, Loughran and Savon (2000) and Schwert (2003), demonstrated that the size effect had disappeared during the periods ranging respectively from 1981 to 1997 and from 1982 to 2002.
These observations led us to analyse recent changes to the size effect on the American market. Thus, our paper contributes to the existing finance literature by investigating the size effect in the US stock market during the recent period.
The rest of the paper is organized as follows. Section II reviews the literature. Section III introduces our approach. Our empirical findings are discussed in Section IV. Section V concludes the paper.
2 – LITERATURE REVIEW
Since Banz's publication (1981), empirical studies have revealed that the size effect has decreased. Dimson and Marsh (1999) proved that small caps outperformed large ones by 4.1% per year between 1955 and 1983, but underperformed by 2.4% per year between 1983 and 1997. Amihud (2002) highlighted that there was no size effect in place during the period ranging from 1980 to 1997.
In order to study the long-term potential of the size effect, Reinganum (1992) measured the autocorrelations of portfolio yields over periods of 1 to 7 years. He concluded that small cap performances were volatile and distinguished cycles during which large caps were much more profitable than small ones. However, for Eleswarapu and Reinganum (1993) and Dichev (1998), the size effect remained practically non-existent between 1980 and 1995.
In addition, according to Horowitz, Loughran and Savin (2000), between 1963 and 1981, small caps registered a monthly yield of 1.71%, compared to only 0.62% for large caps, i.e. a difference of 13% per year. Yet between 1981 and 1997, the size effect disappeared. Small caps generated a monthly return of 1.3%, compared to 1.46% for large caps.
The absence of the size effect may be explained by the fact that since its discovery at the beginning of the 1980s, investors have realised that small caps are capable of outperforming other segments of the stock market. Small caps then started to increase, as they were no longer constantly under-valued like in the 1960s and 70s.
Schwert (2002) came to the same conclusion for the period ranging from 1982 to 2002. His study focuses on the Dimensional Fund Advisor's performances. According to Schwert, the excess monthly return estimator, measured by the Jensen alpha, is set between -0.2% and 0.4%. However, neither of these figures are significantly different to 0. The size effect seems to have disappeared, or at least seems less pronounced than during the period ranging from 1926 to 1982.
By definition, one cannot expect high-risk values to be constantly more profitable than lower-risk values, otherwise they could no longer be defined as high-risk. Nevertheless, the increased profitability of small caps should be looked at on the long term. According to Ibbotson (2007), overperformance periods for large caps are generally followed by small cap overperformance periods, and vice versa.
Mathijs A. Van Dijk (2007) analysed the deviations between the annual yield of the smallest and largest quintiles for shares on the NYSE, AMEX and Nasdaq between 1927 and 2005. He noticed that, for several years, this difference remained relatively small. So, for 36 years, over a total of 79 years, the size premium was negative. On average, over the last 25 years, the difference has only been of 1.1% per year. Between 1946 and 1957 and between 1980 and 1999, small caps were clearly underperforming when compared to large caps.
3 – APPROACH
3.1 – Creating The Groups According To Size Deciles
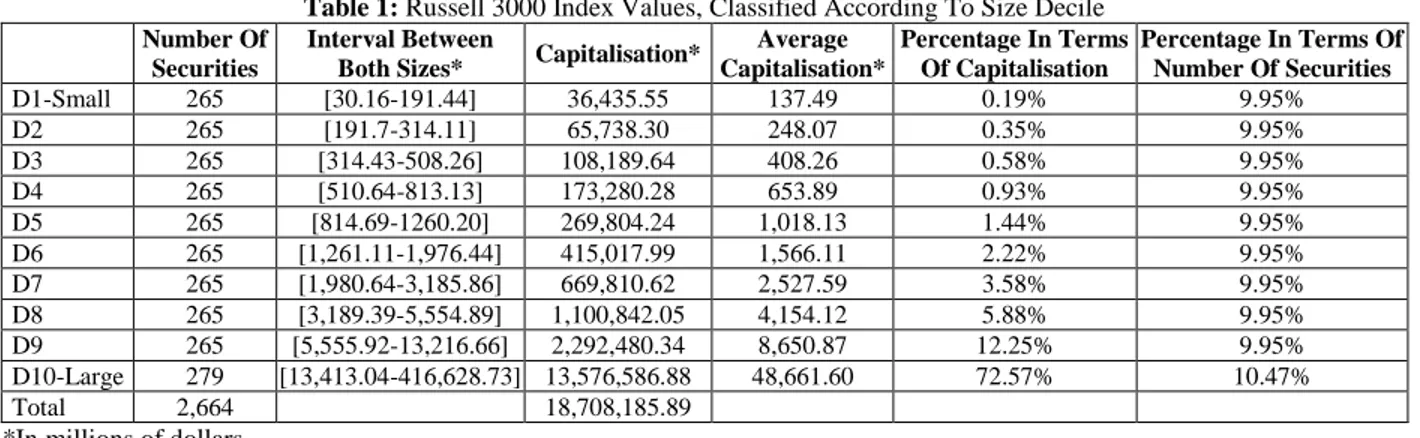
Our data are constituted of 2,664 values from the Russell 3000 index values in a daily basis over the period 2010-2012 and are sourced from the Factset database. In order to better detect a possible size effect, we make a classification of values according to size decile. Using this method, our 2,664 sample values can be distributed almost evenly into 10 groups. Table 1 below lists this classification's descriptive statistics. Group D10 includes the largest values, which alone represent 72.57% of the total market capitalisation.
A significant difference can be observed between decile 9 and decile 10. In this decile, average capitalisation is of 48,661 million dollars per security, compared to only 137 million dollars for small caps. Our sample therefore complies with Ibbotson's analysis concerning size distinction for American companies.
Table 1: Russell 3000 Index Values, Classified According To Size Decile
Number Of Securities
Interval Between
Both Sizes* Capitalisation*
Average Capitalisation* Percentage In Terms Of Capitalisation Percentage In Terms Of Number Of Securities D1-Small 265 [30.16-191.44] 36,435.55 137.49 0.19% 9.95% D2 265 [191.7-314.11] 65,738.30 248.07 0.35% 9.95% D3 265 [314.43-508.26] 108,189.64 408.26 0.58% 9.95% D4 265 [510.64-813.13] 173,280.28 653.89 0.93% 9.95% D5 265 [814.69-1260.20] 269,804.24 1,018.13 1.44% 9.95% D6 265 [1,261.11-1,976.44] 415,017.99 1,566.11 2.22% 9.95% D7 265 [1,980.64-3,185.86] 669,810.62 2,527.59 3.58% 9.95% D8 265 [3,189.39-5,554.89] 1,100,842.05 4,154.12 5.88% 9.95% D9 265 [5,555.92-13,216.66] 2,292,480.34 8,650.87 12.25% 9.95% D10-Large 279 [13,413.04-416,628.73] 13,576,586.88 48,661.60 72.57% 10.47% Total 2,664 18,708,185.89
*In millions of dollars
3.2 – Measuring Portfolio Return Rates And Price Indices
To compare yields between the different groups categorised according to size, portfolio return must be calculated. A portfolio is defined as a combination of assets, the return of which is expressed according to that of its assets. As the different groups in our study were formed in an equally weighted manner, each security is granted the same importance in the portfolio.
Additionally, to compare two categories of shares, we consider that all small caps make up a small caps portfolio and all large caps make up a large caps portfolio. Studying the size effect thus comes back to estimating and comparing the performances of two types of portfolio.
Let's suppose that a portfolio is made up of n securities. We have the arithmetic monthly returns for these n securities over a period of T months. The geometric return of a portfolio is equal to:
1 ) 1 ( 1 1 , , T
n i T j j i geo p n r R (1) Where: geo pR
, Geometric average return of the portfolio; i ϵ [1,n] and j ϵ [1,T].For each portfolio group, an index price was established. It was obtained by equally weighing out the share yield of each portfolio. In other words, this price index states each portfolio's yield for every euro invested at the beginning of 2010.
Application of the Sharpe model and the CAPM to these different size groups allows us to test the existence of the size effect on the study period as a whole, with excess returns corresponding to the regression alpha. 4 – RESULTS AND INTERPRETATIONS
4.1 – Descriptive Yield Statistics For The 10 Share Groups
Preliminary analyses show a negative relationship between returns and company size. This means that small cap groups are less efficient in terms of return and that these values present a higher volatility level.
Table 2: Monthly Returns For The 10 Share Groups (2010 To 2012) Small 2 3 4 5 6 7 8 9 Large Risk (Standard Deviation) 14.20% 12.63% 12.73% 11.80% 11.57% 10.29% 10.00% 8.96% 8.54% 7.25% Monthly Returns -0.42% 0.27% 0.30% 0.40% 0.52% 0.72% 0.79% 0.77% 0.96% 0.79%
It can be noted that returns are much more dispersed for smaller deciles, such as deciles 1, 2 and 3. Conversely, larger deciles, mainly 9 and 10, show a higher yield rate and a much lower dispersion rate.
4.2 - Analysis Of Price Index Development
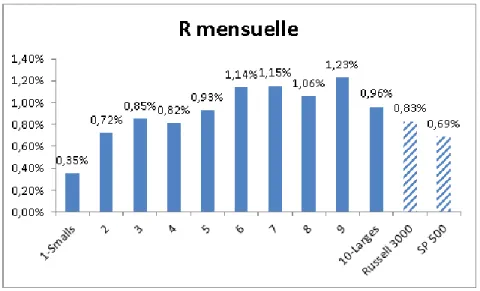
Table 3 indicates what one euro invested at the start of 2010 would return at the end of 2012 in each group, as well as the average geometric monthly return and the volatility of the arithmetic monthly return for each group.
Table 3: Group Development According To Market Capitalisation Levels End Of 2012 Value Variation Monthly Geometric
Average Annual Geometric Average Monthly Standard Deviation 1-Small 1.14 13.58% 0.35% 4.33% 6.41% 2 1.30 29.69% 0.72% 9.05% 6.51% 3 1.36 35.79% 0.85% 10.74% 6.02% 4 1.34 34.07% 0.82% 10.27% 6.81% 5 1.40 39.59% 0.93% 11.76% 6.54% 6 1.50 50.23% 1.14% 14.53% 5.50% 7 1.51 51.03% 1.15% 14.73% 6.02% 8 1.46 46.07% 1.06% 13.46% 5.61% 9 1.55 55.24% 1.23% 15.79% 5.15% 10-Large 1.41 41.17% 0.96% 12.18% 4.51% Russell 3000 34.56% 0.83% 10.40% 4.59% SP 500 27.90% 0.69% 8.55% 4.43%
It can be noted that price indices for large caps register much higher performance levels than small caps, both in terms of returns and volatility. In addition, as graphs 1 and 2 demonstrate below, there is a negative relation between the returns and volatility levels. The price index for large caps thus shows a higher return rate and a lower volatility rate than for small caps.
Graph 2: Relation Between Return (R) And Risk (Σ) For The 10 Price Indices
4.3 – Risk Adjusted Return Analysis Per Size Decile
Tables 4 and 5 below summarise the results of the regressions according to the Sharpe model and the CAPM. The regressions were carried out using the ordinary least squares method on each group for the period ranging from 2010 to 2012. For each regression model, the obtained results are presented based on the Russell 3000 index as a proxy of the market portfolio.
Table 4: Estimations According To The Sharpe Model (Market Index: Russell 3000)
Alpha
t
Betat
R² DW F-stat Total 0.0005 0.42 1.21*** 51.77 0.88 1.80 2168.52 1-Small -0.0056 -1.17 1.27*** 12.23 0.81 1.31 149.48 2 -0.0023 -0.58 1.32*** 15.31 0.87 1.55 234.32 3 -0.0002 -0.05 1.21*** 14.03 0.85 1.79 196.80 4 -0.0019 -0.50 1.39*** 16.81 0.89 1.72 282.67 5 -0.0005 -0.15 1.35*** 19.17 0.92 1.86 367.44 6 0.0031 1.15 1.14*** 19.27 0.92 1.62 371.29 7 0.0025 0.89 1.24*** 20.25 0.92 2.16 410.18 8 0.0022 0.80 1.16*** 19.53 0.92 1.89 381.26 9 0.0045* 2.03 1.07*** 22.24 0.94 1.69 494.59 10-Large 0.0027* 1.92 0.96*** 31.44 0.97 1.70 988.51 *** Significant at 1 %, ** Significant at 5 %, * Significant at 10 %Table 5: Estimations According To The CPAM (Market Index: Russell 3000)
Alpha
t
Betat
R² DW F-stat Total 0.0006 0.61 1.21*** 51.90 0.88 1.77 2,693.13 1-Small -0.0053 -1.12 1.26*** 12.18 0.81 1.30 148.26 2 -0.0020 -0.51 1.32*** 15.27 0.87 1.55 233.04 3 0 0 1.21*** 14 0.85 1.79 196.02 4 -0.0015 -0.41 1.39*** 16.76 0.89 1.71 281.06 5 -0.0002 -0.04 1.35*** 19.12 0.91 1.86 365.61 6 0.0032 1.20 1.14*** 19.20 0.92 1.62 368.51 7 0.0027 0.97 1.24*** 20.20 0.92 2.16 407.85 8 0.0023 0.85 1.16*** 19.45 0.91 1.89 378.46 9 0.0046** 2.06 1.07*** 22.17 0.94 1.68 491.48 10-Large 0.0026* 1.90 0.96*** 31.37 0.97 1.71 984.48 *** Significant at 1 %, ** Significant at 5 %, * Significant at 10 %According to our calculations, the alphas for large caps are strictly positive and those for small caps are negative, although not significantly below zero. This result confirms the reversed state of the size effect. A negative relation between the beta and the company size can also be noted, as shown in graph 3 below. This complies with the analyses carried out by Ibbotson (2007) on the American market.
Graph 3: Betas According To The Size Decile
Higher than expected returns for large caps are only compatible with the CAPM if they can be explained by differences in terms of risk, i.e. when large caps have greater betas than small caps. As shown in graph 4 below, beta levels cannot explain the overperformance of large caps.
Graph 4: Monthly Returns Per Decile And Beta Level
Regarding the American market, Chan and Chen (1988) considered that betas were very clearly investments linked to capitalisation: 1.27 for the smallest capitalised vintile, compared to 0.67 for the vintile containing the largest capitalised securities. Regarding the French market, Hamon and Jacquillat (1992) assessed each capitalisation decile's beta. Their results do not make it possible to justify a relation between the beta and the size, as betas from the different deciles were close to 1. They concluded that return benefits linked to small sizes could not be justified by differences in risk.
In theory, larger companies are more diverse and benefit from improved financial structure compared to small caps. It is therefore logical for large cap returns to be less volatile than small cap returns. Nonetheless, empirically, this theory cannot systematically be justified. The current consensus considers that the difference in terms of beta levels is not enough to entirely explain the difference in return between small and large caps.
5 – CONCLUSION
Our study of the Russell 3000 market index shows that the performance of high values is significantly greater than that of small ones between 2010 and 2012. This result poses a problem regarding the validity of the CAPM, according to which the expected yield of securities depends on the systematic risk level. Indeed, according to our calculations, beta levels are not able to entirely explain security return rates, as large cap alphas are significantly greater than zero. The size effect is therefore reversed.
This being said, a reversed size effect during certain periods does not necessarily imply a disappearance of the size effect. Indeed, as demonstrated by Ibbotson (2007), over long periods of time, small caps on average generate higher risk adjusted yields than large caps.
REFERENCES
1. Banz Rolf W., « The Relationship between Return and Market Value of Common Stocks », Journal of Financial Economics, Vol.9, 1981.
2. Berk J., « A Critique of Size Related Anomalies », The Review of Financial Studies, Vol.8, 1995. 3. Berk J., « Does Size Really Matter? », Financial Analysts Journal, Vol.53, 1997.
4. Burton G. Malkiel, « Returns from Investing in Equity Mutual Funds 1971 to 1991 », Journal of Finance, Vol.50, N°2, 1995.
5. Chan K.C., Chen N.F., « Structural and return characteristics of small and large firms », The Journal of Finance, Vol.46, 1991.
6. Cook Thomas J., Rozeff Michael S., « Size and earnings/price ratio anomalies: one effect or two ? », The Journal of Financial and Quantitative Analysis, Vol.19, 1984.
7. Eleswarapu V., Reinganum M., « The Seasonal Behavior of the Liquidity Premium in Asset Pricing », Journal of Financial Economic, Vol.34, 1993.
8. Fama E. F., French K. R., « The Cross-Section of Expected Stock Return », The Journal of Finance, Vol.47, 1992.
9. Fama E. F., French K. R., « Size and Book to Market Factors in Earnings and Returns », The Journal of Finance, Vol.50, 1995.
10. Hamon J., Jacquillat B., Le Marché français des actions : Etudes empiriques 1977-1991, PUF, 1992. 11. Horowitz J.L., Loughran Tim, Savin N.E., « The Disappearing Size Effect », Research in Economics, Vol.
54, 2000.
12. L’Her J.F., Masmoudi T., Suret J.M., « Effets taille et Book-to-Market au Canada », Revue Canadienne d’Investissement, 2002.
13. Malkiel Burton G., « Returns from Investing in Equity Mutual Funds 1971 to 1991 », Journal of Finance, Vol. 50, 1995.
14. Mathijs A. van Dijk, « Is Size Dead? A Review of the Size Effect in Equity Returns », Journal of Banking & Finance, Vol. 35, n°12, 2011.
15. Reinganum M., « Misspecification of Capital Asset Pricing Empirical Anomalies based on Earnings Yields and Market Values », Journal of Financial Economics, Vol. 9, 1981.
16. Reinganum M., « A Revival of the Small Firm Effect », The Journal of Portfolio Management, Vol. 18, 1992.
17. Reinganum M., « The Significance of Market Capitalization in Portfolio Management over Time », Journal of Portfolio Management, Vol. 25, 1999.
18. Schwert G. W., « Anomalies and Market Efficiency », Chapter 15 in Handbook of the Economics of Finance, Ed. George Constantinides, Milton Harris and Rene M. Stulz, North-Holland, 2003. 19. Vygodina Anna V., « Effects of Size and International Exposure of the US Firms on the Relationship

![Évaluation de la toxicité associée à l'ingestion par un poisson de proies benthiques contaminées aux benzo[a]pyrène](data:image/gif;base64,R0lGODlhAQABAIAAAP///wAAACH5BAEAAAAALAAAAAABAAEAAAICRAEAOw==)