Publisher’s version / Version de l'éditeur:
Plant Physiology, 175, 3, pp. 1407-1423, 2017-09-18
READ THESE TERMS AND CONDITIONS CAREFULLY BEFORE USING THIS WEBSITE. https://nrc-publications.canada.ca/eng/copyright
Vous avez des questions? Nous pouvons vous aider. Pour communiquer directement avec un auteur, consultez la Questions? Contact the NRC Publications Archive team at
PublicationsArchive-ArchivesPublications@nrc-cnrc.gc.ca. If you wish to email the authors directly, please see the first page of the publication for their contact information.
NRC Publications Archive
Archives des publications du CNRC
This publication could be one of several versions: author’s original, accepted manuscript or the publisher’s version. / La version de cette publication peut être l’une des suivantes : la version prépublication de l’auteur, la version acceptée du manuscrit ou la version de l’éditeur.
For the publisher’s version, please access the DOI link below./ Pour consulter la version de l’éditeur, utilisez le lien DOI ci-dessous.
https://doi.org/10.1104/pp.17.01042
Access and use of this website and the material on it are subject to the Terms and Conditions set forth at
Nitric oxide mediates nitrite-sensing and acclimation and triggers a
remodeling of lipids
Dolch, Lina-Juana; Lupette, Josselin; Tourcier, Guillaume; Bedhomme,
Mariette; Collin, Séverine; Magneschi, Leonardo; Conte, Melissa; Seddiki,
Khawla; Richard, Christelle; Corre, Erwan; Fourage, Laurent; Laeuffer,
Frédéric; Richards, Robert; Reith, Michael; Rébeillé, Fabrice; Jouhet,
Juliette; McGinn, Patrick; Maréchal, Eric
https://publications-cnrc.canada.ca/fra/droits
L’accès à ce site Web et l’utilisation de son contenu sont assujettis aux conditions présentées dans le site LISEZ CES CONDITIONS ATTENTIVEMENT AVANT D’UTILISER CE SITE WEB.
NRC Publications Record / Notice d'Archives des publications de CNRC:
https://nrc-publications.canada.ca/eng/view/object/?id=5de6e632-ec22-4e7a-a6df-47eebc07f326
https://publications-cnrc.canada.ca/fra/voir/objet/?id=5de6e632-ec22-4e7a-a6df-47eebc07f326
1
Title:
Nitric oxide mediates nitrite-sensing and adaptation and triggers a remodeling of glycerolipids in Phaeodactylum
Authors:
Lina-Juana Dolch1, Guillaume Tourcier1, Mariette Bedhomme1, Séverine Collin2, Leonardo
Magneschi1, Melissa Conte1, Khawla Seddiki1, Josselin Lupette1, Erwan Corre3, Dimitris
Petroutsos1, Laurent Fourage2, Giovanni Finazzi1, Fabrice Rébeillé1, Juliette Jouhet1, Robert
Richards4, Michael Reith4, Patrick McGinn4, Eric Maréchal1,*
Affiliations:
1Laboratoire de Physiologie Cellulaire et Végétale, Unité mixte de recherche 5168 CNRS -
CEA - INRA - Université Grenoble Alpes, Institut de Biosciences Biotechnologies de Grenoble, CEA Grenoble, 17 rue des Martyrs, 38054, Grenoble Cedex 9, France.
2Total Refining Chemicals, Brussels, Belgium
3Station Biologique de Roscoff, Analyses and Bioinformatics for Marine Science, Roscoff,
France
4National Research Council of Canada, Aquatic and Crop Resource Development, 1411 Oxford
Street, Halifax, NS, Canada
* Correspondence: eric.marechal@cea.fr
Keywords:
Abstract
Nitric oxide (NO) is an intermediate of the nitrogen cycle, an industrial pollutant and a marker of climate change. NO also acts as a gaseous transmitter in a variety of biological processes. The impact of environmental NO needs to be addressed. In diatoms, a dominant phylum in phytoplankton, NO was reported to mediate programmed cell death (PCD) in the model Phaeodactylum tricornutum, in response to 2E,4E/Z-decadienal (DD). Using the Pt1 strain, a higher susceptibility to DD was observed, leading to unspecific cellular membrane disruption. Production of NO in response to DD could not be observed. We re-examined NO biosynthesis and response in Phaeodactylum. NO inhibited cell growth and triggered triacylglycerol (TAG) accumulation. Feeding experiments indicate that NO is not enzymatically produced from arginine but via conversion of nitrite by a nitrate reductase (NR). Genome-wide transcriptional analysis show that NO upregulates the expression of the plastid nitrite reductase (NIR) and genes involved in the subsequent incorporation of ammonium into amino acids, via both glutamine synthesis and ornithine-urea pathway. The phosphoenolpyruvate dehydrogenase complex is also upregulated, leading to the production of acetyl-CoA, which can feed TAG accumulation upon non-transient exposure to NO. Transcriptional reprogramming leading to higher TAG content is balanced with a decrease of monogalactosyldiacylglycerol, via post-translational inhibition of MGD enzymatic activity by NO. A transient NO emission acts therefore at the basis of a nitrite-sensing and adapting system, whereas a non-transient exposure to NO can additionally induce a redirection of carbon to neutral lipids and a stress response.
3
Introduction
Nitric oxide (NO) is an intermediate of the nitrogen (N) cycle (Fowler et al., 2013). This cycle is a complex network of reactions interconverting dinitrogen (N2), the most abundant gas in the
atmosphere, into gaseous nitrogen oxides or ‘NOx’ (NO; nitrogen dioxide, NO
2 and nitrous
gas, N2O), water soluble anions (ammonium, NH4+; nitrite, NO2- and nitrate, NO3-), organic
molecules (from small soluble compounds like urea to proteins, lipids and nucleic acids) and mineral forms (Holloway and Dahlgren, 2002; Fowler et al., 2013). NO is an important pollutant in industrial flue gases (Vunjak-Novakovic et al., 2005; Zhu et al., 2015) and wastewaters (Kampschreur et al., 2009; Pan et al., 2015). All gases in the N cycle, including NO, are present in oceans (Zehr and Ward, 2002; Nicholls et al., 2007), either because of gas exchanges at the air-water interface (Nicholls et al., 2007) or because they are produced within oceans themselves. NO is generated in sea water by non-biological photochemical reactions
(Olasehinde et al., 2010), large scale electrical discharges (Gallardo and Rhodes, 1997) and
enzymatic activities in organisms living in the aerobic photic zone (Zhang et al., 2006;
Olasehinde et al., 2010; Kumar et al., 2015; Eroglu et al., 2016) or in oxygen minimum zones
(Naqvi et al., 1998; Nicholls et al., 2007; Martens-Habbena et al., 2015). Among the key
biogeochemical cycles on which ecosystems depend for their sustainability, the N cycle is clearly the most perturbed by human activities (Fowler et al., 2013), marked by massive anthropogenic leakage of nitrate and ammonia from fertilized soils (Nicholls et al., 2007;
Fowler et al., 2013) and by emissions of NOx (Nicholls et al., 2007; IPCC, 2014; Michalski et
al., 2014).
There are no reliable reports on NO concentration in aquatic ecosystems because this reactive molecule has a lifetime of only a few seconds (Naqvi et al., 1998; Zehr and Ward, 2002; Zhang
et al., 2006; Olasehinde et al., 2010). In natural seawater, NO concentration has been estimated
between 0.01 and 10 nM (Zhang et al., 2006). In industrial microalgae cultivation systems supplied with industrial flue gas (Vunjak-Novakovic et al., 2005), we estimate that NOx/NO concentrations could reach the micro- to millimolar range, i.e. one thousand to one million fold above the natural level. NO diffuses freely and even minor and transient variations could have high impacts on living organisms, in which NO is also known to act as a signaling molecule.
NO has been reported to act as a gasotransmitter in a plethora of biological functions in prokaryotes and eukaryotes, in non-photosynthetic and photosynthetic cells and in terrestrial or aquatic ecosystems (Wendehenne et al., 2001; Moreau et al., 2010; Kumar et al., 2015; Eroglu
et al., 2016). Two major enzymatic pathways can produce NO in aerobic conditions, either via a nitric oxide synthase (NOS) using arginine as a substrate (Wilson et al., 2008), or via a nitrate reductase (NR) using nitrite as a substrate (Yamasaki and Sakihama, 2000; Stohr et al., 2001;
Rockel et al., 2002). The role of NO in phytoplankton has been recently reviewed based on the
available published data, showing that it could be synthesized in photosynthetic eukaryotes containing primary plastids (chlorophyta, rhodophyta) or secondary plastids (e.g. diatoms, haptophytes, etc.) (Kumar et al., 2015).
In the green alga Chlamydomonas, nitrite is assumed to be the only NO source since the addition of arginine or the analogue Nω-Nitro-L-arginine had no effect on its production
(Sakihama et al., 2002). NO was shown to act on nitrogen assimilation, by repressing nitrate
assimilation at two levels. Firstly, NO represses the expression of the NR and the nitrate and ammonium transporters (de Montaigu et al., 2010). Secondly, it directly regulates the activities of NR and nitrate and ammonium transporters in Chlamydomonas (Sanz-Luque et al., 2013). Following nitrogen depletion of the medium , NO was also shown to be produced from intracellular nitrite and to operate in the specific cytochrome b6f degradation pathway (Wei et
al., 2014). In Chlamydomonas, NO appears therefore to have a dual role, repressing nitrogen
assimilation and acting in response to nitrogen starvation. In other photosynthetic eukaryotes, NO may have opposing effects depending on the nitrogen status (Jin et al., 2009). To date, no clear scenario has arisen for a general model linking NO signaling with the nitrogen status.
In the marine diatom Phaeodactylum tricornutum, NO has been proposed to act in population size control, being involved in a “stress surveillance system” upon exposure to high concentrations of the diatom derived aldehyde 2E,4E/Z-decadienal (DD) (Vardi et al., 2006;
Vardi et al., 2008). The treatment of Phaeodactylum with DD was reported (1) to induce a
calcium spike followed by the synthesis of NO, (2) to trigger the expression of the nitric oxide associated protein (NOA), coding for a homologue of a plant chloroplast protein involved in NO production, and eventually (3) to promote the entry into programmed cell death (PCD)
(Vardi et al., 2006; Vardi et al., 2008). The decrease in NO produced by Phaeodactylum in the
presence of a NOS-inhibitor led to the conclusion that NO was produced by a NOS-like enzyme (Vardi et al., 2006), which seems contradictory with the absence of any NOS gene in the Phaeodactylum genome (Di Dato et al., 2015). NO was therefore proposed to be derived from arginine and to act on the diatom itself, triggering PCD, and to diffuse outside the plasma
5
membrane, spread rapidly through diatom population, triggering death in surrounding cells, eventually acting in the control of the population size (Vardi et al., 2008; Bidle, 2015).
Climate change being marked by an increase in NO emissions, the biological perturbations it could create on phytoplankton has to be evaluated. Phaeodactylum appears as an appropriate model for this evaluation, firstly because the biosynthesis and physiological roles of NO have been previously investigated (Vardi et al., 2006; Vardi et al., 2008) and secondly because some diatom strains have been considered for biotechnological applications, based on their neutral lipid content (Levitan et al., 2014; Abida et al., 2015). In the present article, we analyzed the response of Phaeodactylum to various doses of NO and found unanticipated results that led us to re-examine the pathway of NO-production by this diatom and the physiological responses this gasotransmitter could trigger.
Materials and methods
Chemicals
The chemicals used in the composition of growth media, the solvents as well as 3-[(3-cholamidopropyl)dimethylammonio]-1-propanesulfonate (CHAPS), 1,2-dioleoyl-sn-glycerol (DAG), 3-(N-morpholino)propanesulfonic acid (MOPS), nitroso acetyl penicillamine (NAP), S-nitroso-N-acetylpenicillamine (SNAP), phosphatidylglycerol (PG) and unlabeled uridine di-phosphogalactose (UDP-Gal) were obtained from Sigma-Aldrich. The fluorophore 4-amino-5-methylamino-2',7'-difluorescein diacetate (DAF-FM) was purchased from Thermofisher Scientific. The diatom derived aldehyde 2E,4E/Z-decadienal (DD) was obtained from Acros organics. [14C]-labeled (11.0 GBq.mmol-1) UDP-Gal was obtained from New England
Nuclear.
Cultivation of Phaeodactylum tricornutum
Phaeodactylum tricornutum (Pt1) Bohlin Strain 8.6 CCMP2561 (Culture Collection of Marine Phytoplankton, now known as NCMA: National Center for Marine Algae and Microbiota) was used in all experiments. Pt1 cells were maintained and grown in 20 mL or 50 mL at 20°C, in 250 mL flasks, in a modified ESAW (Enriched Seawater, Artificial Water) medium (NaCl 362.7 mM; Na2SO4 25 mM; KCl 8.03 mM; NaHCO3 2.067 mM; KBr 0.725 mM; H3BO3 0.372
mM; NaF 0.0657 mM; MgCl2 47.18 mM; CaCl2 9.134 mM; SrCl2 0.082 mM; Na2
-glycerophosphate 21.8 µM; Na2SiO3 105.6 µM; Na2EDTA 14.86 µM; Fe(NH4)2(SO4)2 5.97
µM; FeCl3 0.592 µM; MnSO4 2.42 µM; ZnSO4 0.254 µM; CoSO4 0.0569 µM; Na2MoO4 0.52
µM; H3BO3 61.46 µM; Na2SeO3 10 nM; biotin (vitamin H) 8.18 nM; cobalamin (vitamin B12)
2.94 nM; thiamine (vitamin B1) 0.594 µM) (Falciatore et al., 2000), using either ten times enriched nitrogen and phosphate sources (“10 x ESAW”, containing 5.5 mM NaNO3 and 0.22
mM NaH3PO4) (Abida et al., 2015) or the same medium without nitrogen. Cells were grown on
a 12μ12 light (30 E m-2
.sec-1) / dark cycle. Cells were sub-cultured twice a week by inoculating
1 x 10⁶ cells mL-1 into fresh media. Growth was evaluated by cell counting using a Malassez
counting chamber or by the absorption at 750 nm using a TECAN plate reader. For experiments in photo-bioreactors, cells were pre-cultured in a 50 mL volume of medium, in 250 mL Erlenmeyer flasks, until they reached a density of 2-4 x 10⁶ cells mL-1. Cells were then
centrifuged at 3,500 g for 5 min and re-suspended in either 10 x ESAW or medium F (HEPES 100 mM, pH 7.5; NaCl 420 mM; MgSO4 5 mM; Na2SO4 3.5 mM; CaCl2 2.5 mM; NaNO3 70
mM; KH2PO4 0.88 mM; K2HPO4 2.3 mM; NaHCO3 10 mM; EDTA-Fe(III)-Na 0.11 mM;
7
(vitamin H) 0.1 µM; cobalamin (vitamin B12) 0.1 µM; thiamine (vitamin B1) 3.7 µM)
(Benvenuti et al., 2015) to a final concentration of 2 x10⁶ cells mL-1. Cells were grown under a
constant light regime at 20°C in small scale bioreactors (Multi-Cultivator MC 1000, Photon Systems Instruments, Czech Republic). Culture mixing throughout cultivation time was provided by gas sparging as in air-lift photobioreactors. A precise supply of CO2 to the
bioreactor tubes was controlled by the gas mixing system GMS 150 (Photon Systems Instruments, Czech Republic) following the manufacturer’s instructions.
Incubation of Phaeodactylum with NO-saturated solutions or NO-donors
Incubation of P. tricornutum with gaseous NO was performed by using NO-saturated aqueous solutions. In this approach, a tank of pure NO was bubbled into a small quantity of distilled water until the saturation point was reached, confirmed by mass spectrometric analysis of the solution. The concentration of NO in a saturated solution was taken to be 1.9 mM (Gerrard,
1980). NO saturates were then typically diluted 20-200 fold for use with live Phaeodactylum
suspensions. Alternatively, a NO-donor agent, S-Nitroso-N-acetylpenicillamine (SNAP) was used. This compound releases NO when dissolved (Miller and Megson, 2007) and was therefore prepared freshly immediately before use. Nitroso-acetylpenicillamine (NAP) was used as a non-active compound for control experiments.
Incubation of Phaeodactylum with the diatom derived aldehyde DD
Since DD is a highly toxic and volatile compound, all experiments were performed under a fume hood safety cabinet and only freshly prepared DD solutions were used, either solubilized in dimethylsufoxide (DMSO) or in the growth medium. A 500 µL volume of a Phaeodactylum culture was inoculated at a cell density of 2 x 10⁶ cell mL-1 and after a 24 hour-preincubation
under gentle agitation, cells were treated with different concentrations of DD (DMSO, 0.5% final concentration). Untreated and treated cells were then observed by confocal microscopy, using the 680 nm fluorescent filter allowing chlorophyll detection. Relative fluorescence at 680 nm was quantified using a TECAN infinite M1000Pro plate reader.
Measure of nitric oxide using DAF-FM, a fluorescent reporter molecule
The fluorophore 4-amino-5-methylamino-2',7'-difluororescein diacetate (DAF-FM) allows the sensitive detection of low levels of nitric peroxide (ONOO-), which is in equilibrium with NO
and thus indicates NO levels (St Laurent et al., 2015). DAF-FM was previously used to detect NO levels in P. tricornutum cells (Vardi et al., 2008). Cultures were diluted to obtain 106 cells
mL-1 in 10 mL and cells were incubated under gentle shaking with 20 µL of 5mM DAF-FM (in
DMSO) for 1.5 hours, at room temperature and in the dark. Cells were washed and resuspended in 10 mL of fresh 10 x ESAW medium. Aliquot fractions (500 µL) were transferred to a 48 well culture plate, to which SNAP was added as indicated. For the examination of DAF-FM-dependent detection of nitric peroxide, 150 µL samples were transferred into a 96 well plate and fluorescence was measured with a TECAN infinite M1000Pro plate reader (excitation wavelength at 488 nm, emission at 529 nm).
Fast chlorophyll fluorescence kinetics measurements
To determine photosynthesis parameters in cell cultures, room temperature fast chlorophyll fluorescence kinetics were measured using a Speedzen MX fluorescence imaging system (JBeamBio) with settings previously described (Allorent et al., 2013). To this end, a 150 µL volume of P. tricornutum culture was transferred to a transparent 96 well-plate and dark-incubated for 15-30 min before measurements. Excitation was performed in the blue range ( = 450 nm, F0) and actinic light pulses were given with a photosynthetic active wavelength of 520 nm. F0 is the steady state fluorescence in dark-adapted cultures, F in light-adapted cultures; Fm is the maximal fluorescence after a saturating light pulse of dark-adapted cultures, Fm’ the same in light adapted cultures, Fv is the difference between F0 and Fm. With these parameters, the maximum efficiency of energy conversion by photosystem II (PSII) can be calculated as Fv/Fm (Misra et al., 2012).
Measure of triacylglycerol accumulation by Nile Red staining
Accumulation of triacylglycerol droplets was monitored by Nile Red (Sigma Aldrich) fluorescent staining (excitation wavelength at 485 nm; emission at 525 nm) as previously described (Cooksey et al., 1987; Abida et al., 2015). In brief, cells were diluted and adjusted to a cell density that was linearly correlated with Nile Red fluorescence. Nile Red solution (40 μL of a 2.5 μg mL-1 stock solution in DMSO) was added to 160 μL cell suspensions. Oil bodies
stained with Nile Red were then visualized using a Zeiss AxioScope.A1 microscope (FITC filter; excitation wavelength at 488 nm; emission at 519 nm). The productivity, corresponding to the accumulation of TAG per volume and per time unit was calculated based on the staining by Nile Red, and expressed in relative fluorescence unit (Rfu) of Nile Red per mL and per day of incubation. Alternatively, Nile red fluorescence values were normalized to the cell concentration.
9
Genomic DNA was extracted from Phaeodactylum tricornutum Pt1 cells using the following procedure. Firstly, 108 cells were harvested and frozen in liquid nitrogen. A volume of 20 µL
of Edward-Buffer (Tris-HCl 200 mM, pH 7.5; NaCl 250 mM; EDTA 25 mM; SDS 0.5%, w/v) was added, then samples were homogenized and debris removed by centrifugation. The supernatant was transferred to the same volume of isopropanol to precipitate DNA. After an additional 15 minute centrifugation at 10,000 x g, the pellet was washed with ethanol 70%, dried and solubilized in TE buffer (10 mM Tris-HCL pH7, 1 mM EDTA). DNA concentration was measured using a Nanodrop 2000 spectrophotometer (Thermo Scientific). Using genomic DNA as matrix, a 2,352-bp sequence was amplified by polymerase chain reaction (PCR) with the following oligonucleotides designed from Phatr2_56150 (Vardi et al., 2008) and carrying respectively XbaI and EcoRI restriction sites (underlined sequence): NOA-Fw XbaI 5’-TTTATCTAGAATGGTCCCCACTGGTTGTATG-3’, NOA-Rev EcoRI 5’-TTTAGAATTCCTAATTACGCCCTACACCTTTTCTTC-3’. The gene ID of NOA in the third version of the genome (http://protists.ensembl.org/Phaeodactylum_tricornutum) is Phatr3_J40200. PCR was performed using Phusion High Fidelity polymerase (Thermo Scientific) according to the manufacturer’s instructions. The PCR product was digested by EcoRI and XbaI, purified and cloned in the linearized expression vector. The expression vector used for overexpression corresponds to the pH4-GUS vector (De Riso et al., 2009). The vector contains a gene coding for resistance to zeocin (Shble), allowing selection of transformed cells. Expression of the NOA gene is controlled by the constitutive histone 4 promoter.
Transformation of Phaeodactylum and selection of strain overexpressing NOA.
Wild type Phaeodactylum tricornutum cells were transformed via particle-bombardment under aseptic conditions (Kikkert, 1993), using a protocol described previously (Falciatore et al.,
1999) modified as follows. A three to four day-old Pt1 culture was concentrated to 4 x 10⁷ cells
in 500 µL and spread onto a 1% agar-plate containing 1 x ESAW medium. While shaking vigorously, 2-3 µg of non-linearized plasmid were added to 25 µL ethanol-sterilized tungsten particles (Sigma), together with 25 µL of 2.5 M CaCl2 and 10 µL of 0.1 M spermidine. After
mixing for three minutes using a vortex, the pellet was washed two times (1,500 g; 5 sec; room temperature) with 700 µL precooled 100% ethanol. DNA-coated tungsten particles were then resuspended in 25 µL 100% ethanol. A 12 µL fraction of the mix was transferred onto a macrocarrier and bombardment was carried out using 1,550 psi rupture disks (BioRad). After two to three days of incubation under continuous illumination, cells were transferred to similar agar-plates containing 100 µg mL-1 zeocin (Promega) for the selection of resistant transformed
cells. Colonies appearing after 4 to 6 weeks were transferred to a new plate for one week, prior to inoculation of 20 mL-liquid cultures.
Analysis of NOA gene expression in Phaeodactylum tricornutum cells.
To quantify the NOA mRNA level in overexpressing lines, quantitative polymerase chain reaction (qPCR) was performed after reverse transcription (RT) of extracted RNA. RNA was extracted from 107 cells that were previously pelleted, frozen in liquid nitrogen and stored at
-80 °C until processing. A volume of 1 mL TriReagent (Sigma) was added to the frozen pellet and transferred to a new Eppendorf tube. After mixing for 30 sec using a vortex, samples were incubated for 5 min at room temperature. Chloroform (200 µL) was added and tubes, inverted and incubated for 15 min at room temperature. Phase separation was achieved by centrifugation (1,500 g; 30 min; 4°C). The upper phase was transferred to a new tube and RNA was precipitated using 1 volume isopropanol (1,500 g; 30 min; 4°C), washed with 75 % ice cold ethanol (1,500 g; 5 min; 4°C) and the pellet was dried in a Speed Vac system (Eppendorf Concentrator 5301) prior to suspension in 30 µL diethyl dicarbonate (DEPC) treated water (Sigma) at 65 °C for 10 min. RNA was purified following a second ethanol precipitation using 1 volume of 5 M ammonium, acetate (2.5 M final concentration) and 1 volume isopropanol. Samples were incubated for 10 min on ice and centrifuged, washed, dried and re-suspended as above. Concentration was determined using a NanoDrop device (Thermo Scientific). The RNA obtained (1 µg) was used for reverse transcription after DNAse treatment (Qiagen) following manufacturer’s instructions so as to yield 1 µg cDNA, which were diluted to 10 ng µL-1. For
quantitative real time PCR, housekeeping gene oligonucleotides previously described (Siaut et
al., 2007), namely RPS (5′-CGAAGTCAACCAGGAAACCAA-3′ and
5′-GTGCAAGAGACCGGACATACC-3′) and TUBA (5′-CTGGGAGCTTTACTGCTTGGA-3′ and 5′-ATGGCTCGAGATCGACGTAAA-3′), were used as internal controls. NOA-specific oligonucleotides were 5’-CCTGAAAAGTTCGCTACGCA-3’ and 5’-CGGATCCTTTTTGCCCTGAG-3’. The total qPCR reaction volume was 10 µL (120 nM oligonucleotide, 20 ng cDNA, 5 µL 2X SYBR Green Sso Advanced (BioRad)). A two-step thermo-profile in 40 cycles was applied after 3 min at 95 °C initial denaturation (95°C for 10 sec; 58°C for 30 sec) and a melt curve was detected (from 65°C to 95 °C with a 0.5 °C increment) (BioRad CFX Connect Real-Time System). Evaluation of gene expression was carried out in 3 biological replicates, each one with technical triplicates, using the CFX Connect Real-Time System software, with TUBA and RPS as internal controls.
11
Glycerolipids were extracted from freeze-dried P. tricornutum cells grown in 50 mL of medium. About 50 x106 to 100 x106 cells are required for a triplicate analysis. First, cells were
harvested by centrifugation and immediately frozen in liquid nitrogen. Once freeze-dried, the pellet was suspended in 4 mL of boiling ethanol for 5 minutes to prevent lipid degradation, and lipids were extracted as described previously (Simionato et al., 2013) by addition of 2 mL methanol and 8 mL chloroform at room temperature. The mixture was then saturated with argon and stirred for 1 hour at room temperature. After filtration through glass wool, cell debris was rinsed with 3 mL chloroform/methanol 2:1, v/v, and 5 mL of 1% NaCl were then added to the filtrate to initiate phase separation. The chloroform phase was dried under argon before solubilizing the lipid extract in 1 mL of chloroform.Total glycerolipids were quantified from their fatty acids (FAs): in a 10 µL aliquot fraction a known quantity of saturated 15-carbon FA (15:0) was added and all FAs were methanolyzed into methyl esters (FAME) by a 1 hour incubation in 3 mL 2.5% H2SO4 in pure methanol at 100°C (Jouhet et al., 2003). The reaction
was stopped by addition of 3 mL water, and 3 mL hexane were added for phase separation. After 20 min of incubation, the hexane phase was transferred to a new tube. FAMEs were extracted a second time via the addition, incubation and extraction of another 3 ml hexane. The combined collected hexane fractions (6 ml) were argon-dried and FAMEs were suspended in 30 µL hexane for analysis by gas chromatography coupled with flame ionization detection (GC-FID) (Perkin Elmer), using a BPX70 (SGE) column. FAMEs were identified by comparison of their retention times with those of standards (Sigma) and quantified by the surface peak method using 15:0 for calibration. Extraction and quantification were performed with at least three biological replicates. Glycerolipids were then analyzed and quantified by high pressure liquid chromatography-tandem mass spectrometry (HPLC-MS/MS), with appropriate standard lipids. For a technical triplicate analysis of TAG, an aliquot of the lipid extract containing 25 nmol of total FAs was dried under argon and dissolved in 100 µL of a methanol/chloroform solution (1:2) containing 125 pmol of 18:0/18:0/18:0 TAG as internal standard. For each replicate, 20 µL were injected in the HPLC-MS/MS system. The analytical device comprised an LC system with binary pumps (Agilent 1260 Infinity) coupled to a QQQ MS (Agilent 6460) equipped with a JetStream electrospray vane of injection. TAGs were separated by HPLC from other lipids using a diol column (Macherey-Nagel, EC 150/2 Nucleosil 100-5 OH) maintained at 40°C. Chromatography was performed using two solvents, i.e. solvent A (isopropanol/water/ammonium acetate 1 M pH 5.3 (850:125:1, v/v) and solvent B (hexane/isopropanol/water/ammonium acetate 1 M pH 5.3 (625:350:24:1, v/v)) and the following gradient: from 0 to 5 min, 100% B; from 5 to 30 min, a linear increase of A to 100%;
from 30 to 45 min, 100% A; from 45 to 50 min, a linear increase of B to 100%, and from 50 to 70 min, 100% B. The various glycerolipid species were detected from their m/z ratio by MS/MS using the Multiple Reaction Monitoring (MRM) mode. The various transition reactions used to identify the different glycerolipid species are those previously established with Phaeodactylum tricornutum (Abida et al., 2015). Quantification was made using the Agilent Mass Hunter software furnished by the MS supplier.
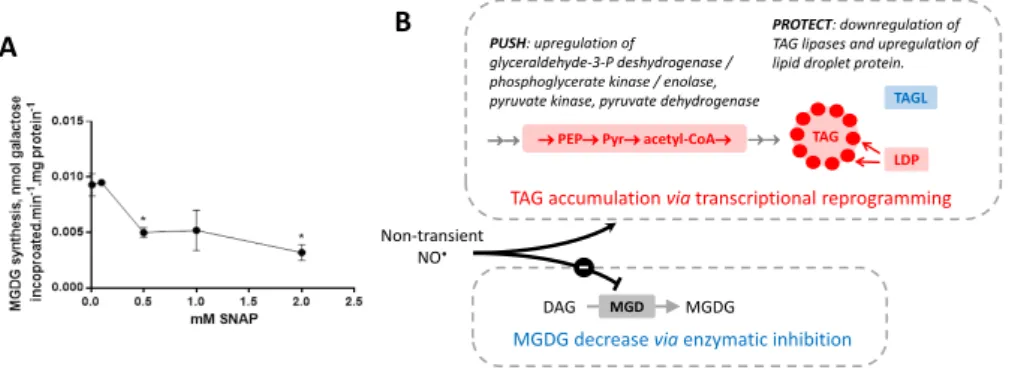
MGDG synthase enzymatic assay
A culture of Phaeodactylum tricornutum (50 mL in 10 x ESAW medium) was arrested in exponential phase and protein concentration determined using the Lowry method (Lowry et al.,
1951). Cells were harvested by a centrifugation for 10 min at 1,500 x g at 4°C. The pellet was
resuspended in 1 volume of 12mM 3-[(3-cholamidopropyl)dimethylammonio]-1-propanesulfonate (CHAPS) and 20 mM 3-(N-morpholino)3-[(3-cholamidopropyl)dimethylammonio]-1-propanesulfonate-KOH (MOPS-KOH), pH 7.8 and incubated for 20 minutes at 4°C to solubilize membrane proteins. Detergent solubilized proteins (10 µg) were then incubated for 1 hour with variable concentrations of SNAP (from 0 to 2 mM, as indicated) at room temperature in the dark in a final volume of 66.5 µL. After incubation with SNAP, galactosyltransferase enzyme activity was assayed in mixed micelles at 25°C, as described previously (Marechal et al., 1994). Phosphatidylglycerol (1.3 mM) and 1,2-dioleoyl-sn-glycerol (160 µM) dissolved in chloroform were first introduced into clean glass tubes. After evaporation of chloroform under a stream of argon, 300 µL of incubation medium adjusted to contain 10 µg proteins, 6 mM CHAPS, 250 mM KCl, 250 mM KH2PO4/K2HPO4 and 10 mM MOPS-KOH pH 7.8 were added. The mixture was mixed
vigorously and kept 1 hour at 25°C for equilibration of mixed micelles. The reaction was then started by addition of 1 mM UDP-[14C]Gal (37 Bq.µmol-1) and stopped after 20 min by addition
of chloroform/methanol (1:2, v/v). The lipids were subsequently extracted (Bligh and Dyer,
1959) and the radioactivity of the [14C]-labeled MGDG produced, determined by liquid
scintillation counting. Activity is expressed in nmol incorporated galactose h-1 mg protein-1.
RNAseq analysis.
An actively growing stock culture of Phaeodactylum tricornutum was used to inoculate duplicate 100 mL experimental cultures in 250 mL Erlenmeyer flasks at an initial cell density of 2 x 10⁶ cells mL-1. Using a calibrated saturated NO solution, single additions at the start of
the experiment were made to treated cultures to produce initial concentrations of either 3 or 10 µM NO. Untreated cultures received no NO. Cultures were allowed to grow for 4 days before
13
harvesting cells by centrifugation at 5000 rpm for 15 minutes at room temperature. After discarding the supernatant, cell pellets were flash frozen in liquid nitrogen and stored at -80 C before processing. In brief, cell aliquots were processed individually by grinding in liquid nitrogen in a mortar and pestle followed by extraction in RNA Pro lysis solution (MP Biomedicals) using a FastPrep homogenizer (two 40-sec cycles, with power set at level 6, following manufacturer instructions). After centrifugation, the supernatant was recovered and extracted with chloroform; RNA was precipitated by addition of an equal volume of cold absolute ethanol and incubation at -20°C overnight. Precipitated RNA was recovered by centrifugation, washed in 75% ethanol and air dried. The pellet was dissolved in RNase-free water and further purified using the clean-up protocol for the Qiagen RNeasy Mini Kit. RNA samples were quantified with a NanoDrop spectrophotometer and analyzed on an Agilent BioAnalyzer using the Plant RNA Nano program. 2.5 μg of each RNA was sent for RNA-Seq analysis at the McGill University and Genome Quebec Innovation Centre. Libraries for each sample were prepared for stranded 100 bp paired end sequencing and samples were combined and analyzed in a single Illumina Hiseq 2000 lane. Reads were mapped on the most recent
genome version of Phaeodactylum tricornutum
(http://protists.ensembl.org/Phaeodactylum_tricornutum) using the Star (Spliced Transcripts Alignment to a Reference) method (Dobin et al., 2013; Engstrom et al., 2013). Data were filtered based on the detection of 1 read in at least one sample per treatment or genomic mutation and then normalized using the DESseq2 method (Varet et al., 2016). Only genes being differentially expressed with a |Log2(fold change)| > 1 in at least one of the contrasts (i.e. comparing NO supplies at 0 µM vs. 3 µM, 0 µM vs. 10 µM or 3 µM vs. 10 µM), and with p-value lower than 0.05, were considered for further analyses. A partition of differentially expressed genes was performed using a K-mean method, with a number of partitions set to 6 and a clustering based on a Euclidian distance (Liu et al., 2014). For each group we sought whether gene ontology (GO) terms could be enriched, either by the DAVID method
(http://david.abcc.ncifcrf.gov) (Huang et al., 2007), using the corresponding Refseq gene IDs
and with a p-value threshold set at 0.1, or using the GOseq R package (Young et al., 2010) with an identical p-value threshold. Based on GO enriched terms, a focused analysis of acyl-lipid pathways and of nitrogen assimilation was performed, using a list of gene sequences with curated annotations.
Results and Discussion
Treatment of P. tricornutum with 2E,4E/Z-decadienal leads to cell necrosis and does not
allow the detection of NO production
We started our study by setting up an experimental protocol previously reported to enable the measurementof NO production by P. tricornutum in response to putative infochemicals deriving from disrupted diatoms cells (Vardi et al., 2006; Vardi et al., 2008). Following wounding or nutrient stresses, diatom polyunsaturated fatty acids are oxidized enzymatically into volatile polyunsaturated aldehydes (PUAs), i.e. 2E,4Z,7E-decatrienal and 2E,4E-decadienal (DD) (Miralto et al., 1999), shown to impair grazer’s reproduction (Ianora and
Miralto, 2010). PUAs have been considered as potent interspecific and intraspecific signaling
compounds (Casotti et al., 2005; Vardi et al., 2006). By treating P. tricornutum and Thalassiosira weissflogii with increasing doses of DD from 33 to 66 µM, a burst of NO was measured using DAF-FM as a NO-reporter, appearing within 5 minutes, with an intensity proportional to DD concentration (Vardi et al., 2006). Both DD and externally provided NO were then reported to trigger programmed cell death (PCD). Production of NO and PCD were blocked by N(G)-monomethyl-L-arginine, supporting an arginine-dependent production by a NOS-like enzyme. The threshold concentration of DD required to induce PCD was ~20 µM
(Vardi et al., 2006).
We sought therefore to detect the endogenous biosynthesis of NO in Phaeodactylum wild type (WT) cells, following treatment with supposedly non-lethal doses of DD, set at 3.3 µM and 10 µM (Vardi et al., 2006; Vardi et al., 2008). However, after 30 min incubation, the relative chlorophyll fluorescence normalized to the cell concentration was reduced by 50 % and further decreased with time compared to untreated controls (Figure S1A). The Fv/Fm ratio dropped immediately after addition of DD, with a strong decrease of fluorescence in dark-adapted cultures (F0) that correlated with chlorophyll concentrations. The Fv/Fm ratio relaxed over time, recovering its initial level (Figure S1B). Concomitantly, cell growth was arrested following DD treatment (Figure S1C). The discrepancy of chlorophyll decrease but artifact Fv/Fm recovery suggested a disruption of the chloroplast limiting membranes. This was confirmed by confocal imaging showing a disintegration of Phaeodactylum chloroplasts in response to DD (Figure S1D), consistent with the known unspecific membrane disrupting property of PUAs (Ribalet et al., 2007). The destructive effect of DD was similar if it was added directly to the culture or from a stock solutions dissolved in DMSO (final concentration 0.5%).
15
We treated cells with lower doses and found a similar response at concentrations ranging from 100 nM to 3.3 µM DD (Figure S2). Even at 100 nM, the Fv/Fm measures were already half of that of untreated cells (Figure S2). The sensitivity of Phaeodactylum to DD was therefore much higher than previously published (Vardi et al., 2006; Vardi et al., 2008). We could not detect any evidence for a PCD induced by DD exposure, but rather a non-specific necrosis. In Phaeodactylum, the cellular level of polyunsaturated fatty acids (mainly eicosapentaenoic acid, EPA) is about 2 nmol per 106 cells in nutrient replete or nitrogen- or phosphorus-deprived media
(Abida et al., 2015). Supposing that all EPA could be converted into PUAs, one should consider
that 5 x10⁶ Phaeodactylum cells per mL should be lysed to reach 10 µM PUAs (the level of DD
used here), and at least 1.65 x 10⁷ to 3.3 x 10⁷ lysed cells per mL to reach 33 and 66 µM PUAs
(levels of DD in previous studies) (Vardi et al., 2006). These cell concentrations are far above those used here, by at least three orders of magnitude, and indeed the most recent survey of PUA levels in oceans shows that the highest concentration was in the nanomolar range (Ribalet
et al., 2014). Thus, although we could not confirm that DD could act as a cell-to-cell specific
signal in a sub-micromolar concentration range, we do not exclude that it could play this role within a physio-ecological concentration, i.e. in the pico- to nanomolar range, and future work should therefore re-address this question.
The cPTIO reagent (carboxy-2-phenyl-4,4,5,5-tetramethyl-imidazoline-1-oxyl-3-oxide) donates an oxygen atom to generate NO2 and is often used to scavenge NO and act as an
antidote (Keszler et al., 2010). We sought to determine whether DD-treated cells could be rescued by cPTIO, as previously reported (Vardi et al., 2008). Unexpectedly, Phaeodactylum cells proved to be highly sensitive to cPTIO as well, with a one third decrease of chlorophyll and a 20% decline in Fv/Fm after incubation with 100 µM cPTIO (dissolved in ESAW) (Figure S3). Cytotoxic effect of PTIO was also observed (not shown). Therefore, in the following experiments, neither cPTIO nor PTIO could be used to revert the effects observed after NO treatments. In addition, whereas the caspase/metacaspase inhibitor carbobenzoxy-valyl-alanyl-aspartyl-[O-methyl]-fluoromethylketone (Z-VAD-FKM) had been stated to partly rescue Phaeodactylum treated with DD (Vardi et al., 2008), we could not detect any effect of Z-VAD-FKM supplied at 20 to 40 µM on cells treated with 3.3 µM DD (not shown). Taken together, we could not obtain results consistent with a specific DD PCD cascade. We therefore reconsidered the complete question of the physiological role of NO.
We used two differentmethods for supplying nitric oxide, either by providing NO directly to the cells through the additions of dilutions of an NO-saturated solutionor by adding a NO -donor agent, S-Nitroso-N-acetylpenicillamine (SNAP). Nitroso-acetylpenicillamine (NAP), a structural analog of SNAP which lacks the NO-moiety, was used as a control for SNAP experiments. We verified the production of NO following SNAP dissolution by two methods. Firstly, using Membrane Inlet Mass Spectrometry (MIMS, NRC Halifax laboratories), we observed an increase of the NO signal (m/z = 30) with increasing doses of SNAP, up to a concentration of 600 µM (Figure S4A). Secondly, using the DAF-FM probe, we detected a signal in less than 30 minutes following dilution (Figure S4B), showing the efficiency of this NO-donor in our experimental design. Both NO donated by SNAP (Figure 1A) or supplied directly as a gas (not shown) impaired the growth of Phaeodactylum, as previously reported
(Vardi et al., 2006; Vardi et al., 2008). A concentration of 1 mM SNAP reduced growth by only
20%, and was selected for further experiments. In contrast to DD, SNAP treatment did not affect chlorophyll levels (Figure 1B).
Figure 1: Effect of NO supplied by SNAP on the growth of Phaeodactylum. The incubation was performed in
a volume of 500 µ L, inoculated at 106 cells.mL-1, with immediate addition of SNAP. A. Cell concentrations. Cell
concentrations were estimated using a Malassez counting chamber. B. Chlorophyll content. Spectrophotometric measurement of fluorescence was performed at 680 nm at room temperature using 106 cells.
External supply of NO triggers the accumulation of triacylglycerol (TAG) within P. tricornutum cells
Cell division arrest following general stress responses is known to coincide with the accumulation of triacylglycerol (TAG) (Kohlwein, 2010; Meï et al., 2017). We analyzed the accumulation of TAG droplets in Phaeodactylum by Nile Red staining. Following exposure to NO, we did not see any evidence of chloroplast disintegration or of cell death, as observed
B
A
d a y c e ll s .m L -1 1 2 3 0 5 . 01 06 1 . 01 07 1 . 51 07 d a y C h l, r f u .1 0 6 c e ll s -1 1 2 3 0 5 , 0 0 0 1 0 , 0 0 0 1 5 , 0 0 0 c o n t r o l 0 . 1 m M 0 . 5 m M 1 m M 3 m M 5 m M17
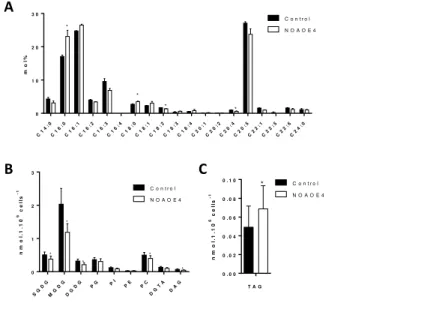
following DD treatments. We observed that a 2-day incubation with 1 mM SNAP in a 500 µL culture volume triggered a 2.2 fold increase of TAG per cell (Figure 2A) and a >2 fold increase of TAG productivity, corresponding to the level of TAG per volume of culture and per day (Figure 2B). Interestingly, while upon nitrogen starvation two large lipid droplets are visible in Phaeodactylum, flanking the chloroplast (Abida et al., 2015), in SNAP treated cells numerous lipid droplets of variable sizes can be observed (Figure 2C).
Figure 2. Effect of increasing concentrations of SNAP on the production of TAG in Phaeodactylum
tricornutum. The incubation was performed in a volume of 500 µL, inoculated at 106 cells.mL-1, with immediate
addition of chemicals. Measurements were performed after 2 days of incubation. A. Effect of increasing
concentrations of SNAP on TAG level per cell. TAG level per cell were measured using Nile Red staining and is given in relative fluorescence units per 106 cells. Stars indicate statistical relevant treated compared to untreated
samples, with p-values of 5.10-3 and 4.10-4 for 0.5 mM SNAP and 1 mM SNAP, respectively. B. Effect of
increasing concentrations of SNAP on TAG productivity. TAG productivity is given in relative fluorescence unit (Rfu) corresponding to the fluorescence of Nile Red per mL and per day. (C) Epifluorescence images on Nile red stained treated and untreated cells. Statistically relevant were the responses to 0.5 mM SNAP (p-value 3.10-2) and 1 mM SNAP (p-value 4.10-4).
We sought to determine whether this effect observed following an external supply of NO could be also attributed to NO as an internal signal, enzymatically produced by the diatom itself. To that purpose, we re-examined the question of the endogenous production of NO.
Biosynthesis of NO in Phaeodactylum is arginine-independent and nitrite-dependent.
Data from previous studies on NO production by diatoms are confusing. On the one hand, it was shown that NO production was blocked by an NOS-blocking agent (Vardi et al., 2006)
and authors concluded on the action of a NOS-like enzyme using arginine as a substrate. Intriguingly, it was not possible to detect any NOS-like sequence in the genome of P.
control 1 mM SNAP N il e r e d , r f u .1 0 6 c e ll s -1 co nt r ol 0. 5 m M N AP 1 m M N AP 0. 5 m M S NA P 1 m M S NA P 0 2 , 0 0 0 4 , 0 0 0 6 , 0 0 0 8 , 0 0 0 1 0 , 0 0 0 * * * * * N il e r e d , r f u .m L -1.d a y -1 co nt r ol 0. 5 m M N AP 1 m M N AP 0. 5 m M S NA P 1 m M S NA P 1 2 , 0 0 0 1 4 , 0 0 0 1 6 , 0 0 0 1 8 , 0 0 0 2 0 , 0 0 0 2 2 , 0 0 0 * * *
B
A
C
Commented [WU1]: Where ? In the control (NAP-treated) cells ?
tricornutum (Di Dato et al., 2015). On the other hand, an orthologous sequence of the plant chloroplast NO-associated (NOA) protein sequence was identified (Vardi et al., 2008). NOA-overexpression was reported to lead to a NO increase, a reduction of growth and a decrease of Fv/Fm. NOA overexpressing lines were also reported to be hypersensitive to DD, with a growth arrest at 3.3 µM or 6.6 µM DD, whereas WT cells were unaffected (Vardi et al., 2008), conditions that were shown here to trigger unspecific cell death in the WT.
The Arabidopsis homolog AtNOA acts in NO production but the protein does not possess any NOS function in vitro (Moreau et al., 2008). AtNOA1 and nitrate reductase (NR) are responsible for the majority of NO releases (Gas et al., 2009; Moreau et al., 2010). The mode of action of AtNOA1 remains elusive although it might be involved in the regulation of NR activity (Jin et al., 2009; Mandal et al., 2012). In this NR-dependent pathway, NO is produced by reduction of nitrite (NO2-) by NR (Figure S5). Nitrite is reduced to ammonium (NH3) by the
nitrite reductase (NIR), and ammonium is a substrate for the biosynthesis of arginine. Therefore, addition of arginine could have a negative feedback regulation on NIR thereby providing high nitrite levels for NR-dependent NO production (Figure S5). This could explain a positive action of an arginine supply on NO production, via NR and in the absence of any NOS. One way to make the distinction between NO produced from arginine via a NOS or via a NR is to detect an inhibition of the NOS-pathway by a blocking agent, e.g. L-NAME (N ω-nitro-L-arginine methyl ester).
We analyzed therefore the endogenous level of NO in Phaeodactylum culture in presence of the two potential substrates, arginine and NO2-. The detection of NO in Phaeodactylum was
much higher when the diatoms were cultured in presence of NO2-, either in the presence or
absence of NO3- (Figure 3), supporting a production via the action of NR. By contrast, addition
of arginine did not impact significantly on the production of NO. Similarly, addition of L-NAME did not lead to any significant change, when cells were co-fed with arginine (Figure 3).
19
Figure 3. Detection of NO in Phaedocatylum based on nitrogen sources. Cells were harvested from complete
media and inoculated in nitrogen-free media at 2.106 cells.mL-1. DAF-FM was added at a concentration of 10 µM.
After dark incubation and washing, cells were collected into 500 µL culture aliquots, and supplemented with the indicated nitrogen sources: nitrate (NO3-, standard medium), nitrite (NO2-), 1 mM arginine (Arg) and the
NOS-blocking agent L-NAME. DAF-FM fluorescence was recorded after three hours of incubation.
Taken together, these results are consistent with a unique NR-dependent production of NO in Phaeodactylum as observed in other photosynthetic eukaryotes from distant clades, such as Arabidopsis (Moreau et al., 2010; Sanz-Luque et al., 2015), the red alga Gracilaria chilensis
(Chow et al., 2013) and the green alga Chlamydomonas (Wei et al., 2014). The previously
reported NOSactivity in Phaeodactylum (Vardi et al., 2006; Vardi et al., 2008) was based on increased NO production in response to DD measured with a citrulline/arginine feeding on whole cell protein extracts (Vardi et al., 2006). Given the destructive effect of DD, one cannot exclude an interference with this method. In addition, we used the Phaeodactylum accession Pt1 CCAP 1055, whereas the previously study used CCMP 632, thus we cannot exclude strain-dependent differences.
NOA overexpression correlates with an increased endogenous production of NO by
Phaeodactylum
We re-examined the role of the NOA protein in the endogenous production of NO and designed genetic constructions for NOA overexpression. Genomic DNA extracted from P. tricornutum
D A F -F M , r f u .1 0 6 c e ll s -1 5. 5 m M N O3 -5. 5 m M N O2 -2. 2 5 m M N O3 - + 2 . 2 5 m M N O 2 -5. 5 m M N O3 - + 1 m M A r g 5. 5 m M N O3 - + 1 m M L - N AM E 5. 5 m M N O3 - + 1 m M A r g + 1 m M L - N AM E 0 5 0 0 1 0 0 0 1 5 0 0
Pt1 strain was used as matrix and a 2,352 bp sequence was amplified by PCR using oligonucleotides designed from Phatr2_56150 (Vardi et al., 2008), now referenced as Phatr3_J40200. The NOA PCR product was cloned into the pH4 vector (De Riso et al., 2009), transformed into P. tricornutum WT cells and we obtained overexpressing lines after zeocin selection, including NOAOE4 and NOAOEf generated by two independent series of transformation experiments. The RNA level of the NOA gene was more than 30-fold induced in the two independent overexpressing lines and led to a 4-5-fold elevated NO production (Figure S6), which was consistent with previous reports (Vardi et al., 2008). We thus confirmed that NOA played a role in NO production and used these overexpressing lines as models for the analysis of the physiological role of NO in Phaeodactylum. We obtained similar results with both independent overexpressing lines and present below results obtained with NOAOE4.
NOA overexpression activates the transcription of the plastid ferredoxin-nitrite reductase.
In plants, the precise molecular function of NOA is unresolved, but some reports suggest an interplay with nitrogen assimilation (Yamasaki and Sakihama, 2000; Moreau et al., 2010). NO production was also correlated with a transcriptional control of nitrogen-assimilation genes, as described for Chlamydomonas (de Montaigu et al., 2010). We sought whether such transcriptional control could exist in Phaeodactylum. We analyzed by qRT-PCR the expression level of the genes coding for the cytosolic NR (Phatr3_J54983), the plastid ferredoxin-dependent nitrite reductase, NIR (Phatr3_J12902) and the sulfite reductase, SIR (Phatr3_J9538), used as a nitrogen-independent negative control. In nutrient replete conditions (10 x ESAW), the NIR gene was highly induced in NOAOE4, whereas NR expression was slightly increased and that of SIR did not change significantly, compared to the respective wild type and cells transformed with the empty vector (Figure 4A). A nitrite-sensing module can therefore be proposed based on a positive regulatory loop triggering NIR transcription downstream NR-dependent transient NO emission (Figure 4B).
21
Figure 4: Effect of NOA overexpression on the expression level of nitrogen assimilation genes in nutrient replete condition. A. NOA overexpression activates the transcription of the plastid ferredoxin-nitrite reductase. RNA was extracted from a 108-cell pellet of NOAOE4, WT and pH4 and reversely transcribed.
Quantitative real time PCR was conducted on 20 ng cDNA using oligonucleotides binding TUB and RPS as internal controls and NOA, NR, NIR and SIR as genes of interest. Quantification cycles of NOAOE4 derived cDNA were normalized to WT and pH4 values. Significant changes were observed on the level of NOA (p-value < 10-4), NR
(p-value 1.25.10-2) and NIR (p-value 2.10-2). B. Nitrite-sensing module. Abbreviations: NIR, plastid
ferredoxin-dependent nitrite reductase; NOA, plastid nitric oxide associated protein; NR, cytosolic nitrate reductase; SIR, sulfite reductase.
NOA does not appear involved in the onset of the response of Phaeodactylum to nitrogen
starvation.
Since Phaeodactylum increases NR expression levels when nitrogen is limited (Levitan et al.,
2015; Yang et al., 2016), and since NR expression was slightly increased in the NOAOE
background, we sought to determine whether NOA was also responsive to nitrogen availability. In a 3-day time course of cells shifted to nitrogen depleted conditions, the typical nitrogen starvation responses occurred, i.e. reduction of Fv/Fm, chlorophyll fluorescence and cell growth and induction of neutral lipids as measured by Nile Red staining (Figure 5A). We confirmed a rapid, strong and parallel induction of NR and NIR in response to nitrogen starvation (Figure 5B). SIR and NOA responded to general nutrient deprivation with a late induction pattern, reaching a maximal 4-6-fold induction after three days of cultivation (Figure 5B). Thus, although in nutrient-replete culture we had observed the overexpression of NOA with higher NR and NIR levels, under nitrogen starvation the upregulation of these genes is not synchronized downstream an increase of NOA mRNA. This is in contrast with Chlamydomonas,
E x p r e s s io n , f o ld c h a n g e N O A N R N I R S I R 0 1 0 2 0 3 0 4 0 * * * * * * Nitrate NO3- NR Nitrite NO2- NIR Ammonium NH3/NH4+ NO
+
A
B
NOAin which NO was shown to be produced from cytosolic nitrite, and act in the orchestrated response upon nitrogen shortage (Miller et al., 2010; Wei et al., 2014). In Phaeodactylum, NO does not appear as a mediator in the onset of the phosphate deprivation response.
Figure 5: Expression of NOA, NR, NIR and SIR in nitrogen depleted wild-type Phaeodactylum cells . Cells
were harvested and resuspended in nitrogen-free media in 100 mL cultures a concentration of 106 cells.mL-1. Each
day, a 20 mL culture aliquot was harvested for RNA extraction and a 300-µ L culture aliquot was used for physiological measurements. A. Physiological parameters. Chlorophyll (Chl) was measured by the absorption at 680 nm at room temperature, Nile red fluorescence was quantified to indicate neutral lipid co ntents, Fv/Fm was measured using fast chlorophyll fluorescence kinetics and cell concentrations were estimated via the absorption at 750 nm. B. NOA, NR, NIR and SIR gene expression. RNA was extracted from a cell pellet and reversely transcribed. Quantitative real time PCR was conducted on 20 ng cDNA using oligonucleotides binding TUB and
RPS as internal controls and NOA, NR and NIR as genes of interest. The SIR gene was used as a nitrogen-unrelated
control. Data are normalized with value measured with cells harvested before the shift. Data are the results of three independent biological replicates.
Altogether, these results support a role of NOA and NO in a fine tuning of the regulation of the nitrogen assimilation system more selective for nitrite over nitrate (uncoupled and higher upregulation of NIR over NR), but this NO-mediated pathway does not operate during nitrogen starvation, where a strong and parallel up-regulation of NR and NIR is triggered. We sought to characterize the extent of the transcriptional changes induces by NO at the whole genome scale.
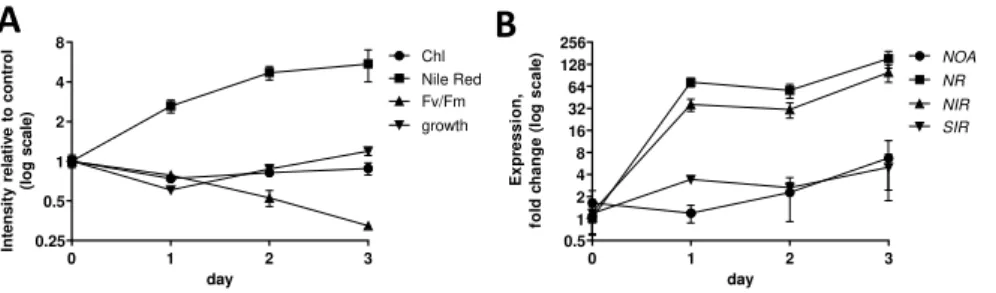
Whole genome transcriptome analysis in response to increasing doses of NO• highlights a role in nitrite sensing, high-nitrite adaptation and reprogramming of lipid synthesis.
We analyzed the effects of increasing doses of NO• on the whole transcriptome of Phaeodactylum. To that purpose, we supplied NO• from a saturated solution at concentrations of 3 and 10 µM. Of the 12,393 referenced genes, reads were obtained for 11,464 . We found 804 genes differentially expressed with a |Log2(fold change)| > 1 in at least one of the contrasts (i.e. comparing NO supplies at 0 µM vs. 3 µM, 0 µM vs. 10 µM or 3 µM vs. 10 µM), and with p-value lower than 0.05. A partition of differentially expressed genes was performed using a
K-B
A
day Ex pre s s io n , fo ld c h a n g e (l o g s c a le ) 0 1 2 3 0.5 1 2 4 8 16 32 64 128 256 NOA NR NIR SIR day 0 1 2 3 0.25 0.5 1 2 4 8 Chl Nile Red Fv/Fm growth In te n s it y re la tiv e t o c o n tr o l (lo g s c a le )23
mean method, with the number of partitions set to 6 (Liu et al., 2014). Each group or cluster consisted of genes with similarexpression profiles following treatments with NO (Figure S7 and Table S1). Two clusters were comprised of genes downregulated following NO treatments, i.e. group 1 (DR1; 55 genes) containing genes with the strongest magnitude in decreased
expression (in the -2 to -4 Log2FC range) and group 2 (DR2;282 genes) with moderate but
significant decreased expression (Log2FC ~ -1). Likewise, two clusters were comprised of genes upregulated following NO treatments, i.e. group 6 (UR1; 54 genes) containing genes
with the strongest magnitude in expression increase (in the +2 to +4 Log2FC range) and group 3 (UR2; 291 genes) with moderate but significant increased expression (Log2FC ~ +1) (Figure
S7 and Table S1). For each group we sought whether gene ontology (GO) terms could be enriched, either by the DAVID method (http://david.abcc.ncifcrf.gov) (Huang et al., 2007)
(Table S2) or using the GOseq R package (Young et al., 2010) (Table S3). We then mined information in the groups corresponding to a differential expression that could be correlated with the dose, i.e. DR1, DR2, UR1 and UR2.
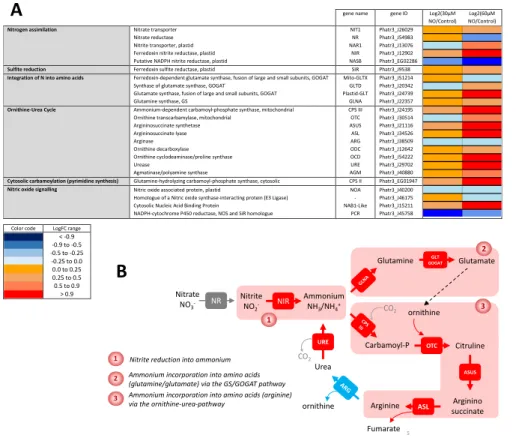
Focusing on genes apparently upregulated by NO, we focused on the possible metabolic pathways or cellular processes responsible for this reprogramming. Clearly, GO terms and metabolic pathways corresponding to nitrogen assimilation, glycolysis, phosphoenolpyruvate production, pyruvate production, acetyl-CoA production and glycerolipid production are enriched in UR1 and UR2 (in bold characters and underlined in Tables S2 and S3). More specific
GO terms retrieved concerning nitrogen metabolism include the carbamoyl synthase activity, arginosuccinate synthetase activity, glutamine synthesis and arginine synthesis. These terms highlight a possible activation of two pathways generating amino acids, i.e. the glutamine synthase/glutamine oxoglutarate aminotransferase (“GS/GOGAT”) route producing glutamine and glutamate, and the ornithine-urea pathway. More specific GO terms retrieved concerning carbon metabolism include glycolysis, phosphopyruvate hydratase activity, phosphoglycerate kinase activity and lipid metabolism.
We thus focused our analysis on the corresponding metabolic pathways. Figure 6A shows the dose-dependent response of genes involved in nitrogen (nitrate, nitrite, ammonium) assimilation, incorporation into amino acids and entry into the ornithine-urea pathway, which was shown to be a specific metabolic feature of diatoms (reference?). The most evident response to low-dose treatments with NO amongst the set of genes known to be involved in nitrogen assimilation is the specific expression of the gene coding for the plastid NIR protein, reducing NO2- into NH3/NH4+ (Figure 6A). We included in this analysis the gene putatively
coding for the large subunit of a prokaryotic-type NADPH dependent nitrite reductase (NASB) (Allen et al., 2011; Levitan et al., 2015), and is clearly uncoupled from the high-nitrite adaptive response shown here (Figure 6A) Genes coding for enzymes involved in nitrogen incorporation into amino acids via the “GS/GOGAT” route (Guerra et al., 2013), are upregulated starting with the incorporation of NH3 into glutamine by GLNA, followed by the production of glutamate by
the glutamate synthase systems, Mito-GLTX, Plastid-GLT and GLTD. This upregulated pathway is localized in the plastid, where NIR also resides (Figure 6).
Genes encoding the ornithine-urea pathway are clearly and coordinately activated, to the notable exception of one of its components, the arginase gene, ARG (Figure 6A). Firstly, the mitochondrial carbamoyl phosphate synthase, CPS III, combining CO2 and NH4+ into
carbamoyl phosphate, is upregulated. Following this capture of ammonium, carbamoyl phosphate is combined with ornithine by the OTC, forming citrulline, then combined with aspartate by the argininosuccinate synthase, ASUS. Argininosuccinate is broken down into arginine and fumarate by the argininosuccinate lyase, ASL. Whereas CPS III, OTC, ASUS and ASL are all activated, ARG encoding the enzyme regenerating ornithine and producing urea is unchanged, even slightly downregulated. The so-called ornithine-urea cycle is therefore not cyclic, interrupted at the level of arginine (Figure 6B) and it appears therefore as a system mainly tuned to capture NH4+, without driving the production of urea. Consistently, the gene
encoding the urease, URE, is also activated in parallel with the others, breaking down urea back into NH4+ and CO2. Ornithine, which needs to be recycled to allow this pathway to operate, can
alternatively derive from glutamate and acetyl-CoA, produced by an acetylornithine deacetylase. Two proteins containing zinc-peptidase like domains in Phaeodactylum (Phatr3_J15083 and Phatr3_J18404) might possibly produce ornithine by this pathway, but this function needs to be demonstrated. Taken together, all genes of the ornithine-urea pathway seem to be mobilized to trap ammonium produced by NIR and use it to produce arginine.
Interestingly, exogenous NO does not trigger the upregulation of NOA (Figure 6A). We sought sequences in the genome of Phaeodactylum which might be homologous to genes involved in NO signaling in other eukaryotes. As mentioned above, no NOS gene could be identified (Di
Dato et al., 2015). Genes coding for homologues of a NOS-interacting protein and an
NADPH-cytochrome P450 NOS homologue have been found, but their annotation is likely not valid, and they do not respond to the NO treatment (Figure 6A). Thus our analysis could not lead us to identify any component acting in the synthesis of NO besides NOA.
25
Note: The column headings in this Figure should be changed to 3 and 10 µM instead of 30 and 60 µM.
Figure 6: Dose-response expression of nitrogen assimilation genes following treatment with increasing concentrations of NO•. Phaeodactylum cells were treated with 0 (Control), 3 µM and 10 µM NO• using a
calibrated NO•-saturated aqueous solution and after 96 hours of NO treatment, RNA was extracted and subjected to a RNAseq aalysis. Libraries for each sample were prepared for stranded 100 bp paired end sequencing and samples were combined and analyzed in a single Illumina Hiseq 2000 lane. Reads were mapped on the most recent genome version of Phaeodactylum tricornutum (http://protists.ensembl.org/Phaeodactylum_tricornutum). Annotated genes coding for nitrogen assimilation were then used to probe changes in 3 metabolic modules, i.e. nitrogen assimilation, integration of nitrogen into amino acids and integration of nitr ogen via the ornithine-urea pathway (or cycle). NOA expression was also examined. Eventually, genes with some sequence similarity with genes acting in NO• signaling in other organisms were also included, although this function seems unlikely based on our study.
Recently, NO has been shown to nitrosylate a RNA-binding protein in the cytosol of Chlamydomonas, NAB1, which represses the translation of some mRNAs of photosynthetic
gene name gene ID Log2(30µM NO/Control)
Log2(60µM NO/Control) Nitrogen assimilation Nitrate transporter
Nitrate reductase Nitrite transporter, plastid Ferredoxin nitrite reductase, plastid Putative NADPH nitrite reductase, plastid
NIT1 NR NAR1 NIR NASB Phatr3_J26029 Phatr3_J54983 Phatr3_J13076 Phatr3_J12902 Phatr3_EG02286 Sulfite reduction Ferredoxin sulfite reductase, plastid SIR Phatr3_J9538 Integration of N into amino acids Ferredoxin-dependent glutamate synthase, fusion of large and small subunits, GOGAT
Synthase of glutamate synthase, GOGAT
Glutamate synthase, fusion of large and small subunits, GOGAT Glutamine synthase, GS Mito-GLTX GLTD Plastid-GLT GLNA Phatr3_J51214 Phatr3_J20342 Phatr3_J24739 Phatr3_J22357 Ornithine-Urea Cycle Ammonium-dependent carbamoyl-phosphate synthase, mitochondrial
Ornithine transcarbamylase, mitochondrial Argininosuccinate synthetase Argininosuccinate lyase Arginase Ornithine decarboxylase Ornithine cyclodeaminase/proline synthase Urease Agmatinase/polyamine synthase CPS III OTC ASUS ASL ARG ODC OCD URE AGM Phatr3_J24195 Phatr3_J30514 Phatr3_J21116 Phatr3_J34526 Phatr3_J38509 Phatr3_J12642 Phatr3_J54222 Phatr3_J29702 Phatr3_J40880 Cytosolic carbamoylation (pyrimidine synthesis) Glutamine-hydrolyzing carbamoyl-phosphate synthase, cytosolic CPS II Phatr3_EG01947 Nitric oxide signalling Nitric oxide associated protein, plastid
Homologue of a Nitric oxide synthase-interacting protein (E3 Ligase) Cytosolic Nucleic Acid Binding Protein
NADPH-cytochrome P450 reductase, NOS and SiR homologue
NOA - NAB1-Like PCR Phatr3_J40200 Phatr3_J46175 Phatr3_J15211 Phatr3_J45758
Color code LogFC range
< -0.9 -0.9 to -0.5 -0.5 to -0.25 -0.25 to 0.0 0.0 to 0.25 0.25 to 0.5 0.5 to 0.9 > 0.9
A
B
5 Nitrate NO3- NR Nitrite NO2 -NIR Ammonium NH3/NH4+ GLT GOGAT Glutamine Glutamate Carbamoyl-P CO2 OTC ASUS Citruline Arginino succinate Arginine Fumarate Urea CO2 1 2 3 URE ornithine ornithine 1 2 3 3Nitrite reduction into ammonium Ammonium incorporation into amino acids (glutamine/glutamate) via the GS/GOGAT pathway Ammonium incorporation into amino acids (arginine) via the ornithine-urea-pathway