Cenomanian (early Late Cretaceous) ammonoid faunas of Western Europe.
Part II: diversity patterns and the end-Cenomanian anoxic event.
Claude Monnet
1, Hugo Bucher
1, Gilles Escarguel
2& Jean Guex
31 Paläontologisches Institut und Museum der Universität Zürich, Karl Schmid Strasse 4, CH-8006 Zürich ; Claude.Monnet@pim.unizh.ch 2 UMR-CNRS 5125, Université Claude Bernard Lyon 1, 2 rue Dubois, F-69622 Villeurbanne Cedex ; Gilles.Escarguel@univ-lyon1.fr
3 Institut de Géologie et Paléontologie, BFSH-2, Université de Lausanne, CH-1015 Lausanne ; Jean.Guex@igp.unil.ch
Abstract
Diversity patterns of ammonoids are analyzed and compared with the timing of anoxic deposits around the Cenomanian/Turonian (C/T) boundary in the Vocontian, Anglo-Paris, and Münster basins of Western Europe. Differing from most previous studies, which concentrate on a narrow time span bracketing the C/T boundary, the present analysis covers the latest Albian to Early Turonian interval for which a high resolution, ammonoid-based biochronology, including 34 Unitary Associations zones, is now available. During the latest Albian-Middle Cenomanian interval, species richness of ammonoids reveals a dynamical equilibrium oscillating around an average of 20 species, whereas the Late Cenomanian-Early Turonian interval displays an equilibrium centered on an average value of 6 species. The abrupt transition between these two successive equilibria lasted no longer than two Unitary Associations. The onset of the decline of species richness thus largely predates the spread of oxygen-poor water masses onto the shelves, while minimal values of species richness coincide with the Cenomanian-Turonian boundary only. The decline of species richness during the entire Late Cenomanian seems to result from lower origination percentages rather than from higher extinction percentages. This result is also supported by the absence of statistically significant changes in the extinction probabilities of the poly-cohorts. Separate analyses of species richness for acanthoceratids and heteromorphs, the two essential components of the Cenomanian ammonoid community, reveal that heteromorphs declined sooner than acanthoceratids. Moreover, acanthoceratids showed a later decline at the genus level than at the species level. Such a decoupling is accompanied by a significant increase in morphological disparity of acanthoceratids, which is expressed by the appearance of new genera. Last, during the Late Cenomanian, paedomorphic processes, juvenile innovations and reductions of adult size dominated the evolutionary radiation of acanthoceratids. Hence, the decrease in ammonoid species richness and their major evolutionary changes significantly predates the spread of anoxic deposits. Other environmental constraints such as global flooding of platforms, warmer and more equable climate, as well as productivity changes better correlate with the timing of diversity changes and evolutionary patterns of ammonoids and therefore, provide more likely causative mechanisms than anoxia alone.
1. Introduction
Major biological crises are attributed to a variety of factors, whose respective contributions and interactions are often difficult to disentangle. Among these periods of major biotic change, the Cenomanian/Turonian Boundary Event (CTBE) has been recognized as a moderate mass extinction (Raup & Sepkoski 1986; Hallam & Wignall 1997) and is documented throughout both Tethyan and Boreal basins. For example, Harries & Little (1999) reported the extinction of 79% of the macroinvertebrate species and 93% of the ammonoid species in the Western Interior Basin. Foraminifera and rudists (shallow-water bivalves) were also amongst the principal victims (see summary by Hallam & Wignall 1997). On the other hand, the very existence of this extinction has been questioned by Gale et al. (2000) and Smith et al. (2001) who argued that it might largely result from a preservation bias generated by the spread of hemipelagic depositional environments onto the shelf in the Anglo-Paris Basin. The Late Cenomanian was also a period of high burial of organic matter, the so-called Oceanic Anoxic Event 2, and of high positive excursions in the carbon isotope record (Schlanger et al. 1987). The spread of anoxic to hypoxic bottom waters on platforms is commonly proposed as the major causal factor for the C/T Boundary (CTB) biotic crisis (e.g. Jarvis et al. 1988; Harries & Little 1999), with preferential removal of benthic taxa.
Our study focuses on the patterns of diversity and evolutionary responses of ammonoids and evaluates how these relate to the timing of anoxia and that of some other known abiotic events. The best possible biochronological accuracy is therefore desirable and is provided by the recent construction of a refined zonation by Monnet & Bucher (2002) for the Cenomanian and the Early Turonian of Western Europe. Enlargement of the investigated “time window” to a longer time interval such as the entire Cenomanian and Early Turonian appears necessary for a better understanding of the effects of the anoxic event in comparison to supposedly normal, background conditions.
2. Studied areas
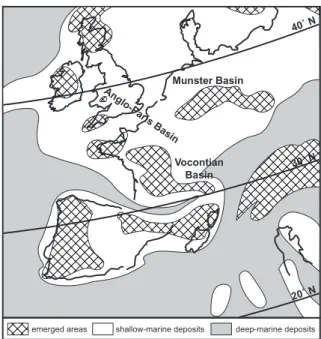
This study focuses on three epicontinental basins of Western Europe located on the northern Tethyan margin: the Vocontian Basin in southeastern France, the Münster Basin in northern Germany and the Anglo-Paris Basin (Fig. 1). Their ammonoid faunas are generally regarded as belonging to a Temperate realm with Boreal influence (Juignet & Kennedy 1976; Thomel 1992). None of the three basins was
disconnected from neighboring epicontinental seas or oceans during the studied time interval. Hence, they may reflect faunal changes that occurred at the larger paleogeographical scale of Western Europe.
The Cenomanian and Early Turonian hemipelagic deposits of the Vocontian Basin may locally attain 700m in thickness and are composed of marly limestones alternating with more or less silty marls. Organic-rich layers of the so-called Thomel level, which is thought to correlate with the Oceanic Anoxic Event 2, are only known from the most distal part of the basin (Crumière 1989). Foraminiferal age control indicates that the Thomel level was deposited at the base of the Archeocretacea Interval Zone (Grosheny & Malartre 1997). Although the intercalibration of foraminifera with ammonoid zones is in need of greater accuracy, the Thomel level is supposed to be of Juddii age (Crumière 1989).
The Münster and Anglo-Paris basins are mainly characterized by up to 170m of chalks, interrupted by a brief marly episode (Plenus Marls), sometimes enriched in organic matter, and spanning the Geslinianum zone. Although no typical black shales are known in the Anglo-Paris Basin, according to Jarvis et al. (1988), both sediments and benthic faunas strongly suggest oxygen-depleted deeper shelf environments during the Plenus Marls.
3. Data and metrics
This study relies on a recent zonation based on Unitary Associations (UAs), a deterministic and quantitative method established by Guex (1991). This
Anglo-P aris Basin Vocontian Basin Munster Basin deep-marine deposits shallow-marine deposits emerged areas 40˚ N 30˚ N 20˚ N
Fig. 1 - Cenomanian paleogeography of Western Europe (after Philip et al. 1993, modified and
new zonation (Monnet & Bucher 2002) is in good agreement with the widely used standard zonation of Wright & Kennedy (1984) in Western Europe, but its resolution is three times higher. The revised time frame includes a regional zonation for each separate basin and a synthetic zonation (Fig. 2). This improved time frame is based on a taxonomically revised database in which taxonomic inconsistencies are minimized (for details about the taxonomic standardization, see Monnet & Bucher 2002). It includes 55 genera and 110 species of ammonoids distributed among 34 UA-zones, from latest Albian to Early Turonian. Details of the biochronological revision, correlations between the three basins, analysis of diachronism as well as the database are given in Monnet & Bucher (2002).
Species richness is defined here as the number of ammonoid species occurring within a given UA-zone. Species richness is first counted
separately within each basin and then at the pooled level of the three basins. Counts of species richness are given for entire faunas, for acanthoceratids only, and for heteromorphs only. Species richness is presented with two different types of plots: classic diversity curves against the succession of UA-zones and phase diagrams (diversity at time t against diversity at time t+1). The latter representation makes it easier to visualize any dynamical trend during the entire studied time interval.
Originations and extinctions correspond to the number of species appearing (First Occurrence, FO) and disappearing (Last Occurrence, LO) between two successive UA-zones. Owing to the mode of construction of UA-zones (maximal sets of actually or virtually coexisting species, see Guex 1991), FOs and LOs are included into the separation interval between two consecutive UA-zones (discrete zonation). The percentage of origination is defined as the number of FOs divided by the total number of species occurring in the next overlying UA-zone. For example, in a pair of two consecutive UA-zones (UA-z1, UA-z2), with UA-z1 containing the set of species {a, b, c, d, e, f} and UA-z2 containing the set of species {d, e, f, g, h}, the percentage of origination is 2/5=0.4 and the percentage of extinction is 3/6=0.5. The turnover is defined as the sum of the number of originations and the number of extinctions (i.e., 5 in our arbitrary example). The percentage of turnover corresponds to the turnover divided by the total number of distinct species present in the two bracketing UA-zones (i.e. 5/8=0.625 in our arbitrary example). Finally, it should be noted that no distinction is made between pseudo and true originations because we are considering local, within basin originations, as well as new incoming migrants into the basin. When dealing with counts of species richness of nektonic or nektobentic organisms such as ammonoids, the most natural and “functional” biogeographical entity is that of a basin, whatever the origination mechanism and geographical provenance of taxa.
Further insights are provided by the poly-cohort analysis and the taxonomic distinctness at the pooled level of the three basins. Poly-cohort analysis is a classic analytic tool routinely used to graphically investigate and compare survivorship through time. A poly-cohort survivorship curve is a plot of the percentage of all taxa from a community defined at time t still existing at time t+dt (Van Valen 1973, 1979; Raup 1978, 1986). The poly-cohort curves’ log-linearity is statistically tested using two distinct approaches involving (i) the Epstein’s test for straightness (Epstein 1960a, b; see Raup 1975), and (ii) a new statistical procedure developed by one of us (G.E.) and which will be thoroughly described elsewhere. This new procedure, close to that already proposed by Foote (1988), is based on a Monte-Carlo
M nster Basin Anglo-Paris Basin Vocontian Basin Revised standard zones
(Monnet & Bucher 2002)
Early Rhotomagense Z. Dixoni Z. Saxbii sZ. Carcit. sZ. Jukesbrownei Z. Guerangeri Z. Geslinianum Z. unnamed Z. Juddii Z. Coloradoense Z. Dispar Z. Early Turonian Late Albian Middle Late
C
E
N
O
M
A
N
IA
N
Mantelli Z. 1 2 3 4 11 12 14 16 27 28 33 34 32 29 30 31 25 24 26 23 19 20 21 22 18 17 15 13 8 9 10 7 6 5 VB 1 VB 2 VB 3 VB 4 VB 19 VB 20 VB 26 VB 27 VB 28 VB 29 VB 30 VB 31 VB 34 VB 32 VB 33 VB 24 VB 25 VB 23 VB 21 VB 22 VB 18 VB 16 VB 17 VB 15 VB 13 VB 14 VB 7 VB 8 VB 5 VB 6 VB 9 VB 10 VB 11 MB 4 MB 6 MB 15 MB 11 MB 12 MB 9 MB 16 MB 17 MB 13 MB 14 MB 7 MB 8 MB 1 MB 2 MB 3 APB 9 APB 12 APB 15 APB 22 APB 19 APB 23 APB 24 APB 25 APB 29 APB 30 APB 28 APB 26 APB 27 APB 20 APB 21 APB 13 APB 14 APB 18 APB 16 APB 17 APB 10 APB 11 APB 7 APB 8 APB 4 APB 5 APB 2 APB 3 MB 10 MB 5 APB 6 APB 1 VB 12 UA-zones Nodosoides Z.Fig. 2 - Revised biochronological scale (after Monnet & bucher 2002). Thick vertical black bars
indicate uncertainty intervals in the correlations between the basins.
procedure of random re-sampling with replacement (non-parametric bootstrap) in order to estimate the confidence intervals linked to the observed survivorship percentages. As for the Epstein’s test, it first allows to globally test the departure of observed curves from the null expectation that, for a given ammonoid community, survivorship percentages are log-linearly arranged, i.e. that within poly-cohort extinction risk is stochastically constant through time. Then, if the alternate hypothesis is accepted, the event(s) of significant departure from stochastic fluctuations in observed survivorship percentages could be identified, thus providing additional information of interest not given by Epstein’s method.
The taxonomic distinctness method (Warwick & Clarke 1995, 1998, 2001; Clarke & Warwick 1998, 1999, 2001) processes Presence/ Absence data with two highly robust univariate indices based on taxonomic “distance” between taxa: the Average Taxonomic Distinctness index (AvTD, Clarke & Warwick 1998) and the Variation in Taxonomic Distinctness index (VarTD, Clarke & Warwick 2001). These two indices reflect the hierarchical structure underlying the studied assemblage of taxa by weighting the taxonomic levels of all pairs of taxa from the studied assemblage. Six taxonomic levels are here distinguished and linearly weighted: suborder (weight = 6), superfamily (weight = 5), family (weight = 4), subfamily (weight = 3), genus (weight = 2), and species (weight = 1). Thus, the taxonomic “distance” between any two species is the weight of their highest different taxonomic
level. For instance, if two species belong to the same suborder, superfamily and family, but to distinct subfamilies, then their taxonomic “distance” equals 3. AvTD is the arithmetic mean taxonomic “distance” (path length) between all pairs of species in a taxonomic tree and can be considered as a measure of taxonomic disparity for any given taxonomic assemblage. VarTD is the variance of AvTD and can be considered as a measure of taxonomic unevenness. These two indices have many strengths among which are their relative insensitivity to differences in taxonomic treatment and rigor between workers, sampling effort and taphonomic biases (unlike other numerous classic biodiversity indices). Moreover, they also appear to be biologically and ecologically meaningful. For example, detailed study of marine nematode assemblages has clearly proved AvTD to be positively related to trophic diversity (Warwick & Clarke 1998), while VarTD is likely to be negatively related to habitat diversity (Clarke & Warwick 2001). These two indices can also be statistically tested by bootstrapping (see Clarke & Warwick 1998, 2001) to detect non-random taxonomic structures in the studied assemblages, i.e. taxonomical assemblages with AvTD and/or VarTD values significantly higher or lower than what might be expected if taxa were randomly distributed through samples.
Early Early Turonian Late Albian Middle Late C E N O M A N IA N 34 | 33 32 31 30 29 | 28 27 26 25 | 24 23 | | | | 22 21 20 19 | 18| | | | | | 17 16 | 15 14 | 13 12 11 10 | 9 | 8 | 7 | 6 | 5 4 3 2 1
All taxa Vocontian basin
0 4 8 12 16 20 24 Species Richness A M nster Basin 0 4 8 12 16 20 24 Species Richness C Anglo-Paris Basin 0 4 8 12 16 20 24 Species Richness B Western Europe D Species richness 0 4 8 12 16 20 24
Fig. 3 - Plots of ammonoid species richness (see Fig. 2 for time frame and correlation). A: Vocontian Basin; B: Anglo-Paris Basin; C: M nster Basin; D: synthesis of the three basins.
4. Results
4.1. Counts of all taxa at the species level
Figure 3a-c shows the curve of species richness for all ammonite species within each basin for the latest Albian-Early Turonian. During this time span, the total species richness of the Vocontian, Anglo-Paris and Münster basins is 106, 82 and 42 taxa, respectively. In the Vocontian and Anglo-Paris basins, highest values persist during Early and Middle Cenomanian. Species richness then declines more or less abruptly around the Middle/Late Cenomanian boundary (MLCB). Finally, for the time span considered here, it reaches its minimum values during Early Turonian, shifting from an average value of 16 to 4. In the Münster Basin, the apparent earlier decline at the base of the Middle Cenomanian may largely be influenced by the comparatively poorer quality of the record around the MLCB. As the duration of the Late Cenomanian is estimated to about 1.2 my (Obradovitch 1993; Gale 1995), the consistent decrease of species richness observed in each basin
appears as a general protracted trend, which initiated at the MLCB. As noticed by Thomel (1992), a marked and abrupt decrease in abundance of ammonoids also occurred during the Late Cenomanian of Europe. Figure 3d also summarizes the general trends of species richness of all ammonoids at the pooled level of the three basins.
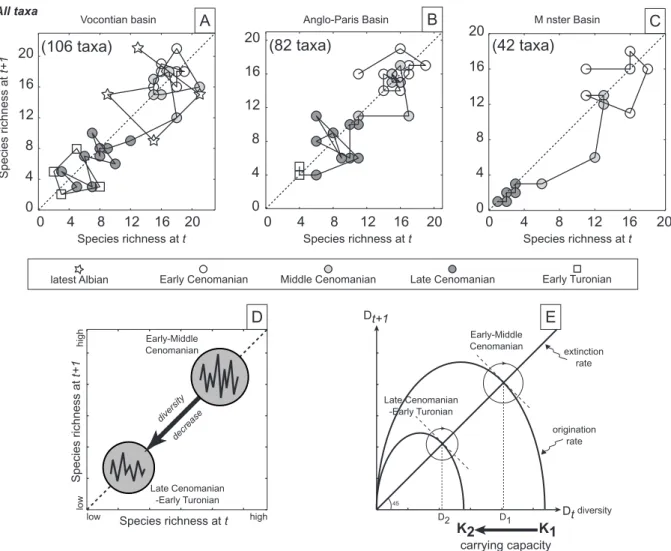
As well displayed by the phase diagrams for each of the three basins (Fig. 4a-c), fluctuations of species richness in time generally isolates two non-overlapping clusters. Within each basin, species richness rapidly shifts (within a time interval of about 2 or 3 UA-zones) from high to low value clusters around the MLCB. For the two best documented basins (Vocontian and Anglo-Paris), Late Cenomanian and Early Turonian values only partially overlap, Early Turonian ones being systematically at the low end of the cluster. Since there is a continuous species turnover, these two clusters suggest the presence of two successive dynamical equilibria separated by a threshold (Fig. 4d), which is strongly reminiscent of the logistic growth model of diversification (e.g. Carr & Kitchell 1980; Gotelli 1998; Kot 2001). According
All taxa Species richness at t+1 Vocontian basin Species richness at t 0 4 8 12 16 20 0 4 8 12 16 20 (106 taxa) A M nster Basin Species richness at t 0 4 8 12 16 20 0 4 8 12 16 20 (42 taxa) C Anglo-Paris Basin Species richness at t 0 4 8 12 16 20 0 4 8 12 16 20 (82 taxa) B Early-Middle Cenomanian Late Cenomanian -Early Turonian origination rate diversity extinction rate Dt Dt+1 carrying capacity 45 K2 K1 D2 D1 E high low high Species richness at t Species richness at t+1 low Early-Middle Cenomanian Late Cenomanian -Early Turonian diversity decrease D
latest Albian Early Cenomanian Middle Cenomanian Late Cenomanian Early Turonian
Fig. 4 - Phase diagrams of species richness for each basin. Phase diagrams express the relative trend of species diversity at the time t and t+1. See text for explanations.
to this model, a dynamical equilibrium of species richness may reflect the carrying capacity of each basin. The logistic model predicts such a sudden shift toward lower equilibrium values and accordingly, such a dropdown is interpreted as a thresholded
response caused by a decreasing carrying capacity. Along the lines of this model, the Late Cenomanian corresponds to lower carrying capacities for each of the basins (Fig. 4e).
Absolute values (bars) and percentages
1 .5 0 .5 1 1 .5 0 .5 1 1 .5 0 .5 1
Vocontian basin Anglo-Paris Basin M nster Basin
12 8 4 0 4 8 12
Extinction
Percentages
Values
Origination 12 Extinction8 4 0Origination4 8 12 12 Extinction8 4 0 Origination4 8 12
Early Early Turonian Late Albian Middle Late
C
E
N
O
M
A
N
IA
N
34 | 33 32 31 30 29 | 28 27 26 25 | 24 23 | | | | 22 21 20 19 | 18| | | | | | 17 16 | 15 14 | 13 12 11 10 | 9 | 8 | 7 | 6 | 5 4 3 2 1 All taxaA
B
C
0 .5 1 0 .5 1 0 .5 1Vocontian basin Anglo-Paris Basin M nster Basin
0 4 8 12 16 20 24
Percentages
Values
Turnover 0 4 8Turnover12 16 20 24 0 4 5Turnover12 16 20 24
Early Early Turonian Late Albian Middle Late
C
E
N
O
M
A
N
IA
N
34 | 33 32 31 30 29 | 28 27 26 25 | 24 23 | | | | 22 21 20 19 | 18| | | | | | 17 16 | 15 14 | 13 12 11 10 | 9 | 8 | 7 | 6 | 5 4 3 2 1D
E
F
Fig. 5 - Values (bars) and percentages (shaded areas) of extinction and origination (A-C) and turnover (D-F) of all ammonoids throughout the Cenomanian.
(shaded areas) of origination and extinction are plotted in Fig. 5a-c. Throughout the entire Cenomanian, absolute values of both origination and extinction fluctuate within a limited range. Highest extinction values occur in the Late Albian, in the early Middle Cenomanian, and at the MLCB, whereas highest origination values occur only in the Late Albian and in the early Middle Cenomanian. Therefore, the MLCB appears as a time of prevailing extinction in the Vocontian and Anglo-Paris basins. Average values per substages also suggest a weak prevalence of extinction during the Late Cenomanian. Percentages of origination and extinction closely match absolute values, except for those around the CTB where they reach their maximum value. Such a discrepancy between absolute values and percentages is produced by the comparatively reduced number of species around the CTB. After initiation of the decline of species richness at the MLCB, the protracted, decreasing trend in species richness was fueled by a slight unbalance in favor of extinctions. Hence, a sudden dropdown in origination or a catastrophic peak of extinction can be safely excluded.
Absolute turnover values (bars) and percentages of turnover (shaded areas) are plotted in Fig. 5d-f. The turnover is a measure of the intensity of the restructuration of the whole community, but alternatively, it may also be artificially increased by the presence of documentation gaps in the faunal successions. Absolute values of turnover show a brief peak around the Early/Middle Cenomanian boundary. However, this peak is probably spurious because late Early Cenomanian faunas (Dixoni Zone) are wanting in the Vocontian Basin and because a general hiatus in the sedimentation of Western Europe has long been recognized around this substage boundary (Kennedy & Hancock 1977). During the Late Cenomanian and Early Turonian, absolute values of turnover do not display any positive or negative trend, whereas percentages of turnover gradually increase because of the concomitant decrease in species richness.
4.2. Counts of acanthoceratids and heteromophs at the species level
The proportion of species per family present in our database is summarized in Figure 6. This pie chart clearly highlights the preponderance of the Acanthoceratidae, which amounts to 41% of the Cenomanian species in Western Europe. From our own field experience in the Vocontian Basin, this preponderance is even greater when considered in terms of relative abundance. Heteromorphs represent the second largest group, with 23% of the total number of species. Others groups or families have too low percentages for any reliable recognition
of trends during the Cenomanian. Hence, trends in species richness appear to be mainly governed by acanthoceratids and heteromorphs.
Species richness and origination-extinction of heteromorphs are displayed in Figure 7. The diversity curve (Fig. 7a) of these predominantly pelagic species shows a clear dropdown at the MLCB and a minimum value at the CTB as for the entire fauna (Fig. 3d). In the Late Albian and Early Cenomanian, more or less balanced bursts of originations and extinctions dampen out until extinctions become unbalanced by origination in the Middle Cenomanian (Fig. 7b). It is also worth noting that the MLCB and the CTB are both marked by moderate extinctions without any concomitant origination (Fig. 7b). Accordingly, pulsated percentages of turnover (Fig. 7c) decrease from the Albian-Cenomanian boundary to the MLCB, whereas the MLCB and latest Late Cenomanian peaks are mainly generated by extinctions. In Western Europe, the local disappearance of the Turrilitidae largely accounts for the MLCB extinction high among the heteromorphs.
Changes in species richness of
acanthoceratids (Fig. 8a) are also in good agreement with those of the global species curve (Fig. 3d), with high values during the Early-Middle Cenomanian and low values during the Late Cenomanian-Early Turonian. In the Early Cenomanian, the slow and sustained increasing species richness results from the combination of a moderate amount of origination with little or no extinction, thus leading to low percentages of turnover (Fig. 8b-c). The increasing trend of diversity is briefly interrupted at the end of the Early Cenomanian, which is marked by a first turnover peak. However, this turnover peak is likely to result from the generalized gap known at the EMCB. Increase of species richness resumes in the Middle Cenomanian and reaches its maximum in the early Late Cenomanian. The main decline of
Phylloceratidae (< 1%) Gaudryceratidae (< 1%) Tetragonitidae (< 1%) Brancoceratidae (3%) Forbesiceratidae (3%) Lyelliceratidae (3%) Acanthoceratidae (41%) Turrilitidae (8%) Hamitidae (3%) Baculitidae (5%) Anisoceratidae (2%) Heteromorphs (23%) Scaphitidae (5%) Pachydiscidae (< 1%) Desmoceratidae (3%) Schloenbachiidae (7%) Hoplitidae (4%) Pseudotissotiidae (2%) Vascoceratidae (10%) 110 taxa
Fig. 6 - Relative species richness of ammonoid families in the Cenomanian of Western Europe.
0 .5 1 Turnover 0 4 8 12 16 20 24 Western Europe
C
Early Early Turonian Late Albian Middle LateC
E
N
O
M
A
N
IA
N
34 | 33 32 31 30 29 | 28 27 26 25 | 24 23 | | | | 22 21 20 19 | 18| | | | | | 17 16 | 15 14 | 13 12 11 10 | 9 | 8 | 7 | 6 | 5 4 3 2 1 Species richness 0 4 8 12 16 20 24 Western Europe Extinction 12 8 4 0 4 8 12 Western Europe Origination Heteromorphs Percentages Values 1 .5 0 .5 1A
B
Fig. 7 - Diversity of the heteromorphs of Western Europe. A: species richness (curve); B: values (bars) and percentages (shaded areas) of extinction and origination; C: values and percentages of turnover.
Early Early Turonian Late Albian Middle Late
C
E
N
O
M
A
N
IA
N
34 | 33 32 31 30 29 | 28 27 26 25 | 24 23 | | | | 22 21 20 19 | 18| | | | | | 17 16 | 15 14 | 13 12 11 10 | 9 | 8 | 7 | 6 | 5 4 3 2 1Species richness Turnover
0 4 8 12 16 20 24 Western Europe Extinction 12 8 4 0 4 8 12 Western Europe Origination Acanthoceratids Western Europe 1 .5 0 .5 1 1 .5 0 .5 1 Values Percentages
A
B
C
0 4 8 12 16 20 24Fig. 8 - Diversity of the acanthoceratids of Western Europe. A: species richness; B: values (bars) and percentages (shaded areas) of extinction and originatio; C: values and percentages of turnover.
acanthoceratid species diversity occurs in the mid-Late Cenomanian, which clearly indicates a delay with respect to both the main decline of the global curve of species richness and the decreasing diversity of heteromorphs, both of these occurring around the MLCB (see Figs 3 and 7). This later diminution of acanthoceratid diversity is generated by the difference between extinction and origination, the latter being at its lowest values (Fig. 8b). The lowest diversity values span the late Late Cenomanian-Early Turonian time interval, in combination with peak values of percentages of turnover (Fig. 8c).
At the species level, additional insights on the diversity dynamics of acanthoceratids are also provided by the assessment of longevities (Fig. 9). Absolute durations of zones used for assessment of longevities are derived from correlations between the Western European succession and the well-calibrated Western Interior succession (Obradovitch 1993) and from the cyclostratigraphic interpretation of Gale (1995). The evolution of mean values of species longevity suggests a three steps pattern. A first plateau consisting of high mean values ranging between 2 and 3 m.y. spans the Early Cenomanian. It ends abruptly at the EMCB, and is followed by a second plateau with mean values between 1 and 1.5 m.y. during the entire Middle Cenomanian. This
significant decrease of mean longevities does not appreciably alter the range of minimal and maximal values. From the MLCB on, mean values gradually decrease until they reach their lowest limit around the CTB, with a drastic reduction of the range of minimal and maximal values. The Late Cenomanian is thus characterized by the presence of short-lived acanthoceratid species. This pattern is believed to be reliable because the possible bias introduced by the taxonomic treatment is in fact relatively minimal. The revision of the acanthoceratids (notably by Wright & Kennedy 1981, 1984,1987, 1990) is consistent throughout the studied interval and always takes intraspecific variation into account even during the Late Cenomanian (for example, see Kennedy et al. 1981; Thomel 1992).
4.3. Poly-cohort analysis
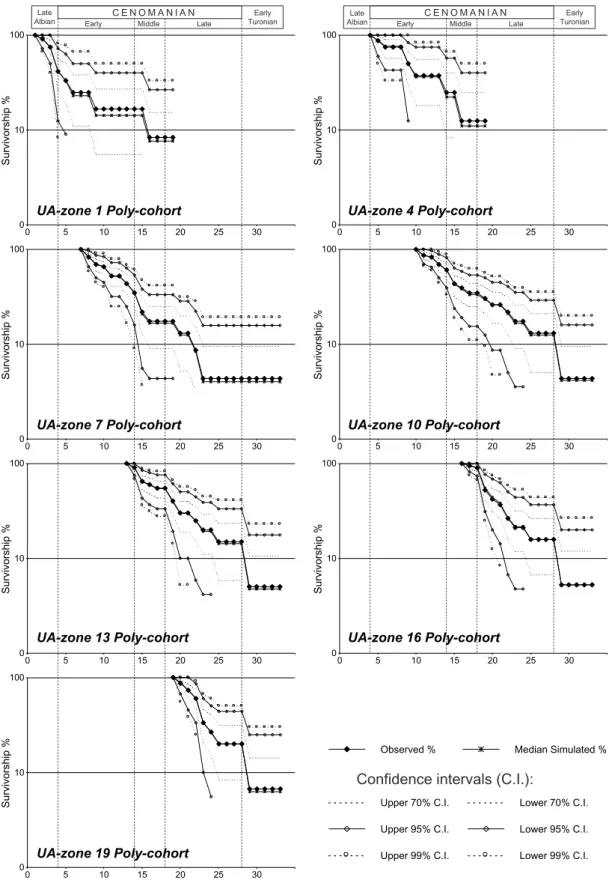
Some survivorship curves of poly-cohorts, with their bootstrapped statistical confidence intervals, are illustrated in Figure 10 (only 7 poly-cohorts are reported here, but the results are very similar for all others). For each poly-cohort, the two statistical methods used to test for log-linearity of survivorship curves demonstrate that all poly-cohorts of the entire studied time interval are not significantly non log-linear (H0 not rejected), which implies that, for a
given poly-cohort, the extinction risk is stochastically constant through time (earlier taxa have statistically the same risk of extinction as do later taxa). Consequently, these tests indicate that no statistically significant extinction phase can be detected during Cenomanian times on the basis of the poly-cohorts analysis. As previously hypothesized (see 4.1), this result supports the hypothesis that the observed dropdown of species richness during the Late Cenomanian results from of a lack of origination.
Although no significant change in the extinction rate of each separate poly-cohort can be demonstrated, it is nevertheless interesting to compare the timing of the fluctuations of percentages of extinction across all poly-cohorts. Figure 11 presents the contour intervals of the percentage of survivorship through time. This graph assesses the synchronism of fluctuations of percentages of extinction across all poly-cohorts. Such a plot implies that if all poly-cohorts have a constant extinction rate through time, then all contour lines should be statistically parallel to the “origination time” axis. On the other hand, horizontal contour intervals imply a concomitant increase of percentages of extinction across several poly-cohorts. Four episodes of increasing percentages of extinction simultaneously affect several poly-cohorts and are all concentrated in the Late Cenomanian, whereas no such events can be
Early Early Turonian Late Albian Middle Late
C
E
N
O
M
A
N
IA
N
34 | 33 32 31 30 29 | 28 27 26 25 | 24 23 | | | | 22 21 20 19 | 18| | | | | | 17 16 | 15 14 | 13 12 11 10 | 9 | 8 | 7 | 6 | 5 4 3 2 1 AcanthoceratidsSpecies longevity (m.y.)
0 1 2 3 4
min. max.
mean
Western Europe
Fig. 9 - Average longevity of acanthoceratid species of Western Europe.
detected during the Early and Middle Cenomanian. Despite the fact that the number of taxa in the Late Cenomanian is comparatively much smaller (therefore precluding any firm, statistically robust interpretation), this last result somewhat opens the
possibility that the Late Cenomanian restructuring of the ammonoid community may result not only from decreasing percentages of origination, but also from minor, synchronous extinction events.
UA-zone 1 Poly-cohort UA-zone 7 Poly-cohort UA-zone 13 Poly-cohort UA-zone 19 Poly-cohort UA-zone 10 Poly-cohort UA-zone 16 Poly-cohort UA-zone 4 Poly-cohort Early Early Turonian Late
Albian Middle Late
C E N O M A N I A N
Early
Early Turonian Late
Albian Middle Late
C E N O M A N I A N 0 10 100 Survivorship % 5 0 10 15 20 25 30 0 10 100 Survivorship % 5 0 10 15 20 25 30 0 10 100 Survivorship % 5 0 10 15 20 25 30 0 10 100 Survivorship % 5 0 10 15 20 25 30 0 10 100 Survivorship % 5 0 10 15 20 25 30 0 10 100 Survivorship % 5 0 10 15 20 25 30 0 10 100 Survivorship % 5 0 10 15 20 25 30
Observed % Median Simulated %
Lower 99% C.I. Lower 95% C.I. Lower 70% C.I. Upper 70% C.I. Upper 95% C.I. Upper 99% C.I.
Confidence intervals (C.I.):
Fig. 10 - Observed poly-cohort survivorship percentages and bootstrapped confidence intervals for 7 of the 34 UA-zones. These curves represent the percentage of species surviving through each successive UA-zone.
4.4. Taxonomic distinctness
Probability Distribution Functions of AvTD and VarTD under the null hypothesis of randomness of assemblages’ composition from a common taxonomical pool have been computed with the randomization procedure proposed by Clarke & Warwick (1998, 2001). Figure 12 illustrates these confidence intervals for our ammonoid database. These graphs underline the fact that the median simulated AvTD value under the null hypothesis of randomness is almost unchanged for species richness
greater than about five, while VarTD values are almost unchanged from ten species.
Changes of AvTD and VarTD through time and the curves of confidence intervals simulated by bootstrapping are illustrated in Figure 13. AvTD values are significantly higher than expected in UA-zones 3 and 5 (Albian-Cenomanian boundary), and significantly lower in UA-zones 20 and 22 (i.e. the Guerangeri Zone at the base of the Late Cenomanian). VarTD values are significantly higher than expected during the UA-zones 8 to 10 (Saxbii Subzone), 17 and 18 (Jukesbrownei Zone) and 20 to 22 (Guerangeri Zone). UA-zones 23 to 34 (late UA 1 UA 3 UA 5 UA 7 UA 9 UA 11 UA 13 UA 15 UA 17 UA 19 UA 21 UA 23 UA 25 UA 27 UA 29 UA 31 UA 33 Survivorship % ~ 100 to 67 % ~ 66 to 45 % ~ 44 to 30 % ~ 29 to 20 % ~ 19 to 14 % ~ 13 to 9 % ~ 8 to 6 % ~ 5 to 4 % ~ 3 to 0 % UA 1 UA 4 UA 7 UA 10 UA 13 UA 16 UA 19 UA 22 UA 25 UA 28 UA 31 UA 34 Origination time Existence time Early Early Turonian Late Albian Middle Late C E N O M A N IA N
Fig. 11 - Contour graph of the percentage of surviving species through time for all poly-cohorts.
See text for explanations.
Lower 1% AvTD/VarTD Lower 5% AvTD/VarTD Lower 30% AvTD/VarTD
Median AvTD/VarTD Upper 99% AvTD/VarTD Upper 95% AvTD/VarTD Upper 70% AvTD/VarTD
Observed AvTD/VarTD 0 1 2 3 4 5 6 7 0 5 10 15 20 25
Observed and Simulated AvTD values
Number of taxa 0 1 2 3 4 5 6 0 5 10 15 20 25 Number of taxa
Observed and Simulated VarTD values
Late Cenomanian-Early Turonian) have too low species richness for making statistically sound interpretations. The high AvTD values of the Albian-Cenomanian boundary suggest that there are too many taxa at the supra-familial level than expected under the null hypothesis of randomness, i.e. too many super-families in comparison to the observed species richness. Conversely, the low AvTD values of the early Late Cenomanian suggest that there are too few familial and supra-familial taxa in comparison to the number of species. This fact may correspond to the extinction of most heteromorphs and families such as Schloenbachiidae and Forbesiceratidae. Indeed, the Acanthoceratidae almost exclusively dominates ammonoid assemblages of the Late Cenomanian.
An interesting feature can be seen at the Middle/Late Cenomanian boundary: a significantly lower than expected AvTD and a significantly higher VarTD characterize the Guerangeri Zone. According to the ecologic meaning of these two indices (see Warwick & Clarke 1998; Clarke & Warwick 2001), this combination is diagnostic of ecosystems with low trophic diversity (low complexity of food webs) and limited habitat. Moreover, the “normal” AvTD values and higher VarTD of the Jukesbrownei Zone (late Middle Cenomanian) also suggest that degradation of the ecosystem began with reduction of the number of habitats (or number of ecologic niches) and was then followed by the lowering of trophic diversity. 4.5. Counts of acanthoceratids at the genus level Diversity, origination and extinction of acanthoceratids at the genus level are plotted in Figure 14. Diversity slowly increases throughout the entire Cenomanian in a step-like fashion and thus appears largely uncoupled with diversity at the species level (compare with Fig.
8). A first step occurs at the EMCB and a second one appears within the late Cenomanian (late Guerangeri Zone). The CTB is marked by a short-term dropdown with values close to those of the Early Cenomanian. Therefore, the diversity of acanthoceratids at the genus level reveals somewhat different trends than those observed at the species level. The most salient differences are (i) opposite trends around the EMCB, with an increasing number of genera and a dropdown of species richness, (ii) the delayed decline of genus richness in comparison with that of species richness in the Late Cenomanian. The latter decoupling reflects a significant increase in morphological disparity of NW European representatives of acanthoceratids, which is directly expressed at the genus level.
Ranges of NW European and North American genera are illustrated in Figure 15. The phylogenetic hypotheses between genera are compiled and partly reinterpreted from several contributions (Thomel 1972, 1992; Kennedy et al. 1980; Wright & Kennedy 1980, 1981, 1984, 1987, 1990; Kennedy & Wright 1985; Robaszynski et al. 1993; Cooper 1997, 1998). The phylogeny of the Acanthoceratidae is still largely amenable to further modifications, therefore most of the phylogenetic relationships illustrated in Figure 15 should be considered as a working hypothesis. A first large-scale pattern is the increasing number of genera paralleled by a decreasing longevity during the Late Cenomanian-Early Turonian time interval. A second feature of the Late Cenomanian acanthoceratids is the relative abundance of paedomorphic transformations (mostly progenetic dwarf offshoots) well exemplified by the Acanthoceras-Protacanthoceras lineage (Wright & Kennedy 1980; Kennedy & Cobban 1990). Although not all Late Cenomanian lineages can be interpreted as progenetic, reduction of adult size seems to have affected the majority of lineages. Juvenile innovations also occur, as illustrated by the
0 1 2 3 4 5 6 7 1 3 5 7 9 11 13 15 17 19 21 23 25 27 29 31 33 Observed AvTD/VarTD 0 1 2 3 4 5 6 1 3 5 7 9 11 13 15 17 19 21 23 25 27 29 31 33
Lower 1% AvTD/VarTD Lower 5% AvTD/VarTD Lower 30% AvTD/VarTD
Median AvTD/VarTD Upper 99% AvTD/VarTD Upper 95% AvTD/VarTD Upper 70% AvTD/VarTD
Observed and Simulated AvTD values
Successive UA-zones Successive UA-zones
Observed and Simulated VarTD values
Early
Early Turonian Late
Albian Middle Late
C E N O M A N I A N
Early
Early Turonian Late
Albian Middle Late
C E N O M A N I A N
Fig. 13 - Taxonomic Distinctness indices and their statistical variation through time. Arrows indicate times when the values are statistically significant.
inception of coronate, spinose morphologies as seen in the transition between Calycoceras (Calycoceras) and Lotzeites (see Wright & Kennedy 1990). A significant amount of paedomorphoses, juvenile innovations and size reductions seem to be concentrated throughout the European Late Cenomanian, therefore suggesting that evolutionary reactions at the origin of the main radiation phase of acanthoceratids were triggered by environmental cues predating the end-Cenomanian anoxic event.
5. Discussion
The Cenomanian/Turonian boundary event is usually considered as a moderate mass extinction event (Raup & Sepkoski 1986; Hallam & Wignall 1997; Harries & Little 1999). Because it is closely associated in time with the Oceanic Anoxic Event 2, the most frequently invoked kill mechanism is that of habitat destruction caused by the extension of oxygen-poor waters onto the shelves. Changes in benthic and nektonic communities have customarily been interpreted along this line of thought (e.g. Jarvis et al. 1988; Philip & Airaud-Crumiere 1991; Grosheny & Malartre 1997; Keller et al. 2001). Despite its worldwide recognition, some uncertainties remain about the intensity and selectivity of the end-Cenomanian mass extinction. The most radical view is that of Smith et al. (2001)
who suggested that the end-Cenomanian extinctions are only artifacts of gaps in the nearshore sedimentary record during the great transgression of the Late Cenomanian-Early Turonian. The results of our study of Western Europe ammonoids contrast with most of these interpretations. We find a decline in ammonoid species richness that is associated with the highest percentages of turnover, major evolutionary changes of acanthoceratids, as well as reduced longevities and size reductions of acanthoceratids.
Our results indicate that the dropdown in ammonoid species richness in NW Europe began around the Middle/Late Cenomanian boundary, not around the Cenomanian/Turonian boundary. Because the anoxia is undoubtedly of late Late Cenomanian age (late Geslinianum and Juddii zones), it is hardly possible to reconcile the diversity patterns of ammonoids with the timing of anoxia as a single causative mechanism. Although the timing of anoxia coincides with the minimum diversity of ammonoids in Western Europe, it cannot be interpreted as the initial and single cause responsible for their diversity dropdown (Fig. 16). Moreover, diversity declines also affected planktonic foraminifera and ostracod assemblages as early as the end of the Middle Cenomanian as documented by Babinot et al. (1998) in the Vocontian Basin and Rodriguez-Lazaro et al. (1998) in the western Basque Basin. These authors also pointed out that the end-Cenomanian time is mainly
Turnover 0 4 8 12 16 20 24
C
Western Europe 0 .5 1 Early Early Turonian Late Albian Middle LateC
E
N
O
M
A
N
IA
N
34 | 33 32 31 30 29 | 28 27 26 25 | 24 23 | | | | 22 21 20 19 | 18| | | | | | 17 16 | 15 14 | 13 12 11 10 | 9 | 8 | 7 | 6 | 5 4 3 2 1 Extinction 12 8 4 0 4 8 12 Origination Genus richness 0 4 8 12 16 20 24A
B
Western Europe Western Europe
Acanthoceratids
1 .5 0 .5 1
Values Percentages
Fig. 14 - Diversity of the acanthoceratids of Western Europe at the genus level. A: genus richness; B: values and percentages of extinction and originatio; C: values and percentages of turnover.
characterized by very high percentages of turnover, but not by a marked decrease of species richness. Last but not least, O’Dogherty & Guex (2002) also documented that after a period of stability during the Middle Cenomanian, a decline of radiolarian species richness occurred during the Late Cenomanian, while the C/T boundary is mainly characterized by a higher turnover rate. They also noted that the majority of Cenomanian radiolarian extinctions occurred earlier than the anoxia. Therefore, OAE2 probably participated in the disruption of marine ecosystems and contributed to extinctions, but different causes must be sought for the initiation of this biological crisis.
Among other factors frequently invoked for the CTBE is a change in productivity, nutrient supplies being a very important ecological factor in determining marine diversity (Valentine 1971). The Late Cenomanian is well known to be associated with a positive carbon isotope excursion (Fig. 16), which is documented in the three basins (e.g. Gale et al. 1993; Gale & Christensen 1996; Mitchell et al. 1996; Paul et al. 1999; Voigt 2000). A change of productivity is among the favored causes for this carbon excursion,
but there is no clear consensus on whether this excursion is linked to high (see Schlanger & Jenkyns 1976; Arthur et al. 1987) or low productivity (see DeBoer 1986; Paul & Mitchell 1994). Low productivity may lead to a diversity dropdown, but high productivity leading to eutrophication may cause a diversity dropdown as well (Hallock 1987; Rosenzweig 1995). Weissert et al. (1998) and Wilmsen (2000) suggest that positive carbon isotope excursions reflect warmer climate and higher nutrient levels leading to eutrophication of biota, which then contribute to the drowning of platforms by negatively influencing the carbonate budget of the depositional system. Until a clear understanding of why carbon isotopic concentrations vary, any firm link with diversity decreases cannot be established, even if the carbon isotope curve and the species richness curve show a strikingly similar trend. On the other hand, both the reduced coccolith abundance (Lamolda et al. 1994; Paul & Mitchell 1994) and the decreasing dinocyst abundance (Lamolda & Mao 1999) suggest a productivity decrease during the latest Cenomanian. Unfortunately, these studies encompass only the short time interval of the Cenomanian/Turonian boundary
Pseudocalycoceras
Eucalycoceras
Protacanthoceras
Cunningtoniceras Conlinoceras Paraconlinoceras
Tarrantoceras Acanthoceras Euomphaloceratinae Paramammites Acanthoceratinae --> V ascoceratidae 98 99 97 96 95 94 93 92 Early TURONIAN Early CENOMANIAN Late Middle Mantelli Z. Dixoni Z. Rhotomagense Z. Jukes-brownei Z. Guerangeri Z. Geslinianum Z. Juddii Z. unnamed Z. Nodosoides Z. Coloradoense Z. 100M.y . Latest ALBIAN Dispar Z. Calycoceras Thomelites Vascoceras Acompsoceras Sharpeiceras Mantelliceratinae Lyelliceratidae --> Acanthoceratidae Mantelliceras Stoliczkaia ? ? ? Euomphaloceras Morrowites Kamerunoceras Lotzeites Watinoceras Neocardioceras Dunveganoceras Pseudaspidoceras Plesiacanthoceras Texacanthoceras Metoicoceras Mammitinae Mammites Spathites Metasigaloceras
Revised standard zones (Monnet & Bucher 2002)
Fig. 15 - Proposed phylogeny of the Acanthoceratidae from latest Albian to Early Turonian. Grey bars: Western Interior Basin; Black
and, compared with the long-term ammonoid diversity pattern, no firm conclusion about the timing of the decreasing coccolith and dinocyst abundances can be reached. It remains to be investigated how far back in the Cenomanian this trend initiated and if it coincides or not with the Middle/Late Cenomanian boundary.
According to the ammonoid record of Western Europe, the MLCB coincides with the demise of the heteromorphs. These ammonoids are usually considered as microphagous and vertical scanners of the food-rich layers throughout the water column (Westermann 1996). Because variations in primary productivity would surely have a profound impact on such a trophic regime (Cecca 1997), it is tempting to relate their demise to a change in productivity. Such a hypothesis needs confirmation from other productivity markers such as coccoliths and dinocysts throughout the entire Cenomanian. Along the same line, it is worth noting that Rodriguez-Lazaro et al. (1996) documented a major biosedimentary event among foraminifera and ostracods at the MLCB, which they interpreted as resulting from paleoceanographic changes and a decrease of nutrient supplies in the Basque Basin.
Sea level changes are also commonly related to fluctuations in ammonoid species richness and turnover (e.g. Wiedmann 1988; House 1989; Becker 1993; Hoedemaeker 1995; O’Dogherty et al. 2000; Sandoval et al. 2001) but without a clear relationship on whether ammonoid diversity typically increases during transgression or regression. Even if the regression-extinction nexus is significantly more cited, both relationships are observed (Hallam & Wignall 1999). This non-direct relationship between sea level changes and ammonoid diversity have been already noted by Macchioni & Cecca (2002) and discussed by Cecca (2002). In Western Europe, the direct comparison between the third-order sequences (recently revised by Robaszynski et al. 1998) and ammonoid species richness does not show any obvious relationship. Indeed, the ammonoid species richness of Early-Middle Cenomanian remains almost steady throughout four sequences (Fig. 16). Nevertheless, we believe that the most relevant fact is the Late Cenomanian second-order transgression (Haq et al. 1988), which is known as the highest highstand of the Mesozoic (Hancock & Kauffman 1979). Such a high sea level resulted in a substantial expansion of shallow seas, in the drowning of
98 99 97 96 95 94 93 92 Early TURONIAN Early CENOMANIAN Late Middle Mantelli Z. Dixoni Z. Rhotomagense Z. Jukes-brownei Z. Guerangeri Z. Geslinianum Z. Juddii Z. unnamed Z. Nodosoides Z. Coloradoense Z. 2 3 4 5 OAE2 anoxia 24 20 16 12 8 4 0 Western European ammonoid species richness
(this study) LST TST HST sb mfs fs LSTTST HST sb mfs fs LST TST HST sb mfs fs LST TST HST sb mfs fs LST TST HST sb mfs fs LST TST HST sb mfs fs 1 2 3 4 5 6 3rd order sequences (after Robaszynski et al. 1998) carbon isotope composite curve (after Voigt 2000)
Fig. 16 - Sea level changes, carbon isotope changes and ammonoid species richness in Western Europe. Third order sequences and system tracts of the Anglo-Paris Basin after Robaszynski et al. (1998). Carbon isotope composite curve
platforms (Wilmsen 2000), and in a shift toward deeper-water environments in the Late Cenomanian (see Smith et al. 2001, Fig. 1). This flooding may have had several consequences among which the most obvious is a decreased partitioning of epicontinental seas. Such sea level changes may directly influence the endemism of ammonoid faunas and then their diversity (see Cecca 2002). For example, times of high sea level would allow increased interbasinal migrations leading to reduced provincialism (Cooper 1977), but the opposite case has also been documented (e.g. Bretsky 1973). Cooper (1977) already noted that the ammonoid faunas of Late Cenomanian are mostly cosmopolitan, but the absence of a recent ammonoid biogeographical analysis (taking into account the taxonomic revision of the Cenomanian faunas) precludes a detailed investigation of the relationship between endemism and diversity in our case. This substantial flooding may also have important climatic consequences: according to available global atmospheric circulation models, such flooding is accompanied by a more uniform climate with a drastically reduced seasonal contrast of sea surface temperature in the epicontinental seas (Fluteau 1999), as well as a reduction of the equator-to-pole sea surface temperature gradient (Poulsen et al. 1999). A more equable climate together with a weak geographical partitioning may have contributed to the homogenization of marine habitats, which in turn may have caused species richness to decline. This sea level rise also initiated poleward migration of warm surface waters (Johnson et al. 1996), thus favoring northward migration of tropical faunas. Among the ammonoid faunas, such a change is well exemplified by the Late Cenomanian northward migration of Tethyan taxa (e.g. vascoceratids) within the NW European realm, which was previously under a Boreal influence (e.g. schloenbachiids).
6. Conclusions
Analysis of the diversity dynamics of ammonoids in the Vocontian, Anglo-Paris and Münster Basins (Western Europe) reveals that major changes initiated as early as the Middle/Late Cenomanian boundary. The Early-Middle Cenomanian was a period of high species richness. The Late Cenomanian was characterized by a decrease in diversity (resulting mainly from non compensation of background losses by origination), a switch between two dynamic equilibria, and significant evolutionary changes of acanthoceratids (e.g. important decrease of their longevity and adult size). Hence, the decline of ammonoid diversity appears as a thresholded process around the Middle/Late Cenomanian boundary, which largely predates the known anoxic events at
the end of the Late Cenomanian. The C/T boundary itself only coincides with minimum values of species richness and highest percentages of turnover. These same trends emerge in each of the three studied basins, thus substantiating a general pattern at the Western European scale. Such trends were essentially dictated by the acanthoceratids and the heteromorphs, the first having concomitantly experienced a marked evolutionary radiation with the appearance of new genera containing few species each, while the second went locally extinct. Thus, anoxia cannot be interpreted as the initial and single cause that contributed to the decrease in ammonite species richness during the Late Cenomanian of Western Europe. Moreover, the Late Cenomanian evolutionary changes of acanthoceratids cannot be entirely and satisfactorily explained by the onshore migration of epicontental facies belts, thus differing from the case of benthic organisms (Smith et al. 2001).
Among other abiotic changes that may coincide with the Middle/Late Cenomanian boundary is the start of a general flooding and drowning of the platforms in Western Europe. In the Late Cretaceous context, which records the highest relative sea level ever documented, such a transgression may have been accompanied by important changes in oceanic circulation and productivity, a more uniform climate at mid-paleolatitudes and a decreasing partitioning of epicontinental seas, some of which may have potentially contributed to the decline of ammonoid diversity. Such an interpretation is also compatible with the higher degree of cosmopolitanism, as documented by the enlarged biogeographical distribution of North American as well as Tethyan taxa. Although such an interpretation is only drawn from the ammonoids, the timing of their diversity and evolutionary patterns do not support the C/T anoxic event as a single causative mechanism in this biodiversity crisis. The so-called CTBE thus appears to be a long-term crisis (~1 m.y.), which started at the Middle/Late Cenomanian boundary as indicated by the ammonoid record of Western Europe.
Acknowledgments
Stuart Gilder is thanked for improving the English text. This paper also benefited from constructive reviews by F. Cecca and J. Remane.
REFERENCES
Arthur, M.A., Schlanger, S.O. & Jenkyns, H.C. 1987: The Cenomanian-Turonian Oceanic Anoxic Event, II. Palaeoceanographic controls on organic matter production and preservation. In: Marine petroleum source rocks (Ed. by Brooks, J. & Fleet, A). Spec. Publ. geol. Soc. London 26, 401-420.
Babinot, J.F., Rodriguez-Lazaro, J., Floquet, M. & Jolet, P. 1998: Corrélations entre discontinuités sédimentaires majeures et crises biologiques chez les ostracodes du Sud-Ouest de l’Europe au Cénomanien. Mém. Centres Rech. Explor.-Prod. Elf Aquitaine 20,349-362.
Becker, R.T. 1993: Anoxia, eustatic changes, and Upper Devonian to lowermost Carboniferous global ammonoid diversity. Systematics Assoc. Spec. Vol. 47, 115-163.
Bretsky, P.W. 1973: Evolutionary patterns in the Paleozoic Bivalvia: documentation and some theoretical considerations. Bull. Geol. Soc. Amer. 84, 2079-2096.
Carr, T.R. & Kitchell, J.A. 1980: Dynamics of taxonomic diversity. Paleobiology 6, 427-443.
Cecca, F. 1997: Late Jurassic and Early Cretaceous uncoiled ammonites: trophism-related evolutionary processes. C. R. Acad. Sci. Paris 325, 629-634.
- 2002: Palaeobiogeography of marine fossil
invertebrates: concepts and methods. Taylor & Francis, 273p.
Clarke, K.R. & Warwick, R.M. 1998: A taxonomic distinctness index and its statistical properties. J. Appl. Ecol. 35, 523-531.
- 1999: The taxonomic distinctness measure of
biodiversity: weighting of step lengths between hierarchical levels. Mar. Ecol. Prog. Ser. 184, 21-29.
- 2001: A further biodiversity index applicable to
species lists: variation in taxonomic distinctness. Mar. Ecol. Prog. Ser. 216, 265-278.
Cooper, M.R. 1977: Eustacy during the Cretaceous: its implications and importance. Palaeogeogr. Palaeoclimatol. Palaeoecol. 22, 1-60.
- 1997: Towards a phylogenetic classification of the
Cretaceous ammonites. V. Euomphaloceratinae. N. Jb. Geol. Paläont., Abh. 203, 1-21.
- 1998: Towards a phylogenetic classification of the
Cretaceous ammonites. VI. Mammitinae. N. Jb. Geol. Paläont., Abh. 209, 217-230.
Crumière, J.P. 1989: Crise anoxique à la limite Cénomanien-Turonien dans le bassin subalpin oriental (Sud-Est de la France). Relation avec l’eustatisme. Geobios, mém. spéc. 11, 189-203.
De Boer, P.L. 1986: Changes in organic carbon burial during the Early Cretaceous. Spec. Publ. geol. Soc. London 21, 321-331.
Epstein, B. 1960a: Tests for the validity of the assumption that the underlying distribution of life is exponential. Part I. Technometrics 2, 83-101.
- 1960b: Tests for the validity of the assumption that
the underlying distribution of life is exponential. Part II. Technometrics 2, 167-183.
Fluteau, F. 1999: Impact de la tectonique des plaques sur le climat. Thèse, Univ. Paris VII – Inst. Phys. Globe Paris, France.
Foote, D.M. 1988: Survivorship analysis of Cambrian and Ordovician trilobites. Paleobiology 14, 257-271. Gale, A.S. 1995: Cyclostratigraphy and correlation of the
Cenomanian of western Europe. Spec. Publ. geol. Soc. London 85, 177-197.
Gale, A.S. & Christensen, W.K. 1996: Occurrence of the belemnite Actinocamax plenus (Blainville) in the Cenomanian of SE France and its significance. Bull. geol. Soc. Denmark 43, 68-77.
Gale, A.S., Jenkyns, H.C., Kennedy, W.J. & Corfield, R.M. 1993: Chemostratigraphy versus biostratigraphy: data from around the Cenomanian-Turonian boundary. J. geol. Soc. (London) 150, 29-32. Gale, A.S., Smith, A.B., Monks, N.E.A., Young, J.A.,
Howard, A., Wray, D.S. & Huggett, J.M. 2000: Marine biodiversity through the Late Cenomanian-Early Turonian: palaeoceanographic controls and sequence stratigraphic biases. J. geol. Soc. (London) 157, 745-757.
Gotelli, N.J. 1998: A primer of ecology. Sinauer Associates, 236p.
Grosheny, D. & Malartre, F. 1997: Stratégies adaptatives des foraminifères planctoniques et cortèges sédimentaires. Application au Cénomanien-Turonien du bassin du Sud-Est de la France. C. R. Acad. Sci. Paris 324, 491-497.
Guex, J. 1991: Biochronological correlations. Springer Verlag, 252p.
Hallam, A. & Wignall, P.B. 1997: Mass extinctions and their aftermath. Oxford University Press.
- 1999: Mass extinctions and sea level changes.
Earth-Science Reviews 48, 217-250.
Hallock, P. 1987: Fluctuations in the trophic resource continuum: a factor in global diversity cycles? Paleoceanography 2, 457-471.
Hancock, J.M. & Kauffman, E.G. 1979: The great transgressions of the Late Cretaceous. J. geol. Soc. (London) 136, 175-186.
Haq, B.U., Hardenbol, J. & Vail, P.V. 1988: The chronology of fluctuating sea levels since the Triassic. Science 235, 1156-1167.
Harries, P.J. & Little, C.T.S. 1999: The Early Toarcian (Early Jurassic) and the Cenomanian-Turonian (Late Cretaceous) mass extinctions: similarities and contrasts. Palaeogeogr. Palaeoclimatol. Palaeoecol. 154, 39-66.
Hoedemaeker, P.J. 1995: Ammonite evidence for long-term
sea-level fluctuations between the 2nd and 3rd order
in the lowest Cretaceous. Cretaceous Res. 16, 231-241.
House, M.R. 1989: Ammonoid extinction events. Phil. Trans. R. Soc. Lond. (Biol.) 325, 307-326.
Jarvis, I., Carson, G.A., Cooper, M.K.E., Hart, M.B., Leary, P.N., Tocher, B.A., Horne, D. & Rosenfeld, A. 1988:
Microfossil assemblages and the Cenomanian-Turonian (Late Cretaceous) oceanic anoxic event. Cretaceous Res. 9, 3-103.
Johnson, C.C., Barron, E.J., Kauffman, E.G., Arthur, M.A., Fawcett, P.J. & Yasuda, M.K. 1996: Middle Cretaceous reef collapse linked to ocean heat transport. Geology 24, 376-380.
Juignet, P. & Kennedy, W.J. 1976: Faunes d’ammonites et biostratigraphie comparée du Cénomanien du nord-ouest de la France (Normandie) et du sud de l’Angleterre. Bull. trimest. Soc. géol. Normandie & Amis Mus. Havre 6, 1-193.
Keller, G., Han, Q., Adatte, T. & Burns, S.J. 2001: Palaeoenvironment of the Cenomanian-Turonian transition at Eastbourne, England. Cretaceous Res. 22, 391-422.
Kennedy, W.J. & Cobban, W.A. 1990: Cenomanian micromorphic ammonites from the Western Interior of the USA. Palaeontology 33, 379-422.
Kennedy, W.J. & Hancock, J.M. 1977: Towards a correlation of the Cenomanian sequences of Japan with those of North-West Europe. Spec. Pap. palaeont. Soc. Japan 21, 127-141.
Kennedy, W.J., Juignet, P. & Hancock, J.M. 1981: Upper Cenomanian ammonites from Anjou and the Vendée, Western France. Palaeontology 24, 25-84. Kennedy, W.J. & Wright, C.W. 1985: Evolutionary patterns
in Late Cretaceous ammonites. Spec. Pap. Palaeont. 33, 131-143.
Kennedy, W.J., Wright, C.W. & Hancock, J.M. 1980: Origin, evolution and systematics of the Cretaceous ammonite Spathites. Palaeontology 23, 821-837. Kot, M. 2001: Elements of mathematical ecology.
Cambridge University Press, 442p.
Lamolda, M.A., Gorostidi, A. & Paul, C.R.C. 1994: Quantitative estimates of calcareous nannofossil changes across the Plenus Marls (late Cenomanian), Dover, England: implications for the generation of the Cenomanian-Turonian Boundary Event. Cretaceous Res. 15, 143-164.
Lamolda, M.A. & Mao, S. 1999: The Cenomanian-Turonian boundary event and dinocyst record at Ganuza (northern Spain). Palaeogeogr. Palaeoclimatol. Palaeoecol. 150, 65-82.
Macchioni, F. & Cecca, F. 2002: Biodiversity and biogeography of middle-late liassic ammonoids: implications for the Early Toarcian mass extinction. Geobios Mém. Spec. 24, 165-175.
Mitchell, S.F., Paul, C.R.C. & Gale, A.S. 1996: Carbon isotopes and sequence stratigraphy. In: High resolution sequence stratigraphy: innovations and applications (Ed. by Howell, J.A. & Aitken, J.F.). Spec. Publ. geol. Soc. London 104, 11-24.
Monnet, C. & Bucher, H. 2002: Cenomanian (early Late Cretaceous) ammonoid faunas of Western Europe. Part I: biochronology (Unitary Associations) and diachronism of datums. Eclogae geol. Helv. 95, 57-73.
O’Dogherty, L. & Guex, J. 2002: Rates and pattern of evolution among Cretaceous radiolarians: relations with global paleoceanographic events. Micropaleontology 48, 1-22.
O’Dogherty, L., Sandoval, J. & Vera, J.A. 2000: Ammonite
faunal turnover tracing sea-level changes during the Jurassic (Betic Cordillera, southern Spain). J. geol. Soc. (London) 157, 723-736.
Obradovitch, J.D. 1993: A Cretaceous time scale. In: Evolution of the Western Interior Basin (Ed. by Kaufman, W.G.E.). Spec. Pap. geol. Assoc. Canada 39, 379-396.
Paul, C.R.C. & Mitchell, S.F. 1994: Is famine a common factor in marine mass extinction? Geology 22, 679-682.
Paul, C.R.C., Lamolda, M.A., Mitchell, S.F., Vaziri, M.R., Gorostidi, A. & Marshall, J.D. 1999: The Cenomanian-Turonian boundary at Eastbourne (Sussex, UK): a proposed European reference section. Palaeogeogr. Palaeoclimatol. Palaeoecol. 150, 83-121.
Philip., J.M. & Airaud-Crumiere, C. 1991: The demise of the rudist-bearing carbonate platforms at the Cenomanian/Turonian boundary: a global control. Coral Reefs 10, 115-125.
Philip, J., Babinot, J.F., Tronchetti, G., Fourcade, E., Ricou, L.E., Guiraud, R., Bellion, Y., Herbin, J.P., Combes, P.J., Cornee, J.J. & Dercourt, J. 1993: Late Cenomanian (94 to 92 Ma). In: Atlas Tethys Palaeoenvironmental Maps (Ed. by Dercourt, J., Ricou L.E. & Vrielynck, B.). Gauthier-Villars, Paris, 153-178.
Poulsen, C.J., Barron, E.J., Johnson, C.C. & Fawcett, P. 1999: Links between major climatic factors and regional oceanic circulation in the mid-Cretaceous. Geol. Soc. Amer. Spec. Pap. 332, 73-89.
Raup, D.M. 1975: Taxonomic survivorship curves and Van Valen’s Law. Paleobiology 1, 82-96.
- 1978: Cohort analysis of generic survivorship.
Paleobiology 4, 1-15.
- 1986: Biological extinction in Earth history.
Science 231, 1528-1533.
Raup, D.H. & Sepkoski, J.J. 1986: Periodic extinction of families and genera. Science 231, 833-836. Robaszynski, F., Caron, M., Amédro, F., Dupuis, C.,
Hardenbol, J., Gonzalez Donoso, J.M., Linares, D. & Gartner, S. 1993: Le Cénomanien de la région de Kalaat Senan (Tunisie centrale): litho-biostratigraphie et interprétation séquentielle. Rev. Paléobiologie 12, 351-505.
Robaszynski, F., Gale, A.S., Juignet, P., Amédro, F. & Hardenbol, J. 1998: Sequence stratigraphy in the Upper Cretaceous series of the Anglo-Paris basin: exemplified by the Cenomanian Stage. Spec. Publ. Soc. econ. Paleont. Mineral. 60, 363-386.
Rodriguez-Lazaro, J., Elorza, J., Garcia-Garmilla, F., Garcia-Zarraga, E. & Pascual, A. 1996: Bioeventos paleoceanograficos en el Cenomaniense de la Cuenca Vasca occidental: senales micropaleotologicas y geoquimicas. Geogaceta 19, 76-79.
Rodriguez-Lazaro, J., Pascual, A. & Elorza, J. 1998: Cenomanian events in the deep western Basque Basin: the Leioa section. Cretaceous Res. 19, 673-700.
Rosenzweig, M.L. 1995: Species diversity in space and time. Cambridge University Press, 436p.
Sandoval, J., O’Dogherty, L. & Guex, J. 2001: Evolutionary rates of Jurassic ammonites in relation to sea-level
fluctuations. Palaios 16, 311-335.
Schlanger, S.O., Arthur, M.A., Jenkyns, H.C. & Scholle, P.A. 1987: The Cenomanian-Turonian Anoxic Event, I. Stratigraphy and distribution of organic
carbon-rich beds and the marine δ13C excursion.
In: Marine petroleum source rocks (Ed. by Brooks, J. &Fleet, A). Spec. Publ. geol. Soc. London 26, 371-399.
Schlanger, S.O. & Jenkyns, H.C. 1976: Cretaceous oceanic anoxic events: causes and consequences. Geol. en Mijnb. 55, 179-180.
Smith, A.B., Gale, A.S. & Monks, N. 2001: Sea-level and rock-record bias in the Cretaceous: a problem for extinction and biodiversity studies. Paleobiology 27, 241-253.
Thomel, G. 1972: Les Acanthoceratidae cénomaniens des chaînes subalpines méridionales. Mém. Soc. géol. France 116, 204p.
- 1992: Ammonites du Cénomanien et du Turonien du
sud-est de la France. Tome 2. Analyse systématique et paléobiologie. Serre Editeur, Nice.
Valentine, J.W. 1971: Resource supply and species diversity patterns. Lethaia 4, 51-61.
Van Valen, L. 1973: A new evolutionary law. Evol. Theory 1, 1-30.
- 1979: Taxonomic survivorship curves. Evol.
Theory 4, 129-142.
Voigt, S. 2000: Cenomanian-Turonian composite δ13C
curve for Western and Central Europe: the role of organic and inorganic carbon fluxes. Palaeogeogr. Palaeoclimatol. Palaeoecol. 160, 91-104.
Warwick, R.M. & Clarke, K.R. 1995: New ‘biodiversity’ measures reveal a decrease in taxonomic distinctness with increasing stress. Mar. Ecol. Prog. Ser. 129, 301-305.
- 1998: Taxonomic distinctness and environmental
assessment. J. Appl. Ecol. 35, 532-543.
- 2001: Practical measures of marine biodiversity
based on relatedness of species. Oceanogr. Mar. Biology annu. Rev. 39, 207-231.
Weissert, H., Lini, A., Follmi, K.B. & Kuhn, O. 1998: Correlation of Early Cretaceous carbon isotope stratigraphy and platform drowning events: a possible link? Palaeogeogr. Palaeoclimatol. Palaeoecol. 137, 189-203.
Westermann, G.E.G. 1996: Ammonoid life and habitat. In: Ammonoid paleobiology (Ed. by Landman, N.H., Tanabe, K. & Davis, R.A.). Topics in Geobiology, Plenum Press 13, 607-707.
Wiedmann, J. 1988: Plate tectonics, sea level changes, climate – and the relationship to ammonite evolution, provincialism, and mode of life. In: Cephalopods – Present and past (Ed. by Wiedmann, J. & Kullmann, J.). Schweizerbart’sche Verlagsbuchhandlung, 737-765.
Wilmsen, M. 2000: Evolution and demise of a mid-Cretaceous carbonate shelf: the Altamira Limestones (Cenomanian) of northern Cantabria (Spain). Sediment. Geol. 133, 195-226.
Wright, C.W. & Kennedy, W.J. 1980: Origin, evolution and systematics of the dwarf acanthoceratid
Protacanthoceras Spath, 1923 (Cretaceous
Ammonoidea). Bull. brit. Mus. nat. Hist. 34,
65-107.
- 1981: The Ammonoidea of the Plenus Marls and
the Middle Chalk. Monogr. palaeontogr. Soc. (London) 134, 148p.
- 1984: The Ammonoidea of the Lower Chalk. Part
1. Monogr. palaeontogr. Soc. (London) 137, 1-126.
- 1987: The Ammonoidea of the Lower Chalk. Part
2. Monogr. palaeontogr. Soc. (London) 139, 127-218.
- 1990: The Ammonoidea of the Lower Chalk. Part
3. Monogr. palaeontogr. Soc. (London) 144, 219-294.