HAL Id: hal-00304965
https://hal.archives-ouvertes.fr/hal-00304965
Submitted on 1 Jan 2004HAL is a multi-disciplinary open access archive for the deposit and dissemination of sci-entific research documents, whether they are pub-lished or not. The documents may come from teaching and research institutions in France or abroad, or from public or private research centers.
L’archive ouverte pluridisciplinaire HAL, est destinée au dépôt et à la diffusion de documents scientifiques de niveau recherche, publiés ou non, émanant des établissements d’enseignement et de recherche français ou étrangers, des laboratoires publics ou privés.
and ammonium distributions across a major UK basin,
the Humber
H. Davies, C. Neal
To cite this version:
H. Davies, C. Neal. GIS-based methodologies for assessing nitrate, nitrite and ammonium distributions across a major UK basin, the Humber. Hydrology and Earth System Sciences Discussions, European Geosciences Union, 2004, 8 (4), pp.823-833. �hal-00304965�
GIS-based methodologies for assessing nitrate, nitrite and
ammonium distributions across a major UK basin, the Humber
Helen Davies and Colin Neal
Centre for Ecology and Hydrology, Crowmarsh Gifford, Wallingford, OXON, OX10 8BB, UK
Email for corresponding author: [email protected]
Abstract
The distributions of nitrate, nitrite and ammonium at various monitoring sites across the Humber basin (area 24 000 km2) were examined
within a Geographical Information System (GIS) framework. This basin contains diverse characteristics, from areas of high population and industry to rural and arable regions. The Humber River is a major provider of nutrient fluxes to the North Sea from the UK. Within the GIS analysis, the distributions of mean and mean flow weighted concentrations, flux and flux per unit area, were investigated. Empirical relationships between land characteristics and water quality for the whole catchment draining to each water quality monitoring site were established.
Thirty-eight catchments were chosen for this analysis, with areas ranging from 46 km2 to 8225 km2. These catchments are distributed across
the Humber, encompassing the different conditions across the basin, thus allowing relationships between water quality and catchment characteristics to be used to estimate the nitrogen concentrations and flux throughout the basin river network. The main water quality data source was the Land Ocean Interaction Study (LOIS) dataset. The Environment Agency of England and Wales water quality datasets were used to infill areas of sparse LOIS monitoring network density within the Humber. The work shows the feasibility of estimating nitrate and, to a lesser extent, nitrite and ammonium concentrations and fluxes across the river network based on land characteristics, using a GIS methodology. The estimations work particularly well for the main river channels. However, there are local anomalies which are more difficult to predict. Maps showing concentration variations at 500 m intervals along the Humber basin river networks are presented; these are of particular value for environmental managers and socio-economists.
Keywords: GIS, nitrate, nitrite, ammonium, catchment characteristics
Introduction
The issue of nitrogen, mainly in the form of nitrate, nitrite and ammonium, within ecosystems is important in relation to the functioning of the terrestrial and freshwater environment (Neal, 2002). While under pristine conditions there may be a net balance for nitrogen, the human impact on this balance can be extensive. This is due to enhanced inputs from agriculture, industry and urban sources, which can lead to adverse biological effects such as exotic algal blooms and macrophyte growth in rivers and lakes (Wade
et al., 2002). Such issues are of importance at the local,
regional, national and continental scale (Neal, 2002). They extend beyond issues for freshwater basins to estuarine and coastal zones into which the rivers discharge (Pernetta and Milliman, 1995; Gren et al., 2000).
Within the United Kingdom, the issues of chemical transfers through river basins have been addressed in a major community research programme, the Land-Ocean Interaction Study (LOIS) (Leeks and Jarvie, 1998). The work is focused on inputs to the North Sea, a basin of European ecological significance, where there have been major concerns over pollution and ecological status (Jarvie et al., 1997a) and where there is now major focus on the socio-economics of environmental management as part of a European wide initiative, EUROCAT (European Catchments: Catchment Changes and their impacts on the coast: http:/www.iia-cnr.unical.it/EUROCAT/project.htm, Cave et al., 2003).
In this paper, data from LOIS and the Environment Agency of England and Wales are examined to show the range of
nitrogen concentrations and fluxes within the Humber basin. Using statistical analysis, the relationships between land characteristics and nitrate, nitrite and ammonium concentrations and fluxes are assessed. Within a GIS framework, these relationships are used to calculate concentrations and fluxes for any point across the Humber river network. Only water quality upstream of the river tidal limits will be investigated because of the difficulty of flux estimation in inter-tidal areas associated with bi-directional flow and the high degree of potential water-sediment interactions. This work is presented to extend earlier publications in the area in relation to spatial resolution within GIS frameworks (Oguchi et al., 2000; Jarvie et al., 2000) and as a base for developing environmental management policies within a EUROCAT setting for a major river basin entering the North Sea. Many previous papers have focused on the relationship between instream solute concentration and catchment characteristics (Edwards et al., 1990; Smart
et al., 2001; Jarvie et al., 1998) and regional loads
(Littlewood et al., 1998). However, this paper goes one step further and uses this information within a GIS to calculate water quality and fluxes at any unmonitored point along a river network.
Background
STUDY AREA: THE HUMBER
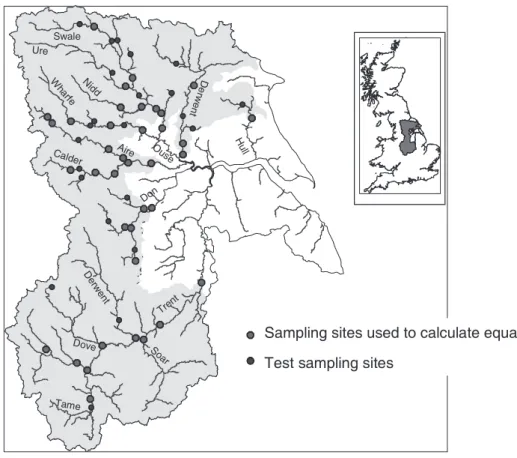
The Humber basin provides the largest single UK freshwater input to the North Sea. The two main drainage areas are the Ouse in the north and the Trent in the south, with a group of smaller rivers in the central-eastern parts of the catchment (Aire, Calder, Don and Wharfe), Fig. 1. The bedrock varies from sedimentary rocks of Carboniferous and New Red Sandstone age (sandstone, grit and limestone) in the upland areas, to the west of the region, and Jurassic and Cretaceous age rocks (sandstone and limestone) in the lowlands, to the east of the region (Jarvie et al., 1997b). The Humber basin has a variety of land-use types with large areas of intensive agriculture (the Trent and Ouse) and rural/open moorland of the Pennines and North York Moors (Swale, Ure, Nidd, Wharfe and Derwent). Manufacturing industry is concentrated within the central and southern areas of the Humber basin (Midlands, and South and West Yorkshire) (Jarvie et al., 2000). The most heavily industrialised rivers are the Aire and Calder which drain Leeds and Bradford, the Don (Sheffield), the Trent (Nottingham and Stoke-on-Trent) and the Tame and Soar (Trent tributaries) which drain Birmingham and Leicester, respectively.
Ure Nidd Swale W harfe Aire Calder Don Tren t H ull Ouse D erw en t Tame Soar Dove D erw ent
Sampling sites used to calculate equation Test sampling sites
WATER QUALITY DATA SOURCES
The water quality concentration data came from three sources:
l Land Ocean Interaction Study (LOIS) core monitoring programme;
l Harmonized Monitoring Scheme (HMN) data from the Environment Agency of England and Wales (EA); l EA river monitoring programme.
The most extensive network is the EA river monitoring programme, with the harmonised monitoring and LOIS datasets contributing less than 10% of the total number of monitoring sites. There are important differences between the three datasets, with the LOIS datasets providing an extensive range of chemical determinands and the most frequent monitoring (weekly). The HMN data also cover a wide range of chemical determinands but with lower frequency of measurement (weekly/fortnightly) and the EA dataset provides a much more limited and often sporadic sampling frequency (monthly to quarterly to highly intermittent). Within this study, an approximately equal number of LOIS, HMN and EA sites have been used for analysis (12, 13 and 13 monitoring sites, respectively). This corresponds to (a) the full site coverage for the LOIS and HMN and (b) a small subset of the EA dataset. The rationale was as follows:
l The main source was the LOIS core monitoring programme. These data cover the period 19931997 and the sites are located near flow gauging stations. The flow weighted mean concentration data were taken from Neal and Robson (2000). Details of the analytical chemistry methodologies used can be found in Leeks
et al. (1997);
l The HMN concentration data were used where the spatial distribution of LOIS data was sparse and where there was a flow gauging station nearby for flow weighted mean concentration and flux estimation. The HMN was instigated in 1974 and is ongoing. For the purpose of this study only mid-1990s data were used to coincide with the LOIS data period. Information on the HMS program can be found in Simpson (1980) while Robson and Neal (1997) and Jarvie et al. (1997b) cover some aspects of its success and limitation;
l Where there were still areas of sparse distribution of monitoring sites, the EA river monitoring programme data for the period 19931997 were used. Details of the analytical methods can be found in Neal et al. (1999). This dataset has a much denser spatial distribution containing many more sampling points than
the LOIS or HMN datasets. To obtain a good temporal distribution of readings, an extra criterion for site selection was to have more than 25 readings for each element at each site. A median of 59 readings was obtained from this dataset.
There are differences in sampling procedures among the three data sources which may affect the lower detection limits of nitrite and possibly ammonium. The selection criteria of a minimum number of readings per site limits most influences due to different sampling periods (e.g. weekly, monthly). The time series datasets were compared visually for consistency and from this it was considered that for the present purpose the time series data sets are comparable.
Land characteristics and water quality
SPATIAL DISTRIBUTIONS OF DISSOLVED NITROGEN
General spatial distributions of concentrations and flux were assessed across the Humber by statistical summary analysis and by plotting the data within a GIS.
The results show that on a general basis:
l Nitrate accounts for over 90% of the total dissolved nitrogen for most sites, with only the Rother and Calder showing contributions of ammonium greater than 20%. Nitrite accounts for only 0.4 to 3% of the dissolved nitrogen in the Humber;
l The spatial pattern, across the Humber, shows high concentrations and fluxes of total dissolved nitrogen (TDN) in the industrial areas; Calder/Aire, Trent and Rother/Don;
l Low concentrations and fluxes of TDN are exhibited in the Wharfe, Derwent and upper catchments.
In terms of the distribution of the various nitrogen species, the following patterns are observed.
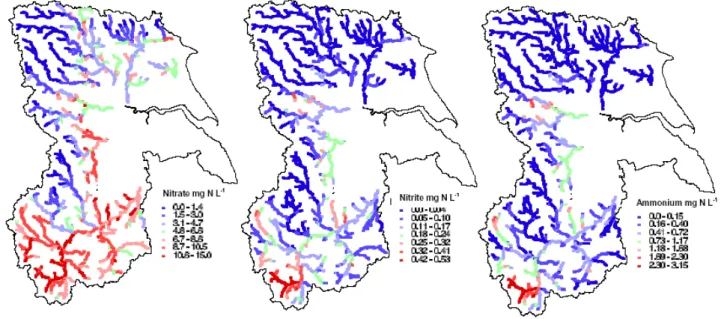
Nitrate
The highest concentrations are in the Soar and Tame which are part of the upper Trent catchments (1011.5 mg N L1)
and in the Dearne and Don. Lowest concentrations are in the Wharfe (1.21.9 mg N L1) and upper Calder/Aire and
Ouse catchments. The total nitrate fluxes are four times higher in the Trent (20000 t N yr1) than the Aire, which has
the next highest nitrate flux. Lowest fluxes are in the upper Calder/Aire and Ouse catchments (200400 t N yr1). The
Beck (Calder tributary) and the mid-Aire before it joins the Calder (3044 kg N ha1 yr1. The lowest fluxes of nitrate
per km2 are in the Wharfe and upper Calder (1012 kg N
ha1 yr1). Nitrite
The highest nitrite concentrations are in the lower Calder, lower Aire, Rother, Dearne and Tame (0.20.3 mg N L1).
The lowest concentrations are in the upper Aire and upper Ouse and Wharfe (0.01 mg N L1). The highest fluxes are in
the lower Trent and Aire (233268 t N yr1) and the lowest
fluxes are in the upper catchments and the Hull (3 8 t N yr1).
Correspondingly, the highest nitrite fluxes per km2 are in
the Calder and lower Aire (1.11.6 kg N ha1 yr1). The lowest
fluxes per km2 are in the Derwent, Hull and upper Ouse
catchments (0.060.12 kg N ha1 yr1). Ammonium
The highest concentrations are in the Calder and Don (1.9 2.5 mg N L1), especially the Rother in the upper Don. The
Tame in the Trent catchment also has high concentrations (1 mg N L1). The lowest concentrations are in the upper
Ouse (Swale), and Wharfe (0.030.06 mg N L1). The
highest total fluxes are in the Calder (1413 t N yr1), which
also influences the lower Aire. The Trent also exhibits high fluxes but these are only half those observed in the Calder. The lowest fluxes occur in the Hull, upper Ouse, and the Wharfe (1360 t N yr1) catchments. The highest fluxes per
km2 are in the Calder and Aire (515 kg N ha1 yr1). The
Rother and Tame also exhibit high values. Lowest fluxes per km2 are in the Wharfe, Derwent, Hull, Swale (0.25
0.40 kg N ha1 yr1).
LAND CHARACTERISTICS CLASSIFICATION
To complement the assessment of the spatial distribution of dissolved nitrogen water quality across the Humber, catchment characteristics were investigated to assess the relationships between selected catchment characteristics and water quality. The CEH Land Cover Map 2000 (LCM2000) 25 m raster dataset provided the data for this assessment.
In an earlier study, Jarvie et al. (2002) found it was possible to identify four prime groupings of land characteristics within the Humber. These groupings were: l Lowland arable. Land characteristics in this group
comprise arable land and calcareous geology. These characteristics show a positive correlation and a strong negative relationship with elevation;
l Urban. Land characteristics in this group comprise urban cover and population density;
l Upland. Upland land characteristics comprise elevation, rainfall, slope, upland vegetation and rough grazing; l Coniferous woodland.
For this study, the groupings of arable, urban and upland were considered the most relevant to the distribution of dissolved nitrogen in the river network: coniferous woodland was excluded because of its relative scarcity across the Humber. The 26 land cover classes of the LCM2000 dataset were aggregated to form these three new groupings where applicable.
DISTRIBUTION OF LAND CHARACTERISTICS Urban
The highest percentages of urban area are in the Spen Beck, Tame, Don (Rother in particular) and mid-Aire catchments (2042%). The Upper Ouse (Swale), Derwent, Ure, Trent Derwent and Hull have the lowest urban percentages (1 4%). For this study the LCM2000 aggregate class called built up areas and gardens was placed in this category.
Arable
The catchment with the highest percentage of arable cover is the Hull with greater than 70%. Also highly agricultural are the Derwent and Soar. The lowest percentages are found in the upper catchments such as the Swale and also in the Aire and Wharfe where only 10% is arable cover. For this study the LCM2000 aggregate class arable horticulture was placed in this category.
Upland/semi-grass
Higher percentages of upland/semi-grass cover occur in the upper catchments except for the Trent: the Trent has the lowest proportion of upland regions and drains Birmingham in its headwaters. The two LCM2000 aggregate classes of mountain, heath, bog and semi-natural grassland were grouped into this one characteristic as there was a positive correlation between the two and this grouping coincides with
Table 1. Humber land use characteristics (%)
Site Arable Urban Upland/semi-grass
HUMBER 39 13 16 Ouse 33 5 32 Wharfe 9 4 52 Don 23 26 20 Trent 28 17 14 Derwent 43 3 21 Hull 72 2 5 Aire 11 22 33
similar groupings for upland in Jarvie et al. (2002). Table 1 shows the percentage of each land characteristic, used for determining nitrogen water quality, in each major catchment.
RELATIONSHIPS BETWEEN LAND
CHARACTERISTICS AND NITRATE, NITRITE AND AMMONIUM
The relationships between water quality and the catchment characteristics were assessed using linear regression analysis, within Microsoft Excel. Table 2 illustrates the relationship between land characteristics and nitrate, nitrite and ammonium concentrations and flux per unit area across the Humber. The main features are:
l the strongest correlations are between urban and nitrate, nitrite and ammonium;
l nitrate is the only dissolved nitrogen component studied to show a correlation with the percentage arable cover; the relationship is positive;
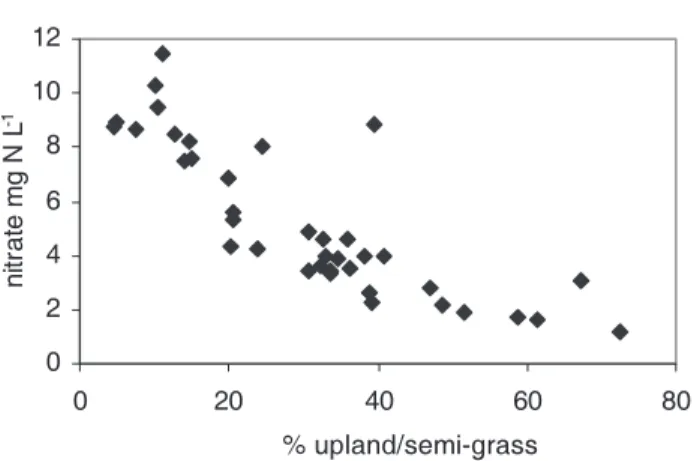
l nitrate and, to a lesser extent nitrite, show a negative correlation with upland/semi-grass cover; this relationship appears to be non-linear (Fig. 2).
Methods of nitrogen concentration
and flux estimation
To estimate nitrate, nitrite and ammonium concentrations and fluxes across the Humber, a GIS method was developed, using relationships with land characteristics. The main method investigated was to estimate mean concentrations. However, this method has been adapted to look also at the suitability of flux estimation.
MULTI-REGRESSION ANALYSIS OF MEAN
CONCENTRATIONS AND LAND CHARACTERISTICS
To obtain a general regression equation for the relationship between mean streamwater concentrations of nitrate, nitrite and ammonium and the three land characteristics, a multi-regression analysis was performed. Because of the non-linear relationship between dissolved nitrogen and the percentage of upland, the regression analysis used log transformed data; a standard multi-regression analysis would have resulted in unacceptable negative nitrate concentration values in upland areas due to the non-linear behaviour. The statistical relationships (N=38) observed are as follows: Nitrate. R= 0.975, p<0.001
Ln(conc) = ln(A)*(0.152(±0.028)) +ln(U)*(0.333 (±0.024)) - ln(UP)*(0.405(±0.045)) + 1.748*(±0.223)
(1)
Nitrite. R= 0.893, p<0.001
Ln(conc) = ln(A)*(0.08(±0.095)) + ln(U)*(0.834 (± 0.081)) - ln(UP)*(0.118(±0.153)) 4.196*(±0.749)
(2)
Ammonium. R= 0.849, p<0.001
Ln(conc) = ln(A)*-(0.051(±0.144)) + ln(U)*(1.118 (±0.122))+ln(UP)*(0.225(±0.232)) 4.35(±1.137)
(3)
where conc = mean concentration, mg L N1, A = arable %, U = urban %, UP = upland % and the ± indicates twice the
standard error.
The analysis shows highly significant correlations for all three of the components of nitrogen with the land characteristics.
GIS ANALYSIS: FROM FIXED LOCATION TO REGIONAL DISTRIBUTIONS OF NITROGEN SPECIES
To extrapolate the results for specific parts of the Humber to the basin as a whole, the multi-regression equations
0 2 4 6 8 10 12 0 20 40 60 80 ni tr ate m g N L -1
Fig. 2. The relationship between streamwater Nitrate concentrations and % upland/ semi-grass cover in river systems draining the Humber
Table 2. R2 values for relationships between land characteristics
and mean concentrations. The (+) and (-) terms relate to positive and negative relationships respectively.
Land Nitrate Nitrite Ammonium
characteristic mg N L-1 mg N L-1 mg N L-1
Urban 0.659 (+) 0.789 (+) 0.726 (+)
Arable 0.452 (+) 0.036 (+) 0.191 (-)
Upland/ semi-grass 0.795 (-) 0.294 (-) 0.019 (-)
calculated were used to estimate the mean concentrations for nitrate, nitrite and ammonium at each 500 m stretch of main river channel within the Humber basin. Within a GIS framework, the arable, urban and upland/semi-grass percentages were extracted for the catchment area at each point along the river network, resulting in 10 987 points. The regression equations were applied to the land characteristics data at each point to provide concentrations across the river network. The results of this exercise are shown in Fig. 3.
The smallest achievable interval for concentration estimation in this study is 50 m. However, due to computer processing limitations a larger reach distance was required and for the present purpose, 500 m was considered sufficient as, in relation to the Humber basin, changes were relatively small over such a distance. The smallest possible interval is limited by the resolution of the land use and Digital Terrain Model (DTM) raster datasets. The DTM data are used to calculate the river network and catchment boundaries.
The scale of the water quality river network generated is adaptable. For this analysis, tributaries were included down to a catchment area of 25 km2. This is an approximate
threshold below which localised influences have more significance and the simplistic groupings of land-use types is insufficient to explain the small scale variations (Wade et
al., 1999).
VERIFICATION OF ESTIMATED MEAN CONCENTRATIONS
The predicted and observed concentrations at the 38
sampling points, mentioned previously, were plotted to test the accuracy of the nitrate, nitrite and ammonium regression equations. The resulting regression equations show good correlations between the predicted and observed, particularly for nitrate:
Nitrate. R = 0.952, p<0.001 mean concentration = predicted
concentration*(0.963(±0.028)) + 0.232 (±0.321) (4)
Nitrite. R = 0.800, p<0.001
mean concentration = predicted concentration
*(1.27(±0.158)) + 0.002 (±0.019) (5)
Ammonium. R = 0.720, p<0.001
mean concentration = predicted concentration
*(0.91(±0.144)) + 0.04 (±0.12) (6)
All concentrations are in mg N L1
In addition to this analysis, estimated and observed data were compared for sites not used in the multi-regression analysis of mean concentrations and land characteristics, as shown in Fig. 4. Twenty sites across the Humber were taken from the Environment Agency dataset for this analysis. These sites were chosen for their spatial variability, representing different characteristics, across the catchment and because they had more than 25 samples per site for each of the nitrogen components within the 1990s study period. The distributions of these sites, as well as the sites used within the regression equations are shown in Fig. 1.
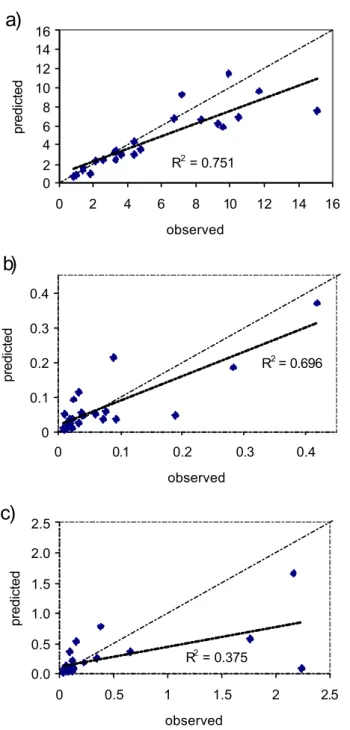
Comparison of the predicted with the observed concentration data shows that for the main river network nitrate concentrations are estimated favourably from the land use characteristics. However, in some tributaries, such as the Foss and Wiske (tributaries of the Ouse) the nitrate values are underestimated. Nunwick Beck, a tributary of the Ure, in particular, is double the estimated concentration (Fig. 4), but if this point is ignored r2 = 0.824. This sampling point is
on a small tributary and shows how anomalies will be found, especially as some monitoring points will be placed in areas
where there is a specific local environmental management problem. In general the pattern of estimated nitrate distribution across the river network fits in well with the observed values and the correlation is significant at the 99.9% level.
Nitrite concentrations are reasonably well estimated from the land characteristics (p< 0.001), Fig. 4; however, susceptibility to inaccuracies in the observed data due to differences in sampling techniques and varying detection limits are increased because of the small nitrite concentrations being measured. In contrast, the fit of ammonium is much poorer, particularly in the under-estimation of higher observed concentrations. This is to be expected owing to the highly intermittent nature of the signals within the river which is probably associated with irregular local point source pollutants and the possibility of within-river processing and attenuation.
FLOW-WEIGHTED CONCENTRATION ESTIMATION
So far, the relations between mean concentrations and catchment characteristics have been described. However, there is a case for examining flow-weighted mean concentrations to see if the method will smooth out extremes that often occur at low flows, while at the same time providing data much more representative of mean flow conditions. This exercise reveals that flow-weighted concentrations and mean concentrations are closely correlated, as substantiated by the regression equations below. The analysis is based on the same 38 sites as used in the regression equation of mean concentrations and land characteristics. Nitrate. R= 0.936, p<0.001 Mean_concentration = fw_concentration*(1.052(±0.046)) + 0.006 (±0.27) (7) Nitrite. R= 0.901, p<0.001 Mean_concentration = fw_concentration*(1.329(±0.073)) + 0.003 (±0.009) (8) Ammonium. R= 0.902, p<0.001 Mean_concentration = fw_concentration*(0.926(±0.051)) + 0.036 (±0.047) (9) All concentrations in mg N L1
Fig. 4. Comparisons between observed and predicted streamwater (a) nitrate, (b) nitrite and (c) ammonium concentrations (mg N L1)
R2 = 0.751 0 2 4 6 8 10 12 14 16 0 2 4 6 8 10 12 14 16 observed predicted R2 = 0.375 0.0 0.5 1.0 1.5 2.0 2.5 0 0.5 1 1.5 2 2.5 observed predicted
b)
c)
R2 = 0.696 0 0.1 0.2 0.3 0.4 0 0.1 0.2 0.3 0.4 observed predicteda)
FLUX ESTIMATION METHODS
Two methods of total flux estimation across the river network were used:
Firstly, multi-regression equations, calculated from the land characteristics and the 38 sample points of weighted mean concentrations, were used to estimate flow-weighted mean concentrations at each point along the Humber river network. Fluxes were estimated by combining these estimated flow-weighted mean concentrations with river flow estimates at each point on the water quality network. To calculate river flow at each point on the network, a non-linear relationship between catchment area and flow was derived, Fig. 5, thereby allowing this method of flux estimation to be feasible. The river network of flux estimates produced by this method is shown in Fig. 6. There was the possibility of using a simpler linear model but this would result in greater differences in fit at medium and high flows due to the limited number of observations at these flows.
The equation for the relationship between flow and catchment area in the Humber is:
Flow (ms-1) = 0.5718*(catchment area)2 +
38.075*catchment area + 190.63 (10) where catchment area is in km2 and R = 0.986
Secondly, flux estimation can be undertaken using the flux per km2 for the 38 sampling points. For this the flux for
each sampling point is calculated using:
Annual Flux = K.(S[ci.qi] /Sqi).qannual (11)
Where, K is a conversion factor to account for the period of flux estimation and the dimensions of the concentration and flow units used for the calculation, while ci and qi represent,
respectively, the concentration (mg N L1) and flow values
(m s1)for samples collected at time i. The S term represents
a summation for all values of concentration and flow during the monitoring period (n sampling points: i = 1 to n) and qannual is the long-term mean annual flow (m s1), in this case
the 19921997 period. The S[ci.qi] /Sqi term represents the
flow weighted mean concentration, Neal and Davies (2003). Annual flux is provided in t N yr1.
The Environment Agency daily flows used to estimate the flux is for the same period as the water quality data, i.e. 1992 1997. For flow estimation at the sampling points the difference in catchment area between the water quality station and nearest flow gauging station is mostly less than 3%. Only six stations have a difference of >10%. The biggest difference is 23% for the Aire at Carleton. To calculate the flow at these water quality points the flow was scaled by
0 1000 2000 3000 4000 5000 6000 7000 8000 9000 0 20 40 60 80 100 catchment area km2 Fl ow m s -1
Fig. 5. Relationship between catchment area and river flow for rivers draining into the Humber
Fig. 6. Nitrate, nitrite and ammonium flux variations across the Humber rivers.
Ammonium t N yr-1 0-28 28-85 85-174 174-338 338- 569921246.3 921-1678 Nitrate t N yr-1 0-483 484-1831 1831-2441 2442-3807 3808-5702 5703-14583 14584-21754 Nitrite t N yr-1 0-6.0 7.0-20.4 20.5-39.0 39.1-74.1 74.2- 116.3 116.4-246.3 246.4-358.9
the catchment area from the nearest gauging station. It would not be possible to use these flux results directly with the land characteristics because the flow component distorts the relationships: therefore, the flux per km2
(converted to ha) is estimated for each sampling point using the catchment area at that point.
Relationships between the flux per km2 at each sampling
point and the land characteristics are investigated. The multi-regression r2 values for the positive relationships between
land characteristics and nitrate, nitrite and ammonia flux per km2 are 0.829, 0.857 and 0.875 respectively. The
multi-regression results, in combination with the catchment area at each point along the network, allows for the actual flux to be estimated. The DTM is used to estimate the catchment area at each river network point.
FLUX ESTIMATION ACCURACY
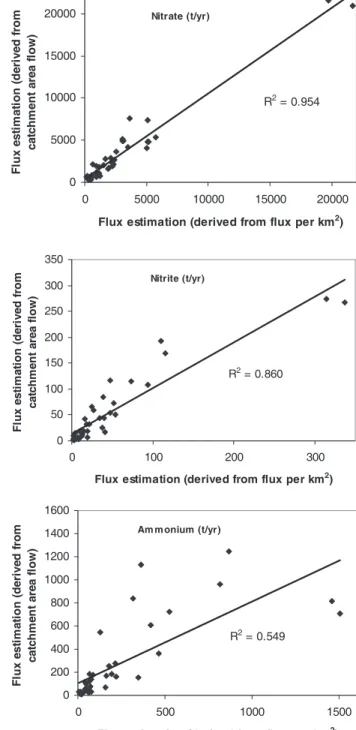
Testing of the two flux estimation procedures is difficult because of a limited number of sites where the flux can be calculated. This is because mean concentration sites need to be near a flow gauge for flux estimation, to allow confidence in the flux estimates; away from the flow gauges the flows would have to be estimated, introducing further uncertainty. However, the values of flux obtained by both methods are within the range expected and show the general pattern expected across the Humber as highlighted in Neal and Davies (2003). Thus, there is a good correlation for the 38 points between the two methods of flux estimation for nitrate, and to a lesser extent nitrite (Fig. 7). However, the prediction of ammonium flux appears to be less certain.
When comparing the entire river network results (10 987 points) for the two methods of flux estimation, very similar values were obtained, correlation of the two methods gives r2 values for nitrate, nitrite and ammonium of 0.986, 0.992
and 0.983 respectively and p < 0.001 for all three relationships.
Discussion
The results show that the concentrations and fluxes for nitrate, nitrite and ammonium tend to be higher in the industrialised, more urban, catchments. This observation fits in well with earlier observations for the LOIS sites (Jarvie
et al., 1997c; Neal and Davies, 2003) and more general
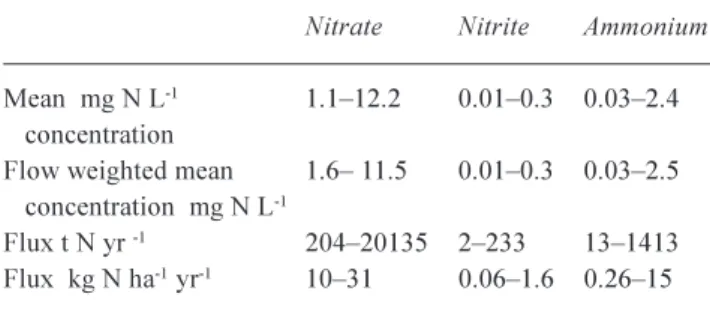
comments by Robson and Neal (1997) for the LOIS region as a whole. Table 3 shows the range of nitrate, nitrite and ammonium water quality values calculated from this study, across the Humber, from upland areas and rural areas to highly industrialised catchments which tend to have the highest values. Nitrate is the most significant dissolved
Nitrate (t/yr) R2 = 0.954 0 5000 10000 15000 20000 0 5000 10000 15000 20000
Flux estimation (derived from flux per km2)
Fl ux e st im at ion ( d er iv ed f rom ca tc h m en t a re a fl o w ) Nitrite (t/yr) R2 = 0.860 0 50 100 150 200 250 300 350 0 100 200 300
Flux estimation (derived from flux per km2)
F lu x esti m ati o n ( d er ived fr o m cat ch m en t ar ea fl o w ) Am monium (t/yr) R2 = 0.549 0 200 400 600 800 1000 1200 1400 1600 0 500 1000 1500
Flux estimation (derived from flux per km2)
Fl ux e st im at io n ( d er iv ed f rom ca tch m en t a rea fl o w )
Fig. 7. Comparison of different methods of flux estimation
nitrogen component, accounting for more than 90% of the dissolved nitrogen in all catchments except the lower Calder and Rother catchments where approximately 20% of dissolved nitrogen is accounted for by ammonium. The derived estimates of water quality across the Humber river network show a good level of accuracy for nitrates, especially along main river networks. However, there are anomalous areas of nitrate under-estimation due to local effects which can be difficult to predict within a general
equation. There is greater confidence in the derived mean concentration network than in the derived flux network, because of the ability to test the concentration results on an unrelated sample set of concentrations. Testing of the flux results was more difficult because there are not enough suitable sample points available where concentration sample point and flow gauge data are in close proximity. However, the two methods of flux estimation produce similar results and the fluxes obtained are in the range expected for the Humber as in Neal and Davies (2003). With regard to flux estimation in areas without hydrological data, the flux estimation method using the catchment area as a method of flow estimation would need to be used as method two requires gauged river flows.
This GIS/regression-based method of nitrate estimation seems to be of value for assessing regional nitrogen concentration and flux across a region where water quality data do not exist but land-use characteristics are available. The methods of water quality estimation highlighted in this paper are less certain for nitrite and ammonium than for nitrates, probably in part due to the sporadic nature of their inputs, the possibility of attenuation and change in speciation (e.g. to nitrate or nitrogen gas) and their low concentrations in the streamwater.
The GIS framework developed for estimation of water quality is very adaptable in the sense that it can be used for any interval from 50 m upwards along the network and for any detail of river network required. It would be valuable to compare this approach with others such as regional assessment based export coefficient models (Johnes, 1996). In some areas, extensive water quality data may be available where regional assessments of water quality variations can be assessed directly. However, even for the Humber river, there are clearly gaps that are important. Hence the GIS approach is a sensible way forward to meet the demands of water quality management. The key is to transfer the approach to ungauged catchments.
With the increasing availability of national water quality datasets within programmes such as LOCAR (Neal et al, 2004; www.nerc.ac.uk/funding/thematics/LOCAR) which
are focusing on lowland permeable catchments with rural and agricultural land use, the GIS approach can be refined to a wider range of typologies and testing of the approach to ungauged catchments throughout the UK can be undertaken. Ultimately, a more complex country-wide study of the relationships between land characteristics and nitrogen would be an obvious continuation, to assess if it is possible to estimate water quality from land characteristics on a larger scale. The research could be broadened further to a European dimension within frameworks such as those that this journal Special Issue addresses. However, it must be realised that wider suitability may be restricted as the different climate types will result in differences in input. This work is a useful study for socio-economists to understand the role of various components in shaping the contribution of fluxes to the coastal and estuarine regions as is being achieved in international programmes such as EUROCAT (Cave et al., 2003)
Conclusion
The GIS-based study of nitrogen species in a major river basin entering the North Sea, the Humber, has proved successful in showing the broad patterns across the region based on regression analysis of environmental measurements on the nitrogen species and simple land characteristics. The approach is particularly good for the main nitrogen species in surface waters, nitrate, but is less suitable but still adequate, for nitrite and ammonium where intermittent inputs and within river reactivity affect the broad-based patterns. The work builds on earlier GIS studies for the Humber and provides a firm base for environmental management, particularly in combination with socio-economic drivers for initiatives of national and international importance, such as EUROCAT.
Acknowledgements
Funding from the EU (contract number ENV1-2000-00044) for the EUROCAT project is gratefully acknowledged.
References
Cave, R.R., Ledoux, L,, Turner, K., Jickells, T., Andrews, J.E. and Davies, H., 2003. The Humber Catchment and its Coastal Area: from UK to European perspectives. Sci. Total Envir.,
314-316, 3152.
Edwards, A.C., Pugh, K., Wright, G., Sinclair, A.H. and Reaves, G.A., 1990. Nitrate status of two major rivers in N. E. Scotland with respect to land use and fertiliser additions. Chem. Ecol., 4, 97107.
Gren, I-M, Turner, K. and Wulff, F., 2000. Managing a Sea: The Ecological Economics of the Baltic. Earthscan, London, UK 138pp.
Table 3. Nitrate, nitrite and ammonium within the Humber basin
Nitrate Nitrite Ammonium
Mean mg N L-1 1.112.2 0.010.3 0.032.4
concentration
Flow weighted mean 1.6 11.5 0.010.3 0.032.5
concentration mg N L-1
Flux t N yr -1 20420135 2233 131413
Jarvie, H.P., Neal, C. and Tappin, A.D., 1997a. European land-based pollution loads to the North Sea: an analysis of the Paris Commission data and review of monitoring strategies. Sci. Total Envir., 194/195, 3958.
Jarvie, H.P., Neal, C., and Robson, A.J., 1997b. The geography of the Humber catchment. Sci.Total Envir., 194/195, 87100. Jarvie, H.P., Neal, C., Leach, D.V., Ryland, G.P., House, W.A.
and Robson, A.J., 1997c. Major ion concentrations and inorganic carbon chemistry of the Humber Rivers. Sci. Total Envir., 194/
195, 285302.
Jarvie, H.P., Whitton, B.A. and Neal, C., 1998. Nitrogen and phosporus in east coast British rivers: Speciation, sources and biological significance. Sci. Total Envir., 210/211, 79109. Jarvie, H.P., Oguchi, T. and Neal, C., 2000. Pollution regimes and
variability in river water quality across the Humber catchment: interrogation and mapping of an extensive and highly heterogeneous spatial dataset. Sci. Total Envir., 251/252, 29 46.
Jarvie, H.P., Oguchi, T. and Neal, C., 2002. Exploring the linkages between river water quality and watershed characteristics using GIS-based catchment and locality analysis. Regional Environ. Change, 3, 3650.
Johnes, P.J., 1996. Evaluation and management of the impact of land use change to the nitrogen and phosphorus load delivered to surface waters: the export coefficient modelling approach. J. Hydrol., 183, 323349.
Leeks, G.J.L. and Jarvie, H.P., 1998. Introduction to the Land-Ocean Interaction Study (LOIS): Rationale and international context. Sci. Total Envir., 210/211, 520.
Leeks, G.J.L., Jarvie H.P., Casey H. and Leach, D.V., 1997. The LOIS river monitoring network: strategy and implementation. Sci Total Envir., 194/195, 101109.
Littlewood, I.G., Watts, C.D. and Custance, J.M. 1998. Systematic application of United Kingdom river flow and quality databases for estimating annual river mass loads (1975 1994). Sci. Total Envir., 210/211, 2140.
Neal, C. (Ed.), 2002. Assessing nitrogen dynamics in catchments across Europe within an INCA modelling framework. Hydrol. Earth Syst. Sci., 6, 297615.
Neal, C. and Davies, H., 2003. Water quality fluxes for eastern UK rivers entering the North Sea: a summary of information from the Land Ocean Interaction Study (LOIS). Sci. Total Envir.,
314-316, 821882.
Neal, C., Jarvie, H.P. and Oguchi, T., 1999. Acid available particulate trace metal associated with suspended sediments in the Humber Rivers: a regional assessment. Hydrol. Process.
13, 11171136
Neal, C. and Robson, A.J., 2000. A summary of river water quality data collected within the Land Ocean Interaction Study: core data for eastern UK Rivers draining to the North Sea. Sci. Total Envir., 251/252, 585666.
Neal, C., Jarvie, H.P., Neal, M., Wyatt, R, Turner, H., Hill, L. and Hewitt, N., 2004. The water quality of the LOCAR Pang and Lambourn catchments. Hydrol. Earth Syst. Sci., 8, 614-635. Oguchi, T., Jarvie, H.P. and Neal, C., 2000. River water quality in
the Humber catchment: an introduction using GIS-based mapping and analysis. Sci. Total Envir., 251/252, 928. Pernetta, J.C. and Milliman, J.D. (Eds.), 1995. Land-Ocean
Interactions in the Coastal Zone: implementation plan. IGBP Secretariat, The Royal Swedish Academy of Sciences, Box 50005, S-10405, Stockholm, Sweden. 215pp.
Robson, A.J. and Neal, C., 1997. A summary of regional water quality for Eastern UK rivers. Sci. Total Envir., 194/195, 15 38.
Simpson, E.A., 1980. The harmonisation of the monitoring of the quality of rivers in the UK. Hydrolog. Sci. Bull., 25, 113. Smart, R.P., Soulsby, C., Cresser, M.S., Wade, A.J., Townend, J.,
Billett, M. and Langan, S.J., 2001. Riparian zone influence on streamwater chemistry at different spatial scales: a GIS-based modelling approach, an example for the Dee, NE Scotland. Sci. Total Envir., 280, 173193.
Wade, A.J., Neal, C., Soulsby, C., Smart, R.P., Langan, S.J. and Cresser, MS., 1999. Modelling streamwater quality under varying hydrological conditions at different spatial scales. J. Hydrol., 217, 266283.
Wade, A.J., Whitehead, P.G. and OShea, L.C.M., 2002. The prediction and management of aquatic nitrogen pollution across Europe: an introduction to the Integrated Nitrogen in European Catchments project (INCA). Hydrol. Earth Syst. Sci., 6, 299 314.