arXiv:hep-ph/0312294v1 20 Dec 2003
Scattering at Q
=0.92 and 1.76 GeV
: II. Dispersion Relation Analysis
G. Laveissi`ere,1L. Todor,2N. Degrande,3 S. Jaminion,1 C. Jutier,1, 2 R. Di Salvo,1L. Van Hoorebeke,3 L.C. Alexa,4
B.D. Anderson,5K.A. Aniol,6 K. Arundell,7 G. Audit,8 L. Auerbach,9 F.T. Baker,10 M. Baylac,8 J. Berthot,1
P.Y. Bertin,1W. Bertozzi,11 L. Bimbot,12 W.U. Boeglin,13 E.J. Brash,4V. Breton,1 H. Breuer,14E. Burtin,8
J.R. Calarco,15 L.S. Cardman,16 C. Cavata,8 C.-C. Chang,14 J.-P. Chen,16 E. Chudakov,16E. Cisbani,17
D.S. Dale,18C.W. de Jager,16R. De Leo,19A. Deur,1, 16 N. d’Hose,8 G.E. Dodge,2J.J. Domingo,16L. Elouadrhiri,16
M.B. Epstein,6 L.A. Ewell,14 J.M. Finn,7 K.G. Fissum,11 H. Fonvieille,1 G. Fournier,8B. Frois,8 S. Frullani,17
C. Furget,20 H. Gao,11, 21 J. Gao,11 F. Garibaldi,17 A. Gasparian,22, 18 S. Gilad,11 R. Gilman,23, 16 A. Glamazdin,24
C. Glashausser,23 J. Gomez,16 V. Gorbenko,24P. Grenier,1 P.A.M. Guichon,8 J.O. Hansen,16 R. Holmes,25
M. Holtrop,15 C. Howell,21G.M. Huber,4 C.E. Hyde-Wright,2S. Incerti,9M. Iodice,17 J. Jardillier,8 M.K. Jones,7, 16
W. Kahl,25 S. Kato,26 A.T. Katramatou,5 J.J. Kelly,14 S. Kerhoas,8 A. Ketikyan,27 M. Khayat,5 K. Kino,28
S. Kox,20 L.H. Kramer,13 K.S. Kumar,29 G. Kumbartzki,23M. Kuss,16 A. Leone,30 J.J. LeRose,16 M. Liang,16
R.A. Lindgren,31 N. Liyanage,11, 31G.J. Lolos,4R.W. Lourie,32R. Madey,5K. Maeda,28S. Malov,23 D.M. Manley,5
C. Marchand,8 D. Marchand,8 D.J. Margaziotis,6P. Markowitz,13 J. Marroncle,8 J. Martino,8 C.J. Martoff,9
K. McCormick,2, 23 J. McIntyre,23 S. Mehrabyan,27F. Merchez,20Z.E. Meziani,9 R. Michaels,16G.W. Miller,29
J.Y. Mougey,20 S.K. Nanda,16 D. Neyret,8 E.A.J.M. Offermann,16 Z. Papandreou,4 B. Pasquini,33C.F. Perdrisat,7
R. Perrino,30 G.G. Petratos,5 S. Platchkov,8R. Pomatsalyuk,24D.L. Prout,5 V.A. Punjabi,34T. Pussieux,8
G. Qu´emen´er,7, 20R.D. Ransome,23 O. Ravel,1J.S. Real,20 F. Renard,8 Y. Roblin,1, 16 D. Rowntree,11G. Rutledge,7
P.M. Rutt,23 A. Saha,16 T. Saito,28 A.J. Sarty,35 A. Serdarevic,4, 16 T. Smith,15 G. Smirnov,1 K. Soldi,36
P. Sorokin,24P.A. Souder,25R. Suleiman,5, 11 J.A. Templon,10 T. Terasawa,28R. Tieulent,20 E. Tomasi-Gustaffson,8
H. Tsubota,28 H. Ueno,26 P.E. Ulmer,2 G.M. Urciuoli,17M. Vanderhaeghen,37, 7, 16 R. Van De Vyver,3R.L.J. Van
der Meer,4, 16 P. Vernin,8 B. Vlahovic,36 H. Voskanyan,27 E. Voutier,20 J.W. Watson,5 L.B. Weinstein,2
K. Wijesooriya,7 R. Wilson,38B.B. Wojtsekhowski,16D.G. Zainea,4 W-M. Zhang,5 J. Zhao,11and Z.-L. Zhou11
(The Jefferson Lab Hall A Collaboration)
1Universit´e Blaise Pascal/IN2P3, F-63177 Aubi`ere, France 2Old Dominion University, Norfolk, VA 23529
3University of Gent, B-9000 Gent, Belgium 4University of Regina, Regina, SK S4S OA2, Canada
5Kent State University, Kent OH 44242 6California State University, Los Angeles, CA 90032 7College of William and Mary, Williamsburg, VA 23187
8CEA Saclay, F-91191 Gif-sur-Yvette, France 9Temple University, Philadelphia, PA 19122
10University of Georgia, Athens, GA 30602
11Massachusetts Institute of Technology, Cambridge, MA 02139 12Institut de Physique Nucl´eaire, F-91406 Orsay, France
13Florida International University, Miami, FL 33199 14University of Maryland, College Park, MD 20742 15University of New Hampshire, Durham, NH 03824
16Thomas Jefferson National Accelerator Facility, Newport News, VA 23606 17INFN, Sezione Sanit`a and Istituto Superiore di Sanit`a, 00161 Rome, Italy
18University of Kentucky, Lexington, KY 40506
19INFN, Sezione di Bari and University of Bari, 70126 Bari, Italy 20Laboratoire de Physique Subatomique et de Cosmologie, F-38026 Grenoble, France
21Duke University, Durham, NC 27706 22Hampton University, Hampton, VA 23668
23Rutgers, The State University of New Jersey, Piscataway, NJ 08855 24Kharkov Institute of Physics and Technology, Kharkov 61108, Ukraine
25Syracuse University, Syracuse, NY 13244 26Yamagata University, Yamagata 990, Japan 27Yerevan Physics Institute, Yerevan 375036, Armenia
28Tohoku University, Sendai 980, Japan 29Princeton University, Princeton, NJ 08544 30INFN, Sezione di Lecce, 73100 Lecce, Italy 31University of Virginia, Charlottesville, VA 22901
33DFNT, University of Pavia and INFN, Sezione di Pavia; ECT*, Villazzano (Trento), Italy 34Norfolk State University, Norfolk, VA 23504
35Florida State University, Tallahassee, FL 32306 36North Carolina Central University, Durham, NC 27707
37Institut fuer Kernphysik, University of Mainz, D-55099 Mainz, Germany 38Harvard University, Cambridge, MA 02138
Virtual Compton Scattering is studied at the Thomas Jefferson National Accelerator Facility in the energy domain below pion threshold and in the ∆(1232) resonance region. The data analysis is based on the Dispersion Relation (DR) approach. The electric and magnetic Generalized Polarizabilities (GPs) of the proton and the structure functions PLL−PT T/ǫ and PLT are determined at
four-momentum transfer squared Q2
= 0.92 and 1.76 GeV2
. The DR analysis is consistent with the low-energy expansion analysis. The world data set indicates that neither the electric nor magnetic GP follows a simple dipole form.
PACS numbers: 23.23.+x,56.65.Dy
Virtual Compton Scattering (VCS) γ∗p → γp has
de-veloped in the last decade as a powerful tool to study the nucleon structure. At low CM-frame energy W , the VCS amplitude is parametrized as a function of the Gen-eralized Polarizabilities (GPs) of the proton [1], which depend on the four-momentum transfer squared Q2 of
the virtual photon. These new observables have become the subject of experimental investigation via the study of photon electroproduction ep → epγ. In a companion Letter (referred to as I) we present an extraction of the structure functions PLL−PT T/ǫ and PLT from data
be-low N π threshold [2], folbe-lowing the be-low-energy expansion (LEX) formalism [1].
B. Pasquini et al. recently developed a formalism for VCS based on Dispersion Relations (DRs) [3]. In this Letter we report a determination of the electric and mag-netic GPs of the proton (αE(Q2) and βM(Q2),
respec-tively) from an analysis based on the DR model. The structure functions PLL −PT T/ǫ and PLT are also ex-tracted. The method uses the photon electroproduction cross section measured in the E93-050 experiment [4] at Jefferson Lab (JLab).
In the DR formalism, the VCS amplitude is predicted from the MAID parametrization [5] of pion electropro-duction, π0 and σ-meson t-channel exchange, plus two
other Q2-dependent functions (subtraction constants).
The latter are unconstrained phenomenological contri-butions to αE(Q2) and βM(Q2); therefore these GPs are
not fixed by the DR model. They are written as: αE(Q2) = απNE (Q2) + [ αexpE −απN E ]Q2=0 ( 1 + Q2/Λ2 α) 2 (1)
(same relation for βM with parameter Λβ) where απNE
(βπN
M ) is the πN dispersive contribution evaluated using
the MAID analysis, and αexpE (βMexp) is the experimental value at Q2 = 0. The mass coefficients Λ
α and Λβ are
free parameters to be fitted experimentally. We note that the choice of a dipole form in Eq. 1 is not compulsory. A more fundamental property of the DR model is that, up to the N ππ threshold, it provides a rigorous treatment of the higher order terms in the VCS amplitude, beyond the lowest order GPs given by the LEX [1]. This feature
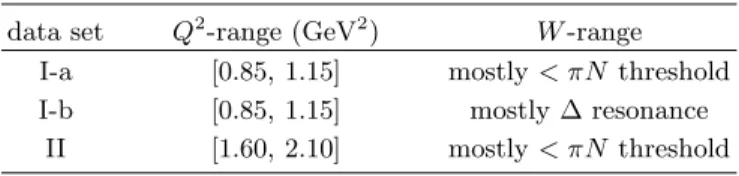
allows the inclusion of data in the ∆(1232) resonance region in an extraction of GPs based on the DR approach. The JLab experiment uses the 4 GeV Continuous Elec-tron Beam Accelerator and the Hall A instrumenta-tion [6]. More details can be found elsewhere [7, 8, 9, 10, 11, 12]. The present study involves all the (ep → epγ) events with W < 1.28 GeV. The events are divided into three independent subsets listed in Table I. For data sets I-a and II, by far most of the events lie below pion threshold; actually these two sets have also been used in the LEX analysis [2] considering only events such that W < (Mp+Mπ). Data set I-b covers mainly the ∆(1232)
resonance region in W . The three data sets of Table I are
TABLE I: Data sets for the DR analyses. data set Q2
-range (GeV2
) W -range
I-a [0.85, 1.15] mostly < πN threshold I-b [0.85, 1.15] mostly ∆ resonance
II [1.60, 2.10] mostly < πN threshold
the subject of three distinct DR analyses. The basic in-gredients for the cross-section determination are common to all our analyses of this experiment [7, 8, 9, 10, 11, 12]. They include a dedicated Monte-Carlo simulation [13] to obtain the acceptance, proper cuts to eliminate back-ground, the application of radiative corrections [14], the calibration of experimental offsets and the absolute nor-malization of the experiment. It is important to have a realistic shape for the sampling cross section in the Monte-Carlo in order to calculate an accurate solid an-gle. For this purpose, simulated events are sampled in the DR model cross section (d5σDR) which reproduces
the enhancement of the ∆ resonance. d5σDRdepends on
two free parameters Λα and Λβ (cf. Eq. 1) which are
it-eratively fitted by a χ2 minimization at the cross section
level. When W increases, the acceptance is reduced to backward polar angles θγ∗γCM (angle between the
vir-tual and the final photons in the (γp) CM frame). Cross-section data obtained in this angular region are shown in Figs. 1 and 2. Kinematical conditions are defined on
FIG. 1: (ep → epγ) cross section for data set I-b in six in-tervals of the azimuthal angle ϕ (angle between lepton and hadron planes) as a function of W . By symmetry the statis-tics for ϕ= 180◦ to 360◦ are also included. Only statistical
errors are shown. The solid curve is the prediction of the DR model for parameter values (Λα, Λβ)=(0.7, 0.6) GeV, while
the dashed curve is for (0.5, 0.4) GeV and the dash-dotted curve for (0.9, 0.8) GeV, respectively.
the plots, klab being the incoming beam energy (Fig. 1),
q the virtual photon CM momentum and ǫ the virtual photon polarization (Fig. 2). Figure 1 clearly shows the ∆ resonance excitation and the various curves indicate the sensitivity of the DR model to its free parameters. In contrast with Fig. 1, Fig. 2 shows how the Bethe-Heitler+Born calculation, or the addition of a first-order GP effect as in the LEX approach [2], fails to reproduce the measured cross section above pion threshold.
FIG. 2: (ep → epγ) cross section for data sets I-a (left) and II (right). The outgoing photon is emitted in the lepton plane (ϕ = 0◦ or 180◦). The abscissa is the polar angle θ
γ∗γCM,
with negative values corresponding to ϕ = 180◦as in Ref. [15].
Only statistical errors are shown. The full curve is the DR model prediction using the values of (Λα, Λβ) fitted to each
of the two data sets (see Table II). The dashed (dash-dotted) curve is the BH+Born (plus a first-order GP effect) cross section.
The results for Λα and Λβ are presented in Table II.
Systematic errors are calculated from the same four
un-certainties as in the LEX analysis [2]. The resulting error bars differ from one data set to another; this comes from the various data sets having a different phase space cov-erage, and a different sensitivity to both the physics and the sources of systematic errors. The reasonably good χ2
of the fits (1.3 to 1.5) indicates that the DR model works well in our kinematics and allows a reliable extraction of GPs, both below and above pion threshold. The compat-ibility between the three fitted values of Λαwithin errors
(same for Λβ) suggests that the dipole form of Eq. 1 is
rather realistic, at least in the range Q2 ∼ 1-2 GeV2.
We also note the close agreement between the obtained values of Λαand Λβ.
In the DR model these results directly translate into values for the electric and magnetic GPs, using Eq. 1. Table II gives the result of this evaluation of αE(Q2) and
βM(Q2) at Q2= 0.92 GeV2 (data sets I-a and I-b) and
Q2= 1.76 GeV2 (data set II). These points are shown
in Fig. 3 together with the point at Q2= 0 [16] and the
points derived from the LEX analyses [2, 15]. It must be noted that the latter do not directly yield the GPs, but the structure functions PLL−PT T/ǫ and PLT, which
are combinations of GPs. Therefore to obtain the “LEX points” of Fig. 3 we have extracted αE(Q2) and βM(Q2)
from the measured structure functions [2, 15] according to the formulas [3]: PLL− 1 ǫPT T = 4Mp αQED GpE αE(Q2) + [spin-flip GPs] (2) PLT = − 2Mp αQED s q2 Q2G p E βM(Q 2) + [spin-flip GPs] (3)
where αQED is the fine-structure constant and G p E is the
proton electric form factor. In this extraction the spin-flip GP terms are predicted by the DR model (so the result is model-dependent) and the parametrization of GpE is taken from Ref. [17]. The solid curve on Fig. 3 is the full DR calculation, split into its dispersive πN con-tribution (dashed curve) and the remaining asymptotic contribution (dash-dotted curve, dipole term of Eq. 1) for
TABLE II: Upper part: dipole mass parameters Λα and Λβ
obtained by fitting the three data sets independently. Lower part: electric and magnetic GPs evaluated at Q2
= 0.92 GeV2
(data sets I-a, I-b) and 1.76 GeV2
(data set II). The first and second errors are statistical and total systematic errors, respectively.
data set Λα(GeV) Λβ (GeV)
I-a 0.741 ± 0.040 ± 0.175 0.788 ± 0.041 ± 0.114 I-b 0.702 ± 0.035 ± 0.037 0.632 ± 0.036 ± 0.023 II 0.774 ± 0.050 ± 0.149 0.698 ± 0.042 ± 0.077 data set αE(Q 2 ) (10−4fm3 ) βM(Q 2 ) (10−4fm3 ) I-a 1.02 ± 0.18 ± 0.77 0.13 ± 0.15 ± 0.42 I-b 0.85 ± 0.15 ± 0.16 0.66 ± 0.11 ± 0.07 II 0.52 ± 0.12 ± 0.35 0.10 ± 0.07 ± 0.12
FIG. 3: Compilation of the data on electric (a) and magnetic (b) GPs. Data points are from Refs. [16] (△), the LEX
anal-yses of MAMI [15] (⋄) and JLab [2] (◦) and the present DR results (•). Some JLab points are shifted in abscissa for bet-ter visibility. The inner error bar is statistical; the oubet-ter one is the total error (quadratic sum of statistical and systematic errors). The curves show the results of calculations in the DR model (see text).
Λα=0.70 GeV and Λβ=0.63 GeV, as fitted on the JLab
data set I-b. The πN intermediate states contribute very little to the electric polarizability at finite Q2 (Fig. 3-a)
and they create a small dia-electric effect (απN E < 0).
The πN contribution to the magnetic polarizability in Fig. 3-b is strongly paramagnetic, predominantly arising from the ∆(1232) resonance. In the DR formalism, this is cancelled by a strong diamagnetic term originating from σ-meson t-channel exchange, and parametrized by Λβ.
The dotted curve is the full DR calculation evaluated for Λα=1.79 GeV and Λβ=0.51 GeV, which reproduces the
MAMI LEX data. The fact that there is no unique value of (Λα, Λβ) agreeing with all data points suggests that
the dipole form of Eq. 1, although working well in the range 1-2 GeV2 as mentioned above, is not valid over
the entire range of Q2. This further suggests that the
global behavior of the GP αE(Q2) does not follow a
sim-ple dipole form.
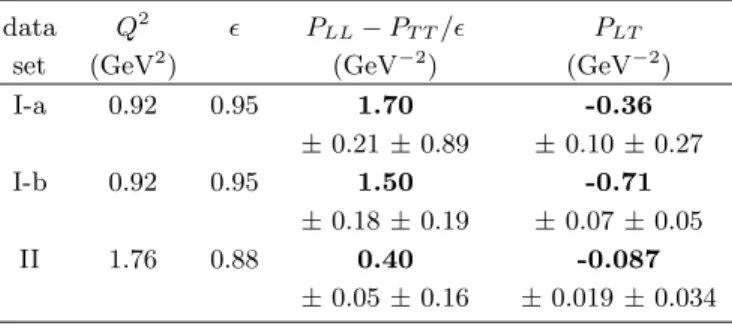
Finally, the results of our DR analyses can be expressed
in terms of VCS structure functions. Using the GP val-ues of Table II and the DR model prediction for PT T, the
structure functions PLL−PT T/ǫ and PLT are determined from Eqs. 2 and 3. Their values are reported in Table III. To facilitate the comparison with the LEX results, the present determination is made at similar kinematics in Q2 and ǫ (see Table III). The agreement with the
val-ues obtained in the LEX analysis [2] is very satisfactory. The results from the DR analysis of the (I-b) data set, obtained in the ∆ region, yields smaller error bars due to an enhanced sensitivity to the GPs.
In summary we have analyzed the process ep → epγ at JLab using a Dispersion Relation approach. The VCS structure functions obtained in this approach are in good agreement with the ones extracted using the low-energy expansion. We performed the first determination of GPs by analyzing data in the ∆(1232) resonance region. This opens up new possibilities to extract GPs from experi-ments, especially at higher Q2.
We thank the JLab accelerator staff and the Hall A technical staff for their dedication. This work was supported by DOE contract DE-AC05-84ER40150 un-der which the Southeastern Universities Research As-sociation (SURA) operates the Thomas Jefferson Na-tional Accelerator Facility. We acknowledge addiNa-tional grants from the US DOE and NSF, the French Centre National de la Recherche Scientifique and Commissariat `
a l’Energie Atomique, the Conseil R´egional d’Auvergne, the FWO-Flanders (Belgium) and the BOF-Gent Uni-versity. We thank for the hospitality of ECT* (Trento) during VCS workshops where this work was discussed.
TABLE III: VCS structure functions obtained by the DR analyses of the three data sets. The first and second errors are statistical and total systematic errors, respectively.
data Q2 ǫ PLL−PT T/ǫ PLT set (GeV2 ) (GeV−2) (GeV−2) I-a 0.92 0.95 1.70 -0.36 ±0.21 ± 0.89 ±0.10 ± 0.27 I-b 0.92 0.95 1.50 -0.71 ±0.18 ± 0.19 ±0.07 ± 0.05 II 1.76 0.88 0.40 -0.087 ±0.05 ± 0.16 ±0.019 ± 0.034
[1] P. A. M. Guichon, G. Q. Liu, and A. W. Thomas, Nucl. Phys. A591, 606 (1995).
[2] S. Jaminion et al., Letter I, to be submitted to Phys. Rev. Lett.
[3] B. Pasquini, M. Gorchtein, D. Drechsel, A. Metz, and M. Vanderhaeghen, Eur. Phys. J. A11, 185 (2001). [4] P. Y. Bertin, C. Hyde-Wright, P. A. M.
Gui-chon, et al. (1993), experiment E93-050, URL http://hallaweb.jlab.org/experiment/E93-050/vcs.html.
[5] D. Drechsel, O. Hanstein, S. S. Kamalov, and L. Tiator, Nucl. Phys. A645, 145 (1999), URL http://www.kph.uni-mainz.de/MAID/.
[6] J. Alcorn et al., accepted by NIM A.
[7] G. Laveissi`ere et al. (2003), to be submitted to Phys. Rev. C, nucl-ex/0308009.
[8] N. Degrande, Ph.D. thesis, Gent University (2001). [9] S. Jaminion, Ph.D. thesis, Universit´e Blaise Pascal
[10] C. Jutier, Ph.D. thesis, Old Dominion University and Universit´e Blaise Pascal (2001), DU 1298.
[11] G. Laveissi`ere, Ph.D. thesis, Universit´e Blaise Pascal (2001), DU 1309.
[12] L. Todor, Ph.D. thesis, Old Dominion University (2000). [13] L. Van Hoorebeke et al., to be submitted to NIM A. [14] M. Vanderhaeghen, J. M. Friedrich, D. Lhuillier,
D. Marchand, L. Van Hoorebeke, and J. Van de Wiele, Phys. Rev. C62, 025501 (2000).
[15] J. Roche et al., Phys. Rev. Lett. 85, 708 (2000). [16] V. Olmos de Leon et al., Eur. Phys. J. A10, 207 (2001). [17] E. J. Brash, A. Kozlov, S. Li, and G. M. Huber, Phys.