NEW TOWNE COURT/WASHINGTON ELMS IN CAMBRIDGE BY
BEN JOSEPH FRIEDMAN
Bachelor of Architecture, The Cooper Union for the Advancement of Science and Art
(1967)
SUBMITTED IN PARTIAL FULFILLMENT OF THE REQUIREMENTS FOR THE DEGREE OF
MASTER OF CITY PLANNING AND
MASTER .OF ARCHITECTURE IN ADVANCED STUDIES
at the
MASSACHUSETTS INSTITUTE OF TECHNOLOGY June, 1980
©
Ben Joseph Friedman, 1980Signature of Author___
Depa fent of Urban Studies
June 1J-980 Certified and Accepted by
Thesis Supervisor and Chairman Department of Urban Studies
andPlanning Committee Accepted by
Jul id Betnart
Chai a
Department of Architecture MASSACHUSETTS INSTITUTE Committee
OF TECHNOLOGY
AUG 2 0 1980
The author hereby grants to M.I.T. permission to reproduce and to distribute copies of this
A PROPOSAL FOR
NEW TOWNE COURT/WASHINGTON ELMS IN CAMBRIDGE
by
Ben Joseph Friedman
Submitted to the Department
of Architecture and the
Department of Urban Studies and Planning of the
Massachu-setts Institute of Technology in June,
1980 for the Degrees
of Master of City Planning and Master of Architecture in
Advanced Studies.
ABSTRACT
A demonstration project is proposed for
"deinstitution-alization" of low-income residents at two public housing
projects in Cambridge. The primary mechanism for this is
creation of a local Rent Subsidy Fund by leveraging land and/
or buildings at the projects with existing State and federal
programs.
In three proposed options, greater numbers of
low-income households are served than now reside at both housing
projects. Nearly 100 more low-income households are served
without a continuing contribution from the U. S. Department
of
Housing and Urban Development (HUD) than now are served
with HUD contributions.
Almost 300 more low-income households
are served if HUD contributions, at present levels, are
carried over to the new Rent Subsidy Fund.
Broad flexibility currently within Cambridge's public
housing system is first used for relocation of project
residents who now remain. Resources available for low-income
families in Cambridge are increased. Effects of low-income
concentration and spill-over effects on neighborhood schools
and property values are avoided. An underutilized area of
the City is revitalized; new commercial development is
rein-forced; jobs are created; and land is returned to the City's
tax base.
Necessary for this process to succeed is the
participa-tion of an expanded set of actors. These include: tenants at
both housing projects, representatives of low-income families
on Cambridge Housing Authority (CHA) waiting lists,
neighbor-hood residents, private developers, CHA program administrators,
the Cambridge Community Development Department, the Cambridge
City Council, Massachusetts Office of Communities and
Develop-ment, Massachusetts Housing Finance Agency, Massachusetts
Industrial Finance Agency and the U. S. Department of Housing
and Urban Development.
Thesis Supervisor: Langley C. Keyes, Jr.
Title: Chairman, M.C.P. Committee
To My Parents
ACKNOWLEDGMENTS
Langley Keyes, my thesis supervisor and chairman of
the Master of City Planning (MCP) Committee in the Department of Urban Studies at M.I.T., has been a superb role model, teacher and friend. It has been an honor to know and to work with Langley. I have also benefited from the advice of
Julian Beinart, both as a professor and friend, throughout my three-year stay at M.I.T. Concepts on "growth focusing" used in this thesis were derived from studies with Professor
Philip Herr. Ideas on "environmental mediation" grew out of my research in energy facility siting with Professor Michael O'Hare. Work with Michael Joroff, Director of the Laboratory of Architecture and Planning, further added to my knowledge in the area of "deinstitutionalization".
The thesis was also made possible by support and co-operation of James G. Stockard, Chairman of the Board of the Cambridge Housing Authority and by assistance from the Cambridge Housing Authority staff. These included: Daniel Wuenschel, Executive Director; Elspeth Taylor, Director of
Fiscal Affairs; George Hughes, Director of Tenant Selection; Frederic Putnam, Director of Planning and Development and Mathew Thall, Assistant to the Director of Planning and Development. David Vickery, Assistant City Manager for Cambridge Community Development; Roger Boothe, Head of Urban Design; Donald Balcomb, Cambridge Zoning Administrator; and Betty Derosier, Associate Planner -- all of the Cambridge
Community Development Department -- were extremely helpful.
Joseph Tulimeri, Deputy Executive Director of the Cambridge
Redevelopment Authority, and Kenneth English, Site Develop-ment Officer, further added their assistance. Rudolph Russo, Chairman of the Cambridge Board of Assessors, also contributed his help. Mark Waltch, developer (Mark Waltch Associates), and Carl Sapers, professor and attorney, were especially
helpful in my formulation of the development proposal itself. Further thanks go to Judith Block and Robert Alter
of M.I.T. 's Creative Photography Labortory , and to
Michael Morrison of Stone's Printing Service. Penelope Johnson of M.I.T.'s Department of Urban Studies was vital
TABLE OF CONTENTS Page ABSTRACT 3 DEDICATION 4 ACKNOWLEDGMENTNS 5 TABLE OF CONTENTS 6 LIST OF FIGURES 9 LIST OF TABLES 11 INTRODUCT ION 16
CHAPTER I: ECONOMIC BOOM 19
The Regional Economic Outlook 20
Massachusetts and Greater Boston as Major Areas
for New Investment 22
High Technology's Promise of New Jobs_ 23 Proximity to M.I.T., A Major Economic Asset 24 Transformation of Boston into a Service
Capital of New England 25
The Emerging Office Market in Cambridge 26 Cambridge Population Change and Pressures
on the Housing Stock 27
Boston/Cambridge Momentum of Development 29 CHAPTER II: MAIN STREET AS AN UNDERUTILIZED RESOURCE__ 31
General Description 39
Main Street: An Historic Commercial District 40 The Change from a Commercial to an Industrial
TABLE OF CONTENTS
Page
M.I.T. and Development of Main Street as a
High Technology/Office Center 43
Main Street as an Underutilized Resource 44 CHAPTER III: THE PUBLIC HOUSING PROJECTS OF NEW
TOWNE COURT AND WASHINGTON ELMS 50
Project and Area History 63
Recent History 64
Social and Economic Characteristics of
New Towne Court/Washington Elms 66
Physical Characteristics of New Towne
Court/-Washington Elms 67
The Issue of Whether Families at New Towne
Court/Washington Elms are Adequately Served as Judged by Newer Government Policies on
Concentration 68
The Issue of a Resource for Low-Income Families Unacceptable to a Major Segment
of the Client Population 69
The Issue of Spill-Over Effects on
Neighborhood Schools and Property Values 70 The Issue of Physical Design and
Maintenance Inadequacies and of Incongruity
with Surrounding Development 70
Conclusion 71
CHAPTER IV: CURRENT FLEXIBILITY AND RELOCATION
OPTIONS 84
CHAPTER V: A DEVELOPMENT PROPOSAL FOR NEW TOWNE
COURT/WASHINGTON ELMS 97
Introduction 100
Objectives 100
Funding Mechanisms 101101 Funding Mechani'sms
TABLE OF CONTENTS
Parties to the Proposed Action and Time Frame
Cambridge Housing Authority Option No. 1,
The Preferred Option
Page
Cambridge Housing Authority Option No. 2 105 Use of State and Federal Programs in Both
CHA Option Nos. 1 and 2
Cambridge Housing Authority Option No. 3 Discussion of Cambridge Housing Authority Options_
CHAPTER VI: DEVELOPMENT PROPOSAL IMPLEMENTATION_ Expansion of the Field of Participants_
Social Issues_ Political Issues_ Policy Issues_ APPENDIX A: APPENDIX B: APPENDIX C: APPENDIX D: APPENDIX E: APPENDIX F:
OFFICE MARKET SURVEYS FOR BOSTON AND
CAMBRIDGE 124
BUSINESSES AND PROPERTY OWNERSHIP ON MAIN STREET_
LOW-INCOME HOUSING IN THE CITY OF CAMBRIDGE
EXISTING LEASED HOUSING/RENT SUPPLEMENT PROGRAMS IN THE CITY OF CAMBRIDGE_
DEVELOPMENT PROPOSAL ASSUMPTIONS AND CALCULATIONS_
OWNERSHIP AND VALUE OF PROPERTY ON NORTH HARVARD STREET BETWEEN PORTLAND AND
WINDSOR STREETS_ LIST OF REFERENCES 129 137 172 176 201 203 102 103 106 107 107 116 117 117 118 119
LIST OF FIGURES
Page FIGURE 1: HALE'S MAP OF CAMBRIDGE (1830) 32 FIGURE 2: NEW DEVELOPMENT ON MAIN STREET (1980) 34 FIGURE 3: AERIAL VIEW OF MAIN STREET (1980) 35 FIGURE 4: MAIN STREET AS AN EXTENSION OF DOWNTOWN
BOSTON 36
FIGURE 5: PHASE I OF CAMBRIDGE CENTER (1981) 37 FIGURE 6: RIVERFRONT OFFICE PARK (1982) 38 FIGURE 7: NEW TOWNE COURT/WASHINGTON ELMS, CENSUS
TRACT 3524, CAMBRIDGE NEIGHBORHOOD 4 55 FIGURE 8: NEW TOWNE COURT (Mass. 3-5), SITE PLAN 56 FIGURE 9: NEW TOWNE COURT, TYPICAL BUILDING 57 FIGURE 10: NEW TOWNE COURT, GYMNASIUM 58 FIGURE 11: NEW TOWNE COURT, COURTYARD 58 FIGURE 12: WASHINGTON ELMS (Mass. 3-1), SITE PLAN 59 FIGURE 13: WASHINGTON ELMS, TYPICAL BUILDING 60 FIGURE 14: WASHINGTON ELMS, ENTRANCE 61 FIGURE 15: WASHINGTON ELMS, VANDALISM 61 FIGURE 16: WASHINGTON ELMS, EXTERIOR AREAS 62 FIGURE 17: WASHINGTON ELMS, COURTYARD 62 FIGURE 18: ACCEPTANCE-REJECTION RATE BY RACE
(12/75-1/77), WASHINGTON ELMS 72
FIGURE 19: ACCEPTANCE-REJECTION RATE BY RACE (1978),
NEW TOWNE COURT 73
FIGURE 20: OCCUPANCY BY RACE AND VACANCIES
(12/73-3/79) , NEW TOWNE COURT 74
FIGURE 21: OCCUPANCY BY RACE AND VACANCIES
LIST OF FIGURES Page FIGURE 22: FIGURE 23: FIGURE 24: FIGURE 25:
OCCUPANCY BY RACE AND VACANCIES (12/73-3/79), NEW TOWNE COURT/WASHINGTON ELMS
COMBINED 76
CAMBRIDGE LEASED-HOUSING PROGRAM, NUMBER 5 HASKELL STREET_
CAMBRIDGE LEASED-HOUSING PROGRAM, NUMBER 411 FRANKLIN STREET_
CAMBRIDGE TURNKEY-III LOW-INCOME HOME OWNERSHIP PROGRAM, 47 LOPEZ STREET_ FIGURE 26: NEW SMALL-SCALE ELDERLY DEVELOPMENT,
45 LINNEAN STREET_
FIGURE 27: NEW ELDERLY HOUSING, PUTNAM SCHOOL CONVERSION_
FIGURE 28: DIAGRAM OF PROPOSED NEW DEVELOPMENT, C.H.A. OPTION NOS. 1 & 2
FIGURE 29:
FIGURE 30: FIGURE 31:
SUMMARY OF PROPOSED DEVELOPMENT SQUARE FOOTAGE
CAMBRIDGE NEIGHBORHOODS CAMBRIDGE CENSUS TRACTS
85 86 87 88 89 98 99 138 146
TABLE I: TABLE II:
TABLE III:
TABLE IV:
SUMMARY AND DESCRIPTION OF PROPOSED NEW DEVELOPMENTS ALONG MAIN STREET_
STREET FRONTAGE OWNERSHIP AND/OR MAJOR DEVELOPMENTS ON MAIN STREET_ STREET FRONTAGE OWNERSHIP AND/OR MAJOR DEVELOPMENTS ON MAIN STREET BY SIDE OF STREET_
SELECTED POPULATION AND HOUSEHOLD CHARACTERISTICS OF TENANTS AT NEW TOWNE COURT AND WASHINGTON
ELMS (March, 1980)
33
46
48
77 TABLE V: RANK ORDER OF LARGER CHA LOW-INCOME
FAMILY DEVELOPMENTS BY PERCENT BLACK
AND HISPANIC HOUSEHOLDS (3/6/80) 78
TABLE VI: TABLE VII: TABLE VI3I: TABLE IX: TABLE X: TABLE XI:
ANALYSIS OF WAITING LIST FOR FAMILIES
NEEDING PUBLIC HOUSING IN CAMBRIDGE (7/17/79)
COMPARISON OF NEW TOWNE COURT, APARTMENTS WITH CURRENT MHFA
RECOMMENDED AREAS AND HUD MINIMUM PROPERTY STANDARDS_
COMPARISON OF WASHINGTON ELMS
APARTMENTS WITH CURRENT MHFA RECOM-MENDED AREAS AND HUD MINIMUM
PROPERTY STANDARDS_
RANK ORDER OF CAMBRIDGE ELEMENTARY
SCHOOLS AND LOCAL NEIGHBORHOODS BY
PERCENT MINORITY ENROLLMENT ACCORDING TO U.S. GOVERNMENT STANDARDS
(April 23, 1979)
RANK ORDER OF CAMBRIDGE NEIGHBORHOODS BY 1979 AVERAGE SALES PRICE OF 1-4 FAMILY HOMES
SUMMARY CHART OF ALL UNASSIGNED RELOCATION OPTIONS_ 79 80 81 82 83 93
LIST OF TABLES
TABLE XII: AVAILABLE UNITS IN OTHER CHA DEVELOPMENTS DUE TO NORMAL VACANCIES, ACTUAL OR PLANNED
MODERNIZATION 95 TABLE XIII: TABLE XIV: TABLE XV: TABLE XVI: TABLE XVII: TABLE XVIII: TABLE XIX: TABLE XX: TABLE Al:. TABLE A2: TABLE Bl: TABLE B2: TABLE B3: TABLE Cl:
SUMMARY CHART OF CHA RENT SUBSIDY AND RENT SUBSIDY TRUST FUNDS_
CHA OPTION NO. 1, PROCEEDS FOR RENT SUBSIDY FROM NEW COMMERCIAL AND RESIDENTIAL DEVELOPMENT_
CHA OPTION NO. 1, EFFECT OF A 15% RENT SUBSIDY INCREASE ON COMMERCIAL RENTS_ CHA OPTION NO. 1, JOB GENERATION FROM NEW OFFICE SPACE_
CHA OPTION NO. 1, ANNUAL REAL ESTATE TAXES TO THE CITY OF CAMBRIDGE_
CHA OPTION NO. 2, COST OF LAND TO
DEVELOPER (PER SQUARE FOOT) WITH UDAG GRANT PASSED THROUGH TO CHA FOR RENT SUBSIDY TRUST FUND_
CHA OPTION 3, SALE OF WASHINGTON ELMS TO M.I.T. FOR USE AS GRADUATE STUDENT HOUSING
FIELD OF PARTICIPANTS AND AREAS OF INVOLVEMENT, CHA OPTIONS 1, 2, AND 3 _ BOSTON MARKET SURVEY_
CAMBRIDGE MARKET SURVEY_
BUSINESSES OR ORGANIZATIONS LOCATED ON OR IN THE VICINITY OF MAIN STREET_ PROPERTY OWNERSHIP BY MAIN STREET BUILDING NUMBER_
PROPERTY OWNERSHIP BY MASSACHUSETTS
AVENUE BUILDING NUMBER AT LAFAYETTE SQUARE
SUMMARY CHART OF LOW-INCOME UNITS BY CAMBRIDGE NEIGHBORHOODS_ Page 109 110 111 112 113 114 115 121 125 128 130 133 136 139
LIST OF TABLES Page TABLE C2: TABLE C3: TABLE C4: TABLE C5: TABLE C6: TABLE C7: TABLE C8: TABLE C9: TABLE C1O: TABLE Cll:
RANK ORDER OF CAMBRIDGE NEIGHBORHOODS BY PERCENT AND TOTAL NUMBER OF
LOW-INCOME UNITS_
SUMMARY CHART OF LOW-INCOME FAMILY UNITS BY CAMBRIDGE NEIGHBORHOOD_
RANK ORDER OF CAMBRIDGE NEIGHBORHOODS BY PERCENT AND TOTAL NUMBER OF CHA, MHFA, AND HUD LOW-INCOME FAMILY UNITS RANK ORDER OF CAMBRIDGE NEIGHBORHOODS BY PERCENT AND TOTAL NUMBER OF ALL CHA LOW-INCOME UNITS (Family and Elderly)_ RANK ORDER OF CAMBRIDGE NEIGHBORHOODS BY PERCENT AND TOTAL NUMBER OF
LOW-INCOME FAMILY UNITS IN CHA HOUSING PROJECTS
RANK ORDER OF CAMBRIDGE NEIGHBORHOODS BY PERCENT AND TOTAL NUMBER OF CHA
UNITS IN LEASED HOUSING_
SUMMARY CHART OF LOW-INCOME UNITS BY CAMBRIDGE CENSUS TRACT_
RANK ORDER OF CAMBRIDGE CENSUS TRACTS BY PERCENT AND TOTAL NUMBER OF LOW-INCOME UNITS_
SUMMARY CHART OF LOW-INCOME FAMILY UNITS BY CAMBRIDGE CENSUS TRACT_
RANK ORDER OF CAMBRIDGE CENSUS TRACTS BY PERCENT AND TOTAL NUMBER OF
LOW-INCOME FAMILY UNITS_
TABLE Cl2: TABLE C13:
TABLE C14: TABLE C15: TABLE C16:
NEIGHBORHOOD 1, LOW-INCOME UNITS 151 NEIGHBORHOOD 3, LOW-INCOME UNITS 152 NEIGHBORHOOD 4, LOW-INCOME UNITS
NEIGHBORHOOD 5, LOW-INCOME UNITS NEIGHBORHOOD 6, LOW-INCOME UNITS
155 158 160 140 141 142 143 144 145 147 148 149 150
LIST OF TABLES Page TABLE C17: TABLE C18: TABLE C19: TABLE C20: TABLE C21: TABLE C22: TABLE C23: TABLE D:
NEIGHBORHOOD 7, LOW-INCOME UNITS NEIGHBORHOOD 8, LOW-INCOME UNITS NEIGHBORHOOD 9, LOW-INCOME UNITS. NEIGHBORHOOD 10, LOW-INCOME UNITS NEIGHBORHOOD
NEIGHBORHOOD
11, LOW-INCOME UNITS 12, LOW-INCOME UNITS NEIGHBORHOOD 13, LOW-INCOME UNITS_
EXISTING LEASED HOUSING/RENT SUPPLEMENT PROGRAMS IN THE CITY OF CAMBRIDGE
(March, 1980) 162 164 165 167 168 170 171 173 TABLE El: TABLE E2: TABLE E3: TABLE E4: TABLE E5: TABLE E6: TABLE E7: TABLE E8: TABLE E9:
ASSUMPTIONS FOR DEVELOPMENT
CALCU-LATIONS 177
CALCULATION OF ANNUAL RENT SUBSIDY FUND_ CHA OPTION NO. 1, COMMERCIAL DEVELOPMENT SUMMARY
CHA OPTION NO. 1, COMMERCIAL DEVELOPMENT FINANCING
CHA OPTION NO. 1, AMORTIZATION OF C.A.R.D. FINANCING (Years 1-10) CHA OPTION NO. 1, DEPRECIATION OF COMMERCIAL DEVELOPMENT (Years 1-10) CHA OPTION NO. l, COMMERCIAL
DEVELOPMENT NET TAXABLE INCOME
(CONSTRUCTION PERIOD PLUS YEARS 1-10)-___ CHA OPTION NO. 1, COMMERCIAL DEVELOP-MENT INCOME TAX (CONSTRUCTION PERIOD PLUS YEARS 1-10)
CHA OPTION NO. 1, COMMERCIAL DEVELOPMENT PRESENT VALUE OF NET CASH FLOW AFTER TAXES (CONSTRUCTION PERIOD PLUS YEARS
1-10)--INTERNAL RATE OF RETURN @15%
182 183 184 186 187 188 189 190
LIST OF TABLES TABLE E10: TABLE Ell: TABLE E12: TABLE E13: TABLE E14: TABLE E15: TABLE E16: TABLE E17:
CHA OPTION NO, 1, RESIDENTIAL DEVELOPMENT SUMMARY_
CHA OPTION NO. 1, PROCEEDS FROM CONDOMINIUM DEVELOPMENT_
CHA OPTION NO. 1, RESIDENTIAL RENTAL DEVELOPMENT FINANCING_
CHA OPTION NO. 1, AMORTIZATION OF MHFA FINANCING (Years 1-17)
CHA OPTION NO. 1, DEPRECIATION OF
RESIDENTIAL RENTAL DEVELOPMENT (Years 1-17)_ 191 193 194 196 197
CHA OPTION NO. 1, RESIDENTIAL RENTAL DEVELOPMENT NET TAXABLE INCOME
(CONSTRUCTION PERIOD PLUS YEARS
1-17) 198
CHA OPTION NO. 1, RESIDENTIAL DEVELOP-MENT INCOME TAX (CONSTRUCTION PERIOD
PLUS YEARS 1-17) 199
CHA OPTION NO. 1, RESIDENTIAL RENTAL DEVELOPMENT PRESENT VALUE OF NET CASH FLOW AFTER TAXES (CONSTRUCTION PERIOD
PLUS YEARS 1-17) -- INTERNAL RATE OF
RETURN @ 20% 200
TABLE F: OWNERSHIP AND VALUE OF PROPERTY ON NORTH HARVARD STREET BETWEEN PORTLAND AND
WINDSOR STREETS_
Page
The thesis begins with economic "boom" in the region focused on Massachusetts and the Greater Boston metropolitan area. Expansion is attributable both to a burgeoning high-technology sector and to continued transformation of Boston into a service capital of New England. Proximity to M.I.T.
and pressure on office space in downtown Boston foster
emer-gence of an East Cambridge office market at Kendall Square. An upturn in population and change in demography create other pressures on Cambridge housing stock.
Main Street in Cambridge is seen as a major link between the regional resource of M.I.T. and the financial and cultural resources of downtown Boston. Historically the commercial center of Cambridgeport, Main Street suffered a major decline in the mid-1800's after introduction of the Boston and Albany railroad. Today, presence of M.I.T. has spurred the revitalization of Main Street into a high-tech-nology/office center. Although frontage on Main Street is owned by relatively few entities, no attempt has been made to coordinate new development or to create a "special sense of place." Instead, both public and private efforts avoid Main Street and its public housing projects of New Towne Court/Washington Elms. Main Street therefore is an
under-utilized resource.
The issue of concentration of low-income families at New Towne Court/Washington Elms is discussed along with
"project-type" assistance to a large segment of low-income households,
spill-over effects on neighborhood schools and local property
values, physical design and maintenance inadequacies, and
incongruity with surrounding development. The projects
themselves, over forty years old with bonds almost entirely
paid off, are now over one-third vacant.
Combination of a large number of vacancies in other
Cambridge public housing, new small-scale public housing
development and a large number of new federal rent subsidies
create flexibility in the system for relocation of families
currently remaining at New Towne Court/Washington Elms. Once
relocation is completed, both land and buildings of New Towne
Court/Washington Elms are leveraged for creation of a local
Rent Subsidy Fund.
Three options for the Cambridge Housing Authority
are presented in the development proposal, including varying
benefits and degrees of risk.
While the Cambridge Housing
Authority has put other proposals forward, this proposal
is the only one which significantly addresses problems of
low-income concentration without reducing resources available
for low-income assistance.
To realize this proposal, traditional problems of
"deinstitutionalization" must be faced along with expansion
of the problem-solving arena to include larger numbers of
actors and institutional constraints.
In any solution,
however, major input from the U. S. Department of Housing
The Regional Economic Outlook
Trained in caution and pessimism by more than four decades of economic decline in which business after business fled the region looking for cheaper labor, lower energy costs and more hospitable governments, New England is allowing
itself only the barest whisper of excitement
these days over the news that seems writ large in every indicator: boom.
The change is so pervasive that economists
here are even predicting what would have been
foolishness even a few years ago -- that the
much-heralded recession, if and when it comes, will
not hurt New England much. The bolder ones are even hinting that the six states northeast of
New York may lead the country out of the recession. If the experience of last year is any
gauge, New England's problems in the 1980's will not be the typcial ones of declining industries,
decaying cities and a desolated work force.
Instead, the outlook is for a severe labor shortage and revitalized cities, as housing and population growth struggle to keep up with a new and
snow-balling demand for workers in the region's 26
cities.
This startling picture, which emerges
from interviews with business leaders and econo-mists and is presented daily in the reports of factory expansions and business growth, appears
to be the result of the final cruel bottoming-out of the region's long economic decline, a cleansing
shake-out of more than five decades duration
that began when the textile mills of Lawrence and Lowell, Mass., and Nashua and Manchester, N. H., moved south in the 1920's. The process having been completed, the logic goes, New England has nowhere to go but up and is heading there with
considerable speed.
Traditional industries such as textiles, apparel, paper, lumber and leather goods no
longer dominate the region's economy and now represent only 20 percent of the manufacturing output.
Today, the heart of the region's booming
economy and the bright spot on which all
the
optimistic predictions center is
the
high-tech-nology industry, whose companies make computers
and microprocessors, test equipment,
instant-picture cameras, optical and medical devices,
hand-held calculators, electronic games and a
host of other products. This sector now employs
200,000 people in the Boston area alone.
The expansion of these companies has been
so rapid -- with typical yearly growth of 35 to
50 percent -- that it masks the continuing
de-cline of some other sectors of the economy.
For
years, New England has ranked eighth among the
nation's nine regions in manufacturing growth.
Now it
ranks second.
And that growth appears unlikely to be
affected by the coming recession, according to
Dr. James Howell, chief economist and first vice
president for the First National Bank of Boston.
'Many of the high technology .companies
already have orders in hand for 35 and 40 percent
more business than they did last year,' Dr. Howell
said.
'They are going to come out of this very
strong,'
he said.
-
Unemployment, the region's traditional
scourge for decades, was 11.2 percent at the
depths of the 1975 recession when the nationwide
rate was 8.2 percent. But now the rate stands
at 4.5 percent, more than a full point lower than
the national average.
"National Economic Survey," New York Times,
January 6, 1980.
The Federal Reserve Bank of Boston (January, 1980
Report on Economic Indicators) further
notes that
nonagricul-tural employment in New England, during November 1979, reached
a record total of 5,403,300 jobs (seasonally adjusted).
Over
the year a total of 113,700 jobs were added to New England's
payrolls since January, 1979.
Both manufacturing employment
in durable goods (i.e., machinery, instruments, etc.) and
non-manufacturing employment (i.e., construction, trade
services, government, transportation, public utilities,
finance, insurance and real estate), on a percentage basis,
exceeded that of the rest of the country as a whole.
Massachusetts and Greater Boston as Major Areas for New
Investment
Within the New England region, Massachusetts -- with over half of the region's 12 million people -- and Greater
Boston, in particular, are major areas for new investment.
Research and academic institutions with strong track records
in technological innovation are located in the Commonwealth,
MIT alone having spawned over 400 technology-based start-ups.
Massachusetts is headquarters to 70 percent of the world's
minicomputer companies. Twenty-five of the top 100 emerging
high-technology growth companies (followed by Adams, Harkness
& Hill, Boston stockbrokers) are located in the State. The
Harvard Graduate School of Business Administration, MIT's
Sloan School of Management, a large pool of consulting
talent, and substantial amounts of venture capital from major
insurance companies are additional assets of the area.
In 1978, with the election of Governor King,
Massa-chusetts began a series of tax reductions aimed at improving
the climate for business. Taxes on home-based life insurance
companies, capital gains taxes, employment security and meals
taxes all were lowered. Property taxes, in most
Massachu-setts cities and towns, also were reduced.
High Technology's Promise of New Jobs
In return for a more favorable business climate,
the Massachusetts High-Technology Council promised that it
could deliver an additional 60,000 primary jobs and 90,000
new secondary jobs by 1983.
A recent report by Technical
Marketing Associates, Inc. (TMA) for the Massachusetts
Executive Office of Economic Affairs (10/79) has
sub-stantiated these claims.
The TMA report points to a 98 percent growth rate
in high technology in Massachusetts for the twenty-year
period 1958-1978. Also during that period, manufacturing
employment related to computers grew by 1,484 percent,
photography by 392 percent, instruments by 153 percent,
missiles by 54 percent, electrical components by 37 percent,
and communications equipment by 21 percent.
(This is in
contrast to a decline of 44 percent in employment related
to textiles, apparel and leather manufacturing and a decline
of 5 percent in employment for all other types of
manufactur-ing in Massachusetts.)
A disproportionately large share of employment in
the U. S. high-technology sector already is located in
Massa-chusetts. Over the next five years, the value of U. S.
terms at an average rate of 14 percent/year.
If local
com-panies continue to outperform industry averages, as in the
past, local employment growth in high technology could
reach 20 percent/year (D
&
S; U. S. Department of Commerce).
TMA, using conservative estimates of 9 percent and 12 percent,
(for low and high employment projections, respectively)
estimated that between 64,000 and 122,000 new jobs would
be created in the high-technology sector.
Seventy to 75
percent of those new jobs would be at technical, clerical
and production levels. Again using conservative estimates,
96,000 and 183,000 new secondary jobs would be created in
Massachusetts (by 1983) as a result of expansion in
high-technology industries.
Critical concerns of industry during this expansion
period are: taxes and the shortage of senior engineers, the
shortage of junior and entry-level engineers, shortage of
technicians, availability of production workers and shortage
of factory sites. Development of semiconductor technology
also is
a long-range concern.
Proximity to MIT, A Major Economic Asset
Of all factors in locational decisions, human resources
-- their availability, skills, productivity, education and trainability -- are now most important. Despite recent
increases in engineering enrollments, the supply of junior
and "entry-level" engineers will be unable to keep pace with
demand in the next five years.
Thus, MIT and Northeastern
University are critical assets for Massachusetts-based
electronics firms. Proximity to these institutions is of
major importance to employees at lower levels seeking
ad-vanced degrees. Companies in Massachusetts have approached
MIT for development of a closed circuit TV system between
factory and classroom -- similar to that used at Stanford
University in California. Although MIT has declined that
offer, factory and office development near to MIT are still
possibilities. Factory sites with good roads for access
to air transport are available in Cambridge's Kendall Square.
MIT also has decided to build a $5 million semiconductor
research facility on its Cambridge campus.
Transformation of Boston into a Service Capital of New England
In the past twenty years, total employment in the
United States has shifted from the goods-producing sector
of the economy to service and government sectors. Between
1958 and 1978, employment in service-related industries
increased by 136 percent and in State and local governments
by 129 percent. During the same period, increases in
whole-sale and retail trade employment were 79 percent and in
manufacturing, 23 percent. Employment in the finance,
insurance and real estate sector increased 88 percent; in
contract construction 47 percent; and in transportation and
public utilities 20 percent (Employment and Earnings, Bureau
of Labor Statistics, October 1978).
Expansion of these
develop-ment, and transformation, of downtown Boston and of the Greater Boston metropolitan area.
The largest percentage of downtown Boston's workers, 29 percent, are employed in finance, insurance and real
estate firms. Twenty-seven percent are employed in profes-sional service firms (i.e., engineering, accounting, law, printing). Sixteen percent are employed in transportation, communications and public utility firms. Finance, insurance and real estate firms, business and professional firms
--increasing 180 percent between 1966 and 1978 -- have been downtown Boston's fastest growing industries. Surveys of the Boston Redevelopment Authority report that, during the 1980's, leading growth firms in competitive downtown office space will be professional service firms. Through 1983, employment levels in professional service firms are expected to increase 20 percent over 1978 levels (approximately
1,200 jobs/year). In finance, insurance and real estate, employment levels are expected to increase 8 percent (500-600 jobs/year). There also will be small gains in the
print-ing and publishprint-ing trades.
The Emerging Office Market in Cambridge
Between 1978 and 1982, the expansion of downtown Boston firms will have absorbed approximately 600,000 gross
square feet of office space/year. 700,000 square feet of office space were leased in calendar year 1979 alone. Vacancy
rates for all of eastern Massachusetts and for Boston, in 1979, were 1.7 percent and .4 percent, respectively. One Post Office Square with 770,000 square feet (120,000 of
which are already pre-leased) is the only new office building currently under construction in downtown Boston. For the first time in Boston's history, the asking price for office
space is over $20.00 per square foot. Twenty-one percent of all newly announced construction in the Greater Boston
area has already been spoken for.
Cambridge, with lower real estate taxes, greater government assistance in doing business, vacant land in Kendall Square, 5 minutes from Boston's Government Center, 8 minutes from Boston's financial district, and 12 minutes from Logan Airport -- is experiencing the hottest concentra-tion of new activity. 792,000 square feet of new construction
on Main Street, announced for Phase I of Cambridge Center and for Riverfront Office Park, represents almost 50 percent of the existing Cambridge market. Thirty-two percent of Cambridge's newly announced construction has already been
pre-leased.
Cambridge Population Change and Pressures on the Housing Stock
Cambridge, for the first time in two decades, is also showing an increase in population, up 1.7 percent in 1975 from 100,000 to 102,000 people. The age group between 25 and 34 years old recorded the largest increase, up 44 percent
since 1970. This group now constitutes the fastest growing age group in the city. The fastest growing income group in Cambridge is families with incomes over $15,000. In 1975, almost 12 percent of Cambridge families had incomes over
$25,000.
Despite recent increases in Cambridge's housing stock (by 8.2 percent from 1970 to 1975), there is currently a
.5 percent vacancy rate. Many new units which have been built are either subsidized, for low-income families, or
condominiums for wealthier households. In 1979, a "converted condominium" in Cambridge cost as much as $90,000 (171-175 Hancock Street). A new condominium in Cambridge cost as much as $105,000 (337 Harvard Street).
Economic recovery of the region, increased in-migration of young people (entering higher education and
seeking jobs), a trend towards smaller household size and the boom in household formations have all had profound effects on both Cambridge's population and housing supply. A recent survey of new condominium owners by the Cambridge Community Development Department showed that almost two-thirds of Cambridge condominium owners are between the ages of 18 and
44 years old. Ninty-seven percent have attented college or college and graduate school. Seventy percent are profession-als. Seventy-two percent are single persons or married
Boston/Cambridge Momentum of Development
Following a "Decade of Development" with $12
billion in new capital investment from 1968-1978, Boston, itself, anticipates another $10 billion in new investment during the 1980's. More than eight million square feet of new office space will be built. As many as 1,000 new hotel rooms per year will be added. Substantial investments
will continue to be made in public transit, roads, bridges, port and airport facilities. Medical institutions and higher education facilities will expand. Boston Marine and
Indus-trial Parks will continue to grow. Cultural facilities are also under development and some 25,000 new dwelling units
will be built (BRA, "A Decade of Development in Boston",
May 1979).
Like Boston, Cambridge over the next ten years also forsees several billion dollars in new development. Kendall Square will provide 1,200,000 square feet of office space, 75,000-100,000 square feet of retail facilities, 200-250 hotel rooms and 100 apartments. Riverfront Office Park will con-tribute another 600,000 square feet of office space. MIT will complete development of the Whittaker College of Health
Sciences, Technology and Management and its new health facility, a Visual Arts Complex, a semiconductor research facility, expansion of the Sloan School of Management, a new sports building, MIT College and a 1200-car parking garage.
Main Street in Cambridge is the major link between
Boston's growing business, financial and cultural resources
and the regional asset of high technology at MIT. The
focusing of new growth pressures onto certain areas of Main
Street can serve both as a benefit to the City and an
opportunity for low-income families in the area.
It is
to
these ends that the remainder of this report addresses itself.
-32-ci, -P -P 0 . Cd fd fd (D H4 (t5 co .H 0 Cd .H Cd 0 H4 IL
TABLE I: SUMMARY AND DESCRIPTION OF PROPOSED NEW DEVELOPMENTS ALONG MAIN STREET
Development Development Description
Scheduled
Completion
MIT East Campus Expansion
Phase I: Whittaker College of Health Sciences, Technology and
Management; MIT Health Service Facility; Visual Arts Complex
Phase II: Sloan School Expansion;
Animal Care, Psychology and
related academic facilities; 1200-car parking garage
Phase III: MIT College; public events, commercial and general
academic space
Phase IV: Arts Complex completion; building linkages
(Total new construction:
690,000 square feet)
Cambridge Center Phase I: 250,000 square feet of (Boston Proper- office space
ties, developer)
Subsequent Phases: 950,000 square
feet of additional office space;
75,000 -100,000 square feet of retail space; 200-250-room hotel;
100 apartment units
Riverfront Office 600,000 square feet of office Park (Macomber space
Development Cor-poration, developer)
Kendall Square MBTA extension and modernization
Station of existing station
1981
1986
1988
1990
1981
1989
1982
1982
1/
1
liv II I /~' ~I.,/ id -,:
~ I/~~ /, ~"..' //
j(/
1,9' ,' -.-,I
~' -'\ 'M~" ~\7',
'S.,. ,,FIGURE 2: New Development on Main Street (1980). (1) Cambridge Center, (2) MIT East Campus Expansion, (3) MBTA Modernization of Kendall Square Station, (4) Riverfront Office Park. Number (5) is New Towne Court/Washington Elms.
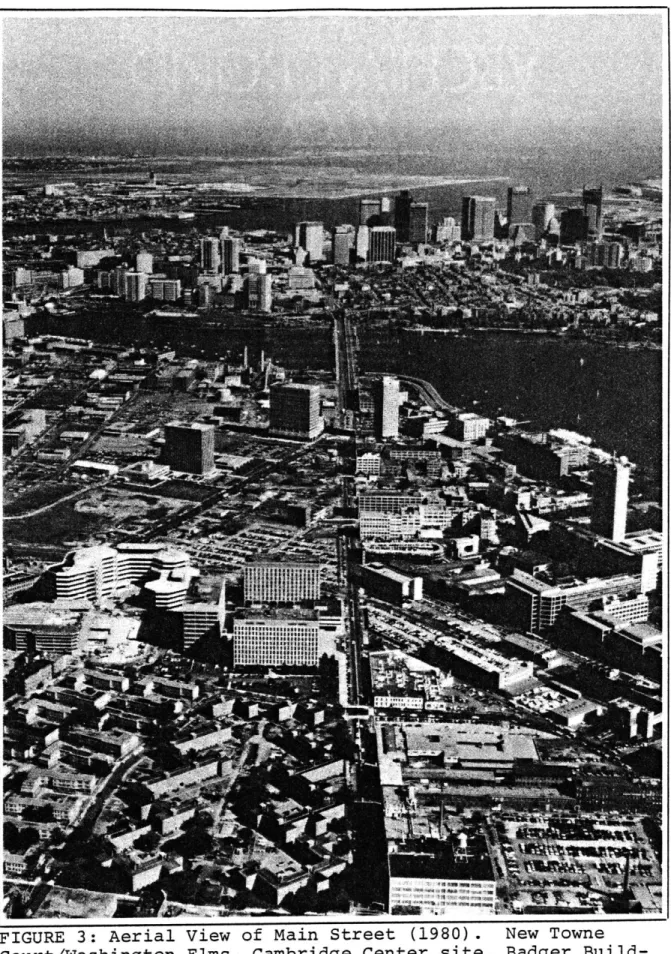
FIGURE 3: Aerial View of Main Street (1980). New Towne Court/Washington Elms, Cambridge Center site, Badger
Build-ing and Riverfront Office Park are on left. MIT is at right. Downtown Boston and Logan Airport are in the background.
J J~
:n-r1711
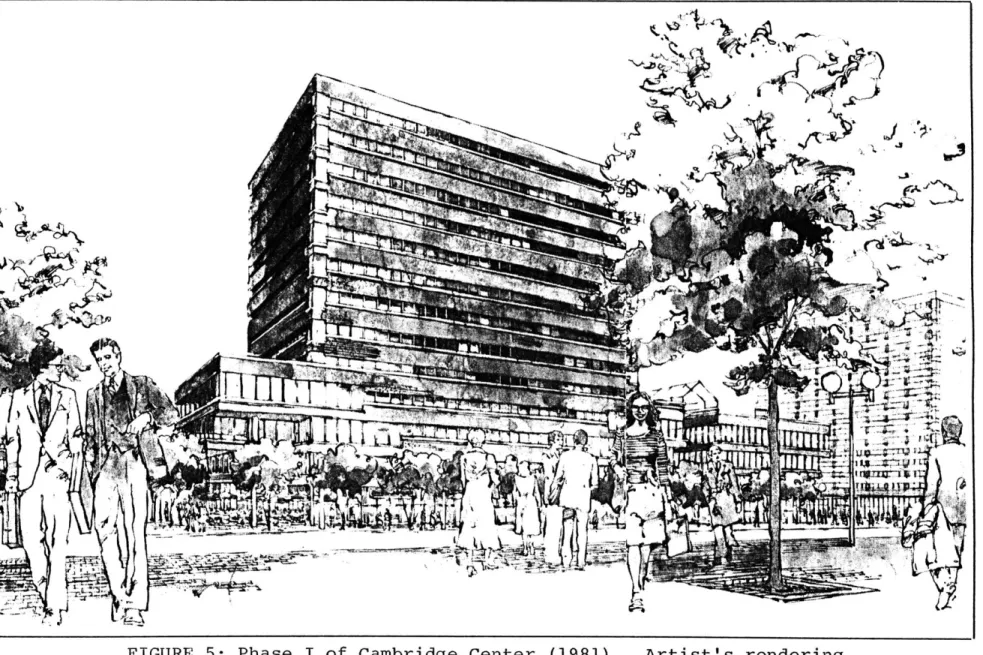
FIGURE 5: Phase I of Cambridge Center
VIA
Artist's rendering.
...
General Description
*
Approximately one mile long and six lanes wide,
Main Street via the Longfellow Bridge is the primary connec-tion of Cambridge's Central Business District to downtown Boston. Traffic from Harvard and Central Squares (to Boston) enters Main Street at Lafayette Square. Below grade, trains on the MBTA Red Line carry passengers between the two cities. At the intersection of Main Street and Broadway, Kendall
Square serves both as a Red Line station and major depot for bus transportation. East Cambridge is connected to Main
Street via Third and Sixth Streets, as is North Cambridgeport by Portland, Windsor and Columbia Streets. Tracks of the Boston and Albany Railroad cross Main Street, between Albany and Vassar Streets, alongside of Technology Square (Figure
2, p. 34).
Historically, Main Street was the center of the area's commercial development and only in more recent times, after introduction of the Boston and Albany Railroad, did the area develop industrially. Today, the presence of MIT has resulted in Main Street emerging as a high-technology/office center. There has been no attempt as yet to link new develop-ments or to create a "special sense of place". The presence
of New Towne Court/Washington Elms, with 600 units of
low-* Main Street has two traffic lanes in each direction
income housing concentrated on Main Street, possibly has
been a deterrent to this. However, unless new development
is coordinated, the impact will be substantially weakened,
projects which the City desires will go unfunded, and an
increased tax burden will be required to fulfill
municipal
needs.
Low-income households in Cambridge especially can benefit from
this new developemrt, as it may provide an opportunity
for
deconcentration
of families currently living at New Towne Court/Washington
Elms.
(Figures 1-6, pp. 32 to 38).
(Table 1, p.
33).
Main Street: An Historic Commercial District
Main Street, "the Highway to Pelham's Island" in
1630, was among the first streets in Cambridge. In 1793,
with the opening of the West Boston Bridge, Main Street
became the main route to Boston. Horse-drawn carriages made
one and then two trips daily between the cities.
In 1805,
President Thomas Jefferson declared the area a United States
port of delivery, ergo the name "Cambridgeport".
Cambridge-port then began to develop as a major commercial center.
Businessmen Rufus Davenport and Royal Makepeace incorporated
the Cambridgeport Proprietors, proceeded to dig a network
of canals and to establish a canal-oriented street pattern.
Development was eventually halted, however, when the Embargo
of 1807-1809 began.
Cambridgeport, its economy heavily dependent on
Boston-oriented suburb. Commuting was so easy, in fact, that
large numbers of Cambridgeport residents held jobs in Boston. In 1819, half-hourly carriage service was established across the Bridge. By 1948, 26 percent of Cambridgeport's popula-tion worked in Boston.
Inns, taverns and commercial structures developed along Main Street. With the conversion of the market center
and haymarket at Central Square, the area changed into a
business strip. In 1849, 83 out of 100 Cambridgeport retail
shops were located on "the strip" and commercial hegemony of Main Street and Massachusetts Avenue were established. One such business, the Davenport Car Manufactory, was nation-ally known for its manufacture of stages and carriages.
Later, it also became known for manufacture of railroad cars and engines.
Although at present areas around Main Street possess a high concentration of minority residents, historically residents were almost entirely of New England Yankee stock. Living close to workplaces, their houses were generally
clustered along Main Street and commercial routes to the north. Higher land areas, near Main and Windsor Streets, were areas of greatest residential concentration.
The Change from a Commercial to an Industrial Center
In the mid-1800's, after emplacement of what now are the Boston and Albany railroad tracks, Cambridgeport changed
from a commercial to an industrial center. Location of
the railroad bed (between Vassar and Albany Streets) blocked
Cambridgeport's commercial development from expansion to the
waterfront. It also created vast amounts of inexpensive
land for industrial use. Large numbers of immigrants
followed introduction of the railroad. First there were the
Irish, then Canadians, British, Germans, Swedes,
and Portugese.
Immigrants from Eastern Europe came to the area after 1900.
In 1854, the West Boston Bridge was replaced by a
second bridge. At the turn of the century (1900-1906),
that bridge was replaced by the Cambridge Bridge, designed
by architect Edmund M. Wheelwright and engineer William
Jackson. Later, the Cambridge Bridge was renamed Longfellow
Bridge. Then, in 1912, the Massachusetts Institute of
Technology located its campus on filled mud flats of the
Charles River Basin.
Slum clearance and urban renewal at Main and Windsor
Streets, during the period 1937-1941, brought the publichousing projects of New Towne Court and Washington Elms.
In
1955, the Cambridge Redevelopment Authority and MIT
collabo-rated to build Technology Square. In 1964, the National
Aeronautics and Space Administration decided to build an
electronics research center. Twenty-nine acres in Kendall
Square, with an additional 14 acres,were set aside for private
development. In 1969, construction of the Badger Building
at Kendall Square was begun.
In 1970, after numerous
buildings had already been torn down, the Nixon Administra-tion stopped construcAdministra-tion of the NASA Center. Structures used by the Department of Transportation, and vacant land,
now are all that remain of the project.
MIT and Development of Main Street as a High-Technology!
Office Center
Presence of the Massachusetts Institute of Technology has been, and continues to be, a major force in Cambridge-port's economic development. Technology Square, developed in cooperation with the Cambridge Redevelopment Authority, is home of the Polaroid Corporation, Draper Laboratories, Computer Corporation of America, and Honeywell Information Systems Incorporated. U. S. Department of Transportation
is located at the former NASA site and Badger Company, New England Bank Association, Index Systems Inc. and TMI
Corpora-tion are located at One Broadway. Bioran Medical Laboratory, Kentron International Inc. and General Latex and Chemical
Corporation are among other businesses also located in the
area (Appendix B, p.129)
Almost two-thirds of all Main Street frontage (north and south) is controlled by six entities: MIT; the Cambridge Redevelopment Authority; Cambridge Electric Light Company; Darvel Realty Trust; Cabot, Cabot and Forbes; and the Badger Company. Seventy-five percent of all Main Street frontage
Cambridge Housing Authority is included. MIT now owns
38 percent of south Main Street frontage and, after planned acquisitions, will own 63.4 percent. Almost 19 percent of north Main Street frontage is accounted for by Technology
Square and the Badger Building. Cambridge Center and
River-front Office Park (when developed) will represent another
47.1 percent of north frontage (Tables II, and III,
pp. 46, and 48).
Both Technology Square and the Badger Building are
already developed as "Class A" office space. MIT has begun
construction of its East Campus health facility and Visual Arts Center. The Cambridge Redevelopment Authority (with Boston Properties, Inc.) has begun construction of Phase I
of Cambridge Center. Cambridge Electric Light Company and Darvel Realty Trust are also now marketing Riverfront
Office Park.
Main Street As An Underutilized Resource
All new development is located at the eastern end of Main Street, near Longfellow Bridge and away from the public housing projects of New Towne Court/Washington Elms.
Despite the fact that Main Street is of relatively short length (with frontage controlled by comparatively few
entities), no attempt has been made to link these developments
or to focus growth along the entire street. There has been no effort to revitalize the area as an historic commercial
district through either coordinated design review or an Urban
Development Action Grant (UDAG).
The Central Square
Commercial Area Revitalization District (CARD) focuses away
from Main Street onto Massachusetts Avenue. Cambridge's
present UDAG grant for $6.8 million, likewise, focuses
to-wards the Cambridge waterfront. Failure to capitalize on
the potential for Main Street to create a unified business
district thus weakens all new development. It jeopardizes
both greater benefits to the City of Cambridge and
possi-bilities
for assisting low-income families in the area.
TABLE II: STREET FRONTAGE OWNERSHIP AND/OR
DEVELOPMENTS ON MAIN STREET
Property Owner or Major Develop-ment Street Frontage in Feet (and Street Side) Percent of Total Main Street Frontage
Current Status Future Announced Development MIT Current Ownership MIT Planned Acquisitions 1757 (south) 1175 (south) 19.0 12.7
Sloan School of East Campus Management; East- Expansion gate Apartments;
Kendall Square Building, other
Carr Fasteners; East Campus Fire Station; Expansion Polaroid; F & T
Diner; Cambridge
Press; Renaldi File Company; Electronics
Corporation of
America; A. D. Little Company
MIT (Total Current Ownership and Planned Acqui-sitions Cambridge Center (Boston Properties, developer) Riverfront Office Park (Macomber Development Cor-poration, developer) Cambridge Housing Authority 2932 (south) 1269 (north) 900 (north) 800 31.8 13.8 as above
Vacant land owned
by the Cambridge
Redevelopment Authority; subway
and bus terminal owned by the MBTA
9.8 Vacant land owned
by Cambridge
Elec-tric Light Company
and Darvel Realty Trust
8.7 New Towne Court, public housing project East Campus Expansion 1,200,000 square feet of office space; 75,000 -100,000 square feet of retail space; 200 - 250-room hotel; 100 apartment units 600,000 square feet of office space MAJOR
STREET FRONTAGE OWNERSHIP AND/OR MAJOR DEVELOPMENTS ON MAIN STREET, continued Property Owner or Major Develop-ment Street Frontage in Feet (and Street Side) Percent of Total Main Street Frontage
Current Status Future Announced Development
Technology Square (Cabot, Cabot and
Forbes Company) Main Street Garage
Incorporated S & M Realty Nabisco Company Polaroid Corporation 713 (north) 375 (south) 238 (south) 225 (south) 200 (south) General Latex and 175
Chemical Corporation (south)
7.7 550,000 square feet of office space Built 1960-66 4.1 Polaroid Corpora-tion 2.6 2.4 2.2 Polaroid Corpora- --tion Candy factory --Polaroid Corpora- --tion 1.9 Chemical plant
The Badger Company
Others (U-Haul, Kaplan-Baer Trust, etc.) Total 150 (north) 1250 (north and south) 9227 (north and south) 1.6 13.5 220,000 square feet of office space Commercial establishments Built 1969 100.0
TABLE III: STREET FRONTAGE OWNERSHIP AND/OR MAJOR DEVELOPMENTS ON MAIN STREET BY SIDE OF STREET
Property Owner or Major
Development
Cambridge Redevelopment
Authority
Street Frontage Owned (in feet)
888
381
Cambridge Center (total)
Cambridge Electric
Darvel Realty Trust
Riverfront Office Park (total)
Cambridge Housing Authority
Technology Square
The Badger Company
Others Total
1269
700
200
900
800
713
150
769
4601
Percent of North Main Street Frontage 19.3 8.3 27.6 15.24.3
19.517.4
15.5
3.316.7
100.0Property Owner or Major
Development
MIT (Eastgate and Sloan)
MIT (other)
MIT Total (currently owned)
Street Frontage
Owned (in feet)
463
1294
1757
Percent of South Main Street Frontage10.0
28.0
38.0
MBTASTREET FRONTAGE OWNERSHIP AND/OR MAJOR DEVELOPMENTS ON MAIN STREET BY SIDE OF STREET, continued
Property Owner or Major
Development
Street Frontage
Owned (in feet)
Percent of South Main Street
Frontage MIT Planned Acquisitions
for East Campus Development
MIT Total (currently owned
and planned acquisitions)
Main Street Garage
S & M Realty
Nabisco Company
Polariod Corporation
General Latex &
Chemical Corporation U-Haul Others Total
1175
25.4
293263.4
375 238 225 200 175150
331
8.15.1
4.9
4.3
3,8
3.2
7.2
4626 100.0CHAPTER III: THE PUBLIC HOUSING PROJECTS OF
DEVELOPMENT SUMMARY SHEET: NEW TOWNE COURT
Ownership:
Management:
CHA Identification
Number:
Development Type:
Year Built:
General Location:
Land:
Cambridge Housing Authority
Cambridge Housing Authority
Mass. 3-5
Federally-Aided Family Development
1937
Adjacent to Technology Square; bordered
by Portland, Washington, Windsor and
Main Streets 376,537 sq. ft. (8.6 acres) Present Zoning: Existing Structures: Condition of Exist-ing Residential Structures:
C-1 Residential District (i.e., multi-family, apartments, hotels, dormitories)
Floor Area Ratio: .75 Maximum height: 35 feet
Dwelling units/acre: 36
6 residential buildings, 3-story masonry, walk-up: 80 one-bedroom units 106 two-bedroom units 92 three-bedroom units 4 six-bedroom units 282 total units
gymnasium and administration building, 1-story masonry
boiler room and garage, 1-story masonry Masonry good. Bathrooms modernized and
window sash replaced (1972). New hot water feeder lines (1977). New
under-ground steam and electrical distribution lines, hallways renovated, and kitchens
modernized (1978).
All six buildings must be reroofed.
Domestic hot water tanks and 20% of all radiators need replacement. Security measures needed: security lights, window
DEVELOPMENT SUMMARY SHEET: NEW TOWNE COURT, continued
locks. Vandalized mailboxes need to be
replaced.
Courtyards need extensive renovation.
Development Occupancy: Original Mortgage: Outstanding Modernization Notes: Annual HUD Contribution (4/79-3/80):
225 units occupied; 57 units vacant.
Bonds repaid.
$2,284,284 (due 10/10/80).
$334,702.
DEVELOPMENT SUMMARY SHEET: WASHINGTON ELMS
Ownership:
Management:
CHA Identification
Number:
Development Type:
Year Built:
General Location:
Land:
Cambridge Housing Authority
Cambridge Housing Authority
Mass. 3-1
Federally-Aided Family Development 1941
Adjacent to Draper Laboratories and
Technology Square; bordered by Portland,
Harvard, Windsor and Washington Streets
322,853 sq. ft. (7.4 acres) Present Zoning:
Existing Structures:
Condition of
Exist-ing Structures:
C-1 Residential District (i.e., multi-family, apartments, hotels, dormitories) Floor Area Ratio: .75
Maximum height: 35 feet
Dwelling units/acre: 36
18 residential buildings, 3-story masonry, walk-up 89 one-bedroom units 105 two-bedroom units 89 three-bedroom units 34 four-bedroom units 1 five-bedroom unit 1 six-bedroom unit 1 seven-bedroom unit 320 total units No other structures
Masonry fair. Electrical meter boards and electrical distribution within each
unit upgraded (1972). All buildings
re-roofed, kitchens and bathrooms moder-nized (1975). Hallways renovated and exterior security lighting installed
(1977). Hot water supply lines and
apartment windows replaced, also some plumbing repair and limited work on
DEVELOPMENT SUMMARY SHEET: WASHINGTON ELMS, continued
Roofs again need to be repaired. Under-ground steam distribution lines and
coils in central hot water system need
replacement. Security measures needed:
additional security lighting, window
guards, hallway and apartment door locks
replaced. Vandalized mailboxes also need replacement.
Courtyards need an entire redesign and
renovation. Development Occupancy: Original Mortgage Outstanding: Outstanding Modernization Notes: Annual HUD Contribution (4/79-3/80):
170 units occupied; 150 units vacant.
$235,000 (due 4/1/82).
$1,055,782 (due 10/10/80).
$368,855.
Juu r..; /: I ew -rowne Luu. t/.Was ./a %V. m&, en
3524, Cambridge Neighborhood 4. Orientation map.
U.4
LI
S
N
WINDSOR STREET
FIGURE 8: New Towne Court (Mass. 3-5), (Source: Cambridge Housing Authority.)
Site Plan. I Iy.jr3nt Hydrant Hyd rant
10
Hydrnt Hdr/i~1r2~t
'0/
/
'/4
liii
i~i
~L
I
I
I
tt~
I~
Ii
K
Sc
11
D e r
-FIGUE 9:New Own orTpclBidn.Badd pwnoso rudforidct
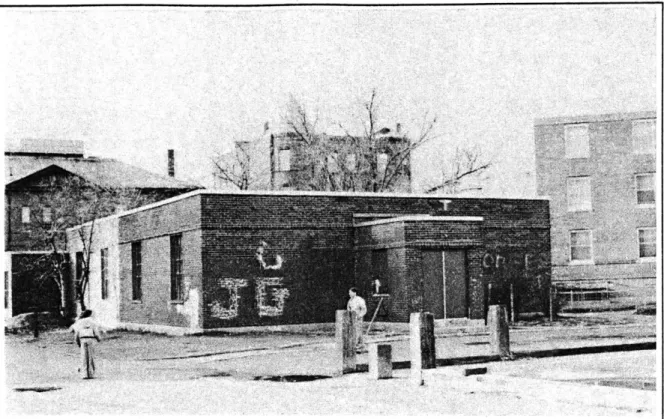
FIGURE 10: New Towne Court, Gymnasium. Closed for nearly ten years, the building shows signs of abuse and neglect.
FIGURE 11: New Towne Court, Courtyard. Open space used for clothes-drying is also a playground for project children.
PORTLANO
WINSO R STREET
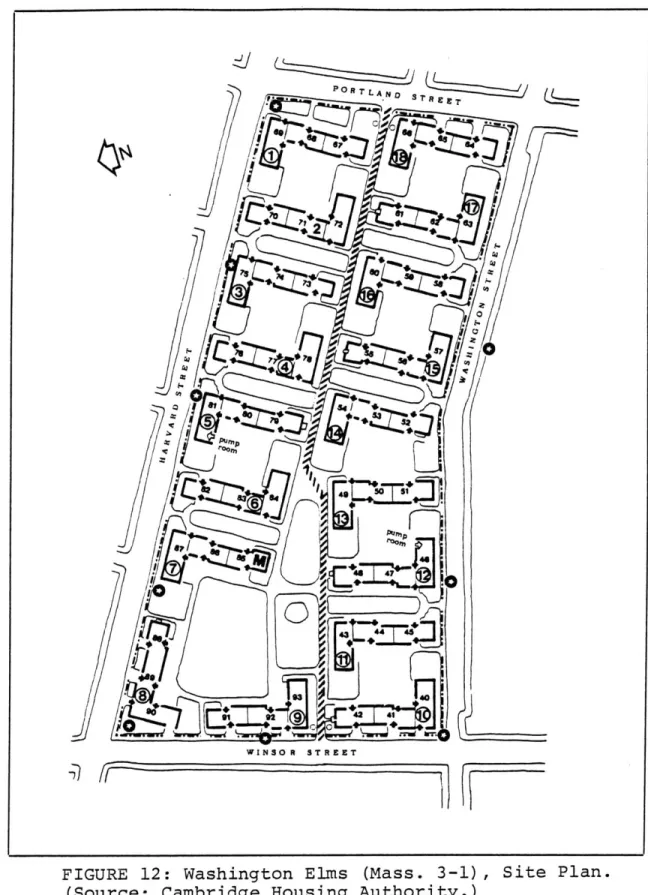
FIGURE 12: Washington Elms (Mass. 3-1), Site Plan. (Source: Cambridge Housing Authority.)
FIGURE 13: Washington Elms, Typical Building. Barracks-like design, boarded windows and graffiti add to desolation of the project environment.
FIGURE 14: Washington Elms, Entrance. Boarded-up windows indicate large numbers of vacancies.
FIGURE 15: Washington Elms, Vandalism. Broken benches are symbolic of the abuse and neglect 'of exterior grounds.
FIGURE 16: Washington Elms, Exterior Areas. Graffiti and accumulated rubbish indicate a lack of maintenance.
FIGURE 17: Washington Elms, Courtyard. Due to the lack of adequate playing fields, children play ball in courtyards.
Project and Area History
Constructed in 1937 under the U. S. Public Works Administration, New Towne Court (Mass. 3-5) is the oldest
and second-largest public housing project in Cambridge. In 1941 Washington Elms (Mass. 3-1), the City's largest and second-oldest public housing project, was constructed
adjacent to New Towne Court. These projects, representing a combined total of 618 low-income units, replaced nearly two hundred small buildings, obliterated eight streets and combined fourteen small blocks in what at the time had become one of the worst slum areas in the City: Census Tract 3524,
Cambridge Neighborhood 4 (Figures7 through 17, pp. 55 to 62). Thirty years later, in 1970, Census Tract 3524 and Neighborhood 4 again were among the worst areas in the City.
Compared to other Cambridge census tracts, Census Tract 3524 (two-thirds of whose households are located in New Towne
Court/Washington Elms) had:
- the largest percentage of people below poverty level (more than twice the citywide rate);
- the largest percentage of households below poverty level;
- the lowest median family income;
- the highest percentage of civilian labor force unemployed;
- the largest number of Four-Agency caseloads;
- the largest number of families receiving Aid to
Families with Dependent Children;