HAL Id: hal-00959747
https://hal.archives-ouvertes.fr/hal-00959747
Submitted on 16 Mar 2014
HAL is a multi-disciplinary open access
archive for the deposit and dissemination of
sci-entific research documents, whether they are
pub-lished or not. The documents may come from
teaching and research institutions in France or
abroad, or from public or private research centers.
L’archive ouverte pluridisciplinaire HAL, est
destinée au dépôt et à la diffusion de documents
scientifiques de niveau recherche, publiés ou non,
émanant des établissements d’enseignement et de
recherche français ou étrangers, des laboratoires
publics ou privés.
A method to select a successful interoperability solution
through a simulation approach
François Galasso, Yves Ducq, Matthieu Lauras, Didier Gourc, Mamadou
Camara
To cite this version:
François Galasso, Yves Ducq, Matthieu Lauras, Didier Gourc, Mamadou Camara. A method to
select a successful interoperability solution through a simulation approach. Journal of Intelligent
Manufacturing, Springer Verlag (Germany), 2016, 27 (1), p.217-229. �10.1007/s10845-014-0889-4�.
�hal-00959747�
A Method to Select a Successful Interoperability
Solution through a Simulation Approach
François Galasso1, Yves Ducq2, Matthieu Lauras1,3,
Didier Gourc1 and Mamadou Camara2
1 University of Toulouse, Mines Albi, Campus Jarlard, Route de Teillet, 81013 Albi, France {matthieu.lauras, francois.galasso, didier.gourc}@mines-albi.fr
2 Univ. Bordeaux – IMS – UMR 5218 CNRS – 351 cours de la Libération – 33405 Talence cedex, France – {yves.ducq, mamadou.camara}@u-bordeaux1.fr
3 University of Toulouse, Toulouse Business School, Boulevard Lascrosses, 31000 Toulouse, France
Abstract. Enterprise applications and software systems need to be interoperable
in order to achieve seamless business across organizational boundaries and thus realize virtual networked organizations. Our proposition can be considered as an interoperability project selection approach and is based on 3 steps: (1) Modelling both collaborative business processes and potential related interoperability projects; (2) Evaluating the accessibility of each project regarding the current state of the organization; (3) Simulating each project and assessing the associated performance. These results are finally projected on a comparison matrix used as a decision support to select the most appropriate interoperability solution. An application case extracted from the French aerospace sector demonstrates the applicability, the benefits and limits of the proposition.
Keywords: Collaborative Network; Interoperability; Performance Measurement System; Decision Support System; Simulation.
1. Introduction
There is a growing interest in solutions enabling companies to work together more effectively. A wide variety of collaborative systems exists and addresses different aspects of this complex problem while providing different benefits to networked enterprises. Thus, enterprise interoperability is crucial for companies and especially in decentralized, flexible and networked manufacturing system environment.
Interoperability is defined as “the ability for a system or a product/service to work with other systems or products/services without special effort of the part of the user” (Chen et al. 2008). Enterprise Interoperability (EI) is defined as “the ability of an Enterprise to interact with other Enterprises not only on an Information Technology point of view but also on organisational and semantic point of views. This interaction must be flexible and developed at the lower cost” (INTEROP 2006).
Enterprise applications and software systems need to be interoperable in order to achieve seamless business across organizational boundaries and thus realize virtual networked organizations. But interoperability should not only be considered a property of informatics systems. The diversity, heterogeneity, and autonomy of
software components, application solutions, business processes, and the business context of an enterprise must also be considered (Chen et al. 2006).
But in practice, networked business encounters recurrent difficulties and only very limited success has been made due to the ongoing evolution of systems, the speed of market changes and growing complexity (Panetto and Molina 2008), (Jochem 2010). Facing this huge complexity, decision-makers are confronted to the difficulty of choosing an accurate and relevant interoperability investment for their networked enterprises.
An interoperability investment is intended to improve interactions between enterprises of the network in general (or supply chain) by means of technological solutions. The interoperability project is the planning and implementation of the interoperability investment. Qualitative and quantitative approaches were developed previously in the literature to measure and improve interoperability. Those approaches do not propose any mechanisms for prior validation of interoperability solutions. By prior validation we mean being able to evaluate, earlier in the project, the two following elements: the potential improvement that will result from the solution’s implementation; and the impact of this interoperability improvement on the achievement of objectives of enterprises in the network at operational, tactical and strategic levels.
As for any decision-making, such a choice depends on the capacity of the decision maker to assess: (i) the current situation – What happened until today? What is the current progression (in a broader sense)? – and (ii) the possible interoperability solutions and their related impact (information systems, business processes, organizational…) – What will happen and what are the consequences for the network?
Performance evaluation appears as a natural tool to design/modify/improve the interoperable solution of a networked enterprise. But judging an interoperability solution's performance in practice is very situation-specific and so complicated.
In accordance with the above, the objective of this paper is to present a complete methodology in order to help decision-makers for the selection of the best interoperability solution (or at least the most appropriate), proposed in a project for their businesses at the scale of the network. Concretely, the method must enable to a
priori evaluate and compare the performance of different interoperability solutions in a networked enterprise. This research work is a part of the French ISTA-3 research project (3rd generation Interoperability for Aeronautics Sub-contractors).
The paper is divided into three main parts. Firstly, the literature related both to performance measurement systems in general and to performance for interoperability are discussed as well as literature dedicated to project management. From this background, our research statement is justified and exposed. Then the proposed method is presented in order to: (i) evaluate and compare interoperability solutions in a networked enterprise by exposing how to evaluate the accessibility of a project; (ii) evaluate the whole performance of each solution in order to select the most appropriate one. Next, a real case application relating to an aerospace network is presented. Conclusions and perspectives of this methodology are given at the end.
2. Literature Review
2.1. From Performance Measurement to Interoperability Measurement
When defining a method to select an interoperability solution based on its performance improvement, the first literature review must be dedicated to performance measurement methods from the general ones to those dedicated to interoperability measurement.
The domain of performance measurement has been investigated for more than twenty years leading to a lot of methods around the world, developed either by researchers or practitioners, in order to define and implement indicators. All these methods have been developed independently based on system theory, production management theory or accounting methods, according to the background of developers. Ravelomanantsoa (2009) has identified more than thirty methods for Performance Measurement System (PMS) definition and implementations, covering methods, tools, models, and generic list of Performance Indicators (PI). Among all these thirty methods, more or less used and well known, one can cite the famous ones or the most used or disseminated around the world as Balanced Score Card (BSC) (Kaplan and Norton 1996; Neely et al. 2002; Ducq and Vallespir 2005; Bititci et al. 1997; Ghalayini et al. 1997).
However, all these methods being mainly developed for generic PIs, none of them are dedicated to the measurement of interoperability performance. For instance, in the BSC, no perspective is dedicated to collaborative performance, as well as in PRISM or in QMPMS. Indeed, all these methods are dedicated to measurement of performance of a single company and interoperability aspects are not addressed.
For instance, even if BSC has been applied to many different companies, no example are proposed for interoperability because it is quite impossible to relate the perspectives (financial, customer, organisation & learning and internal processes) with the notion of interoperability. So PI related to internal processes could do the job but this is very limitative in comparison to the balanced and transversal principles of the method. Another solution could be to weight the BSC Perspectives according to interoperability challenges but this would be difficult to implement and would depend too much on the expert point of view.
Other models have been developed as Supply Chain Operational Reference model (SCOR 2010) or Value Reference Model, which provide pre-defined measurable PI for Value Chain goals in several dimensions (Value Chain Group 2012). However, no PI dedicated to interoperability as well as PI dedicated to the measurement of interoperability impacts are proposed.
Existing metrics dedicated to interoperability measurement have been analyzed in (Chen and Daclin 2007) who considered three types of interoperability measurement: (i) potential measurement (interoperability level whatever the partner is), (ii) compatibility measurement (interoperability level according to a specific partner to remove barriers) and (iii) performance measurement during the operational phase using performance metrics of time, quality and cost of interoperation between two companies.
However, as for the previous models the concepts are defined but no PI is proposed to measure interoperability.
Nevertheless, the performance metrics of time, quality and cost of interoperation between two companies, will be considered in our proposed method.
Even if some metrics dedicated to interoperability measurement have been proposed, they are not related to traditional business performance metrics in order to show the impact of interoperability improvement on the business performance in particular at the network level. The challenge is to propose strategic PI based on detailed measures (business and interoperability measures) in order to detect the best interoperability solutions at the level of the network. About this challenge, several authors pointed out the need for the community and practitioners to develop accurate and relevant performance measurement approaches able to support decision-making in interoperable environment. However, for many years, specialists (Beamon 1999; Gunasekaran and Kobu 2007; Akyuz and Erkan 2010) have highlighted the limitations at the networked scale of solutions described previously and in use today. Recently, authors such as Gunasekaran and Kobu (2007); Alfaro et al. (2009); Akyuz and Erkan (2010) have confirmed that academics and practitioners are still in need of a new PMS, which can handle the requirements of the new enterprise networks. These
authors affirm that such a PMS dedicated to interoperability should measure, locally and globally, the performance of the network in order to make decision at the global level to the best interoperability solution. They explain that there is a need for a PMS to assess in advance the potential results of one or another interoperability solution. This is the finality of a priori performance evaluation.
A priori performance evaluation consists in anticipating the future performance of the system (in our case, of the networked enterprise). This includes three main steps: (i) Innovation: explanation and objectives; (ii) Implementation: variables and indicators choosing; (iii) Observation: simulation through a model. This kind of performance evaluation is based on an enterprise model and on a simulation approach to evaluate the probable future results of each PI (local and global in our case). One main difficulty relates to the design of the model and the link to the simulation approach.
Consequently, a PMS dedicated to interoperability should be based on accurate and relevant enterprise models (that is to say, a business process model able to focus on interoperability components of the network) on one hand, and based on a associated simulation tool (that is to say, a tool able to simulate the previous enterprise modelling and to measure the different KPI) on the other hand.
2.2. Interoperability Projects
Interoperability solutions can only be considered through the projects that implement them. Project can be defined as "a temporary undertaken to create a unique product, service or result" (PMI 2008).
Professional organisations as well as standards bodies have for several years produced guides and books on project management and good practice. For instance, PMI
(Project Management Institute) developed a guide to the Project Management Body of Knowledge (PMBoK) (PMI 2008). This guide is process-based, meaning it describes the work as being accomplished by processes, structured as nine knowledge areas. It offers project manager's processes they have to implement and the indicators they have to manage in order to reach project objectives. Among these knowledge areas we can cite as example: Project Scope Management; Project Time Management; Project Cost Management; Project Quality Management; Project Human Resource Management and Project Risk Management. Our method is consistent with PMBoK as other management standards like Software Engineering Institute's CMMI and Prince2.
Interoperability project can be characterized as a collaborative project with an interest to develop an interoperability solution within a networked organization. Despite numerous improvement efforts, many interoperability projects have problems to be delivered on time, within budget, with all the required features and functions. Actually, notably due to the distributed nature of the stakeholders, the project management success, the project success and the product success of this kind of project are not guaranteed. Considering that the project size influences budget and project quality, while project complexity influences the use of specific project management practices (Martin et al. 2005), we could explain this fact by the:
- Inherent complexity of such a project; - Difficulty to predict cost-benefit ratio.
The definition of project complexity has been covered by various contributions and research works (see (Baccarini 1996) and (Vidal et al. 2011) for a survey on this subject). In summary, project complexity can appear in different forms and arise from various sources with different levels of intensity. Intensities can vary over time, and this variation underlines the dynamic aspect of project complexity. Baccarini (1996) explains in his review of literature that complexity is a distinctly different concept to two other project characteristics: size and uncertainty. Both practitioners and academics have difficulties accepting and treating projects as complex systems, and tend to reduce the management of projects to the application of tools such as PERT, WBS, earned value, etc. (Geraldi and Adlbrecht 2007). When complexity becomes too great, the possibilities and interrelations become so fuzzy that the system has to be assisted by appropriate tools and skills. Consequently, managers facing complex projects, such as interoperability projects, need access to a decision-making aid model.
This point clearly justified the purpose of this paper that consists in supporting the choice of the best interoperability solution and by the way the best interoperability project, in a given environment.
Over the years a variety of techniques have been proposed to help solving the problem of making accurate, yet early, project predictions in order to make good project selection. The existing methodologies for project selection range from multiple criteria scoring models and ranking methods to subjective committee evaluation methods (Blanc 2006). In both categories, the project prediction is organized following two dimensions that are: (i) the potential result of the project
(kind of “benefit”) and (ii) the potential effort to produce to operate the project (kind of “cost”).
This potential effort considers the gap between the current and expected state of the enterprise and characterises what will be called the “accessibility” of a project hereinafter.
In the previous section we presented a background on existing methods able to assess the performance of an interoperability solution. In other words, we discussed about the performance of the deliverable of an interoperability project. In this section, we are studying the second dimension of the problem by discussing how decision-makers can dread the difficulty to operate such or such project corresponding to such or such interoperability solution.
Numerous models and methodologies have been developed to support project managers in dimensioning their projects. Many of them involve the use of historical data (from previous projects) in order to develop prediction systems. Different factors are considered to size the project effort: number of people working on the project, length of the project, budget allocated for the project, etc. Some approaches allow doing that by involving the use of general models or prediction systems that are parameterized to account for differences between project environments. The most known examples in Information Systems domain are COCOMO (Constructive Cost Model), COCOMO 2.0, and Function Point analysis (Boehm et al. 1995). These approaches need to estimate input parameters like thousands of source lines of code (SLOC) in a numerical unit (COCOMO approach). The capacity of estimating this input parameter depends on the availability of formal historical data on past projects or the availability of human competencies in the organization for an assessment by analogy.
Classically, companies have no or very few experience in terms of interoperability project. In fact, the concept is relatively new and generally the selection and the implementation of an interoperability solution is a one-shot operation for a company.
Consequently the use of mathematical effort estimation methods, like COCOMO or Function point method, seems to be difficult in such a context and probably the use of more qualitative approach should be used to assess the accessibility of an interoperability project.
Nevertheless, this accessibility depends on a lot of quantitative and qualitative criteria. Researchers proposed review of criteria depending on domain of projects (Badri et al. 2001; Lee and Kim 2001; Wen et al. 2003; Sowlati et al. 2005; Mahmudi et al. 2008).
So, based on this literature review and in the context of interoperability projects, we propose an approach of effort estimation based on technical/complexity criteria which are valuated with symbolic modalities. If numerical data are available for statistical analysis, the proposed approach could be adapted to integrate these results.
The next section presents the proposed methodology to measure interoperability and to select the best appropriate project to solve interoperability problems.
3. Interoperability Project Selection Methodology
3.1. Overview and Assumptions
Our proposition is based on two main assumptions. First, all partners of the network are considered to have already implemented a PMS and consequently get their own PI able to measure their local performance. Second, decision-makers are able to define and model several options to support their interoperability needs. For instance, they could envisage and describe a solution associated to each existing level of interoperability (Clark and Jones 1999):
- Independent: these are organizations that would normally work without any interaction other than that provided by personal contact; - Collaborative: these are organizations where recognized frameworks
are in place to support interoperability and shared goals are recognized and roles and responsibilities are allocated as part of on-going responsibilities however the organizations are still distinct; - Combined or Integrated: these are organizations where there are
shared value systems and shared goals, a common understanding and a preparedness to interoperate;
- Unified: these are organizations in which the organizational goals, value systems, command structure/style, and knowledge bases are shared across the system.
Our proposition can be considered as an interoperability project selection step. Classically, the process of project selection uses project evaluation and selection techniques in a progression of three phases: strategic considerations, individual project evaluation, and project selection (Archer and Ghasemzadeh 1999). Thus, a three-step methodology is proposed to support decision-making in terms of selection of the best interoperability option (i.e. project) for a given network:
1. Modelling the collaborative processes and the different interoperability options (this is the Innovation part);
2. Evaluating the accessibility of each option (this is the Implementation part); 3. Simulating each option against several scenarios and assessing the expected
performance (this is the Observation part).
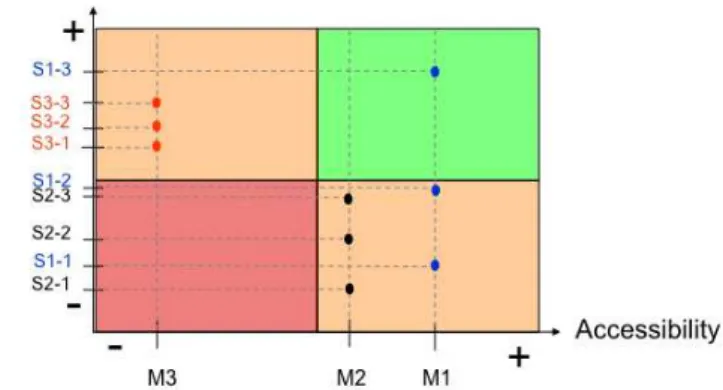
The final objective of this approach is to build a decision-making support matrix (see. Figure 1) able to show, for each scenario, the balance between:
- The accessibility of the option: this deals with all concerns in a project evaluation step. Is the project accessible for the networked organization? Is it compatible with financial capacities and available means in the organizations? Does the organization have the skills to lead the project for implementing such an interoperability option? - And the expected performance for the partners: What will be the
Fig. 1. Comparison matrix regarding expected performance and accessibility of scenarios.
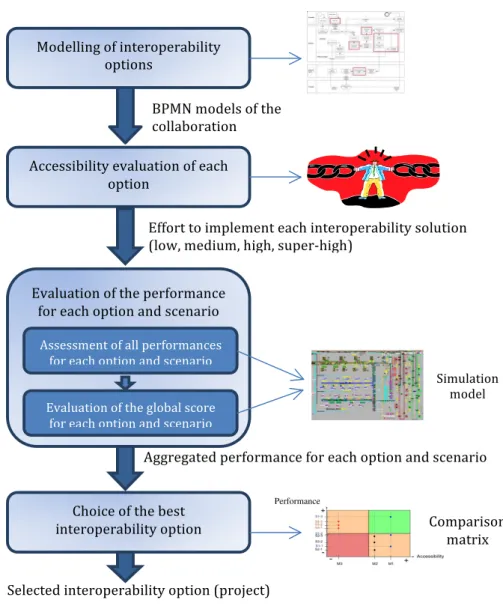
So, the proposed approach is presented in the figure 2 below: Expected
Fig. 2. Main steps of our proposed approach
3.1. Step 1: Modelling the Interoperability Options
The modelling of the interoperability options aims to represent the collaborative activities and interoperability nodes in the network. It allows understanding the complexity of the collaboration.
Even though different Business Process Modelling techniques could be envisaged, this is not the purpose of the present study to discuss such a choice. We have chosen to work with the Business Process Modelling Notation (BPMN) standard (White and Miers 2008). This standard pays particular attention to both the sequencing of
Modelling of interoperability options BPMN models of the collaboration Interoperability nodes Accessibility evaluation of each option Effort to implement each interoperability solution (low, medium, high, super‐high) Evaluation of the performance for each option and scenario Assessment of all performances for each option and scenario Evaluation of the global score for each option and scenario Choice of the best interoperability option Simulation model Aggregated performance for each option and scenario Performance Comparison matrix Selected interoperability option (project)
operations and the flows. It also gives the opportunity to study the interfaces, which facilitates the discussion of coordination and synchronization problems through a message flow between several separated processes stakeholders (business entities or business roles) who send and receive message (White and Miers 2008). This point is particularly crucial within an interoperability project. However, any other modelling language based on the description of activities and sequence flows may be investigated and used.
Moreover, BPMN is quite well defined by a strong meta-model proposed by OMG and so different kinds of software tools are proposed for free to support BPMN modelling.
Finally, another major interest of BPMN language for our research work is the fact that is relatively easy to simulate by classical tools of Discrete Event Simulation (native in the majority of simulation software) (see. Section 3.3).
3.2. Step 2: Evaluating the Accessibility of each Option
The goal of this step is to find out a measure at the project level for approximating in early stages the accessibility for the networked organization. The accessibility of a solution (an interoperability option) can be defined as a ratio between the needed efforts to develop this solution and the available means of the networked organization. In other words, it explains the capacity of the networked organization to conduce with success this change. In practice the accessibility dimension aims to assess efforts that each interoperability option (modelled in step 1) requires to be implemented in order to represent the different solutions on a common axis (from the least accessible solution to the most accessible one). In other words, for a specific networked organization, the more the project concerning the interoperability option is matched with the means of the organization, the more it is accessible (and vice-versa).
Based on the results of literature review in section 2.2, the following criteria are proposed to assess the accessibility of each scenario:
‐ Human resource requirement: Estimation of the effort to commit and the availability of the required skills;
‐ Budget requirement: Estimation of the total cost of the project (investment, human resources, etc.) compared with the means of the organization; ‐ Risk: Estimation of the negative risks the project has to cope with; ‐ Cultural gap: Estimation of the cultural change scale.
Because an interoperability project is very dependent of the IT solution that will be deployed, our methodology is definitively built on the research work of (Shenhar et al. 2002). In this research work, the authors distinguish the difficulty to operate such or such project by proposing to use the level of technological uncertainty at the moment of project initiation. This classification, which has been shown to be one of the major independent variables among projects, includes the following four levels and fit very well with the subject of interoperability projects:
‐ Low-Tech Projects rely on existing and well-established technologies. This level corresponds to a high level of accessibility, which is easy to implement for the organization;
‐ Medium-Tech Projects are mainly based on existing common technologies but (i) incorporate some new technology or feature or (ii) some of the planned technologies are not well controlled by the organization. This level corresponds to a moderate level of accessibility (reasonable to implement);
‐ High-Tech Projects are defined as projects in which most of the technologies employed are new for the organization, but knowledge exists in other companies. This level corresponds to a low level of accessibility (difficult to implement);
‐ Super High-Tech Projects are based primarily on new, not yet existent technologies, which must be developed during project execution. This level corresponds to a very low level of accessibility (very difficult to implement).
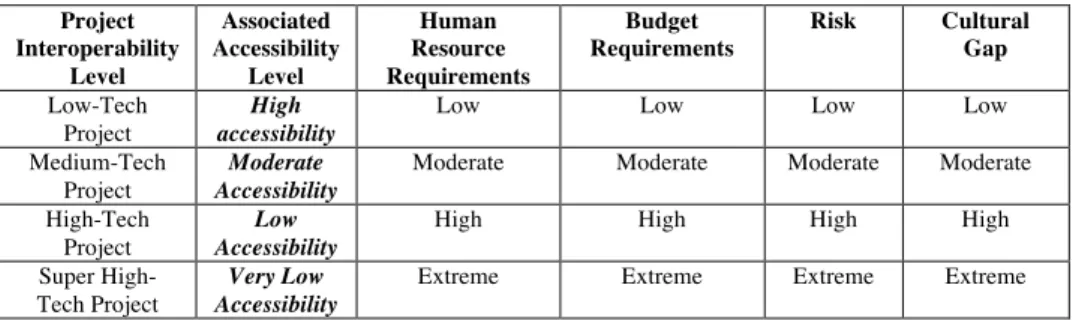
Our objective consists in assessing the studied interoperability projects by categorizing each option in one of the four previous levels. To reach this goal a quotation scale is defined that corresponds to the different levels of project. So, four levels of project accessibility are proposed: the Low level corresponds to the Low-Tech Project level; the Moderate level corresponds to the Medium-Low-Tech Project level; the High level corresponds to the High-Tech Project level; the Extreme level corresponds to the Super High-Tech Project level. This quotation is applied to each of the four criteria presented previously: Human Resources Requirements, Budget Requirements, Risk, and Cultural Gap. Considering the classical project risk management recommendations, one makes the assumption that the quotation of the whole project corresponds to the highest quotation of each criteria. For instance, if the quotation for a project is {Human resources requirements = Low; Budget Requirements = Moderate; Risk = Low; Cultural Gap = Low} then the global project assessment will be Medium-Tech Project (Average Accessibility).
The following table summarizes this assumption. Project Interoperability Level Associated Accessibility Level Human Resource Requirements Budget Requirements Risk Cultural Gap Low-Tech Project High accessibility
Low Low Low Low
Medium-Tech Project
Moderate Accessibility
Moderate Moderate Moderate Moderate High-Tech
Project
Low Accessibility
High High High High Super
High-Tech Project
Very Low Accessibility
Extreme Extreme Extreme Extreme
3.3. Step 3: Evaluating the Performance of each Option
3.3.1. Step 3.1: Assessing All Performances for an Option
The third step consists in assessing the intrinsic performance of each option. As discussed in section 2.1, this performance might be evaluated using a simulation approach. In our case, we propose to simulate the BPMN diagrams produced in step 1 by using classical Discrete Event Simulation technique and software such as Witness®
or Arena®. This principle seems to be relatively typical if we refer to the works developed by (Enstone and Clark 2006) and traditionally composed of two main components: (i) simulation modelling and (ii) events list.
Regarding to the first component, a set of simulation models that corresponds to the different options described in step 1 is proposed. Concretely, for each BPMN model established in step 1, a simulation model is defined. These simulation models must include the intrinsic parameters that describe the own characteristics of each option as for instance:
- activities’ runtime execution, - activities’ non-quality rate, - activities’ cost,
- transmission lead times
All these simulation models must be able to measure a priori the PI defined by decision-makers as representative of the interoperability impact of their collaborative processes. Then, for each PI, the operational performance of each interoperability solution (option) has to be monitored. It is important to underline that the PI must be common to all options and consequently to all simulation models for comparison purpose. These PI should be representative of the main interoperability stakes of the concerned project.
The second component of our approach consists in defining the common scenarios that has to be confronted to all interoperability solutions (options) in order to compare their relative performance. In fact, in discrete-event simulation, the operation of a system is represented as a chronological sequence of events. Each event occurs at a certain time and may induce a change of state in the system. These global schemes are thus called scenarios and include consequently a list of events that is the common inputs of all the simulation models. Some examples of events could be: customer orders (quantity, delivery time, etc.), demand or supply hazards, etc. These scenarios are simulated and the behaviour of each interoperability option against different situations is assessed.
To summarize, the third step of the proposed approach consists in:
1. Translating the BPMN models into a Discrete Event Simulation Models; 2. Defining a set of PI that are identical for all the options in order to be able
to compare them;
3. Defining a set of scenarios (events) that is representative of the common outlines we want to simulate to compare the options;
4. Running the simulations on Discrete Event Simulation software: 1 simulation = {1 option; 1 scenario}.
3.3.2. Step 3.2: Evaluation of the Global Score for a Scenario
At this stage, the simulation brings a raw series of values regarding to each set {scenario, PI, option}. In order to be able to compare the performance of each interoperability option (and thus, to select the best interoperability solution for the network), an aggregation of the PI measures obtained for a given simulation (i.e. {1 experiment; 1 scenario}) is needed. By definition, the set of PI allows to measure the achievement of all aspects of an interoperability project. Nevertheless the aim is to produce a single reduced evaluation of the performance of each simulation, to support interoperability solution selection decision-making. This objective refers to (Hansen and Riis 1999) who oppose two fundamentally different approaches: the aggregate approach and the composite (partial) approach.
The principle of performance aggregation is to highlight the global performance based on detailed performance described using eventually several performance criteria. Most of the multi-criteria aggregation methods are using weighted average method as AHP, ELECTRE (ELimination Et Choix Traduisant la REalité), PROMETHEE (Preference Ranking Organisation Method for Enrichment Evaluations), MAUT (Multi-Attribute Utility Theory), but these methods are not very adapted to interoperability performance measurement because the weight is very subjective to the decision maker feeling which requires a lot of return on experience. In the domain of interoperability, this return on experience is not easy to obtain in particular when the collaboration is recent. Other researchers are developing new methods as Choquet Integral used in MACBETH (Measuring Attractiveness by a Categorical Based Evaluation TecHnique) method, which is based on the qualitative preferences of the decision maker that is considered as more intuitive than the quantitative preference. However this method is not yet established and its robustness is not guaranteed.
The composite approach consists in reducing the performance assessment to one or a limited number of PI that can be considered as representative of the whole performance of the system. From decision-makers point of view, this approach has the great advantage to produce measures easily interpretable. A method developed specifically for the performance composition approach is CPMM (Causal Performance Measurement Model). CPMM is used to outline the specific path that a company will follow to achieve its strategy (Niven 2002). To be deployed appropriately, a CPMM could be represented using either quantitative or qualitative techniques. A company can numerically estimate the strength of the relationships in its CPMM through a statistical analysis (Epstein and Westbrook 2001; Kaplan and Norton 2001). Qualitative reasoning consists in developing programs that enable operations under a condition of insufficient numerical data or in the absence of such data (Hamschera et al. 1995). This last situation corresponds exactly to our case. To create the CPMM, the cause-and-effect relationships in each pair of variables should be determinate: positive proportionality (P+), a negative proportionality (P-) or no relationship between the variables. Instantiating the qualitative model generates a
qualitative prediction, in the form of intervals, for each endogenous variable, without specifying a precise numerical value (Hinkkanen et al. 2003). The qualitative value of a variable at a given state is described as its qualitative magnitude and the sign of its derivative. The sign of the derivative of a variable specifies the direction of change, which can be increasing, steady or decreasing.
Finally, the CPMM model allows aggregating the most representative PI in a single PI on which the comparison study could be based on. Then the value of this PI for each simulation {1 Option; 1 Scenario} will constitute the global score to compare between the scenarios.
3.4. Choosing the best Interoperability Option
This last step synthesizes all the previous results in a matrix aiming at supporting the decision-making (see. Figure 1). The Y-axis represents the aggregated value of the interoperability option performance (through the representative PI identified with the CPMM model) while the X-axis represents the value of the interoperability project accessibility (from the less accessible to the most accessible). Then a scatter plots will appear for a given option because:
- There is one accessibility score for one option;
- There are several scores in terms of interoperability performance for a given option related to the different scenarios.
Finally, the decision-making is supported in analyzing the position of the scatter plots. Those that will be in a lower left corner would probably be the worst whereas those that will be in upper right corner would probably the best.
4. Application Case
The case study involves an enterprise producing moulds and is extracted from the French ISTA-3 research project. It considers a subcontractor (SUB1) in the aeronautical industry receiving files containing Computer Assisted Design (CAD) models for moulds from a main customer (MPN). Then SUB1 works with a second subcontractor (SUB2) in charge of designing tools and moulds for SUB1.
The study is leaded considering SUB1 point of view. The PMS represents all of the indicators used to evaluate the impact of solutions. This PMS contains indicators grouped into three components: the operational, tactical and strategic PIs:
‐ Strategic level (dependent variables) • Profitability per contract ‐ Tactical level (intermediate variables)
• Cost of mould production • Cost of file processing
‐ Operational level (independent variables)
• Number processed files (number of iterations) • Number of defaults by file
• Number of defaults by produced item because of the tool (i.e. the tool used for supporting the interoperability dedicated activities)
• Global lead time with defaults
These PI assess solely the performance of the interoperability dedicated activities. The supply chain part of the activities (such as planning, manufacturing and even design...) is not taken into account.
In the scenario retained in our case study to realize the simulation, the following assumptions were made by the team:
‐ The variables Number processed files (number of iterations) and Number of moulds (number of iterations) are supposed to have a positive proportionality.
‐ The variables Number of defaults by file, Number of defaults by product because of the tool and Global lead-time with defaults have a negative proportionality.
These proportionalities for the independent variables represent hypotheses about the direct impact of the proposed solution. The validation or rejection of the solution will be based on the conformity between prior estimated variations and the expectations. In our application, a decrease is predicted by the model for tactical measures Cost of mould production and Cost of file processing as expected through using a more performing interoperability solution. At the strategic level also, the increase of the variable Profitability per contract is expected. The proposed solution could be validated based on these results.
4.1. Discrete event simulation results
The discrete event simulation is based on a Witness® model close to the BPMN model firstly developed in order to assess the collaboration (as the result of the first phase of our methodology) between MPN, SUB1 and SUB2 and depicted by Figure 3. The PIs are obviously the same as defined in section 4.1.
The studied process concerning these three companies is composed of three main steps depicted in Figure 3:
‐ Step 1: Feasibility: a file is received by SUB1 and then a first loop is engaged with SUB2 in order to evaluate the feasibility of the mould; ‐ Step 2: Estimation/Ordering: if feasible, an estimate is sent to SUB1 by
SUB2 and if SUB1 agrees it leads to an order for realizing the mould sent by SUB1 to SUB2;
‐ Step 3: Validation: starts the concrete building of the mould by SUB2. Then, the mould is received by SUB1 and tested with few prototypes parts. In the meanwhile an invoice is sent by SUB 2 to SUB1.
At each step, disruptions can exists leading to a comeback to the step n-1 or to a complete give-up of initial order from MPN.
Fig. 3. Capture of Witness® Simulation Model
SUB1 has to deal with three kinds of CAD files given by MPN:
1. Simple files: concern small or simple moulds. These simple files are easily handled by both SUB1 and SUB2,
2. Standard files: concern more complex moulds and represents the most important part of the files received by SUB1,
3. Complex files: concern complex moulds leading to the highest level of disruptions in the process and the highest give-up of the initial order. The simulations are developed according to three interoperability options graded from Low to High in terms of accessibility (see section 3.2):
‐ Option 1 is the most accessible scenario (graded High) in which the improvement of SUB1 interoperability dedicated activities is done through the use of an estimate management system;
‐ Option 2 (graded Medium) is an extension of option 1 to the improvement of SUB2 interoperability dedicated activities in the management of the feasibility study (SUB2 gains access to the estimate management system of SUB1).
‐ Option 3 (graded Low) is an improvement of information transfer through the use of a collaborative platform such as Mediation Information System: this simulates an improvement of interactions for each company.
Each option is evaluated regarding three scenarios distinguished by the percentage of each king of orders SUB1 and SUB2 have to deal with:
‐ Scenario 1: simple orders represent 35% of the projects, standard orders: 55% and complex orders: 10%,
‐ Scenario 2: simple orders represent 10% of the projects, standard orders: 35% and complex orders: 55%,
‐ Scenario 3: simple orders represent 55% of the projects, standard orders: 35% and complex orders: 10%.
These three scenarios are simulated in order to assess the robustness of the interoperability scenario against a change in the activity of the company. This leads to 9 simulations.
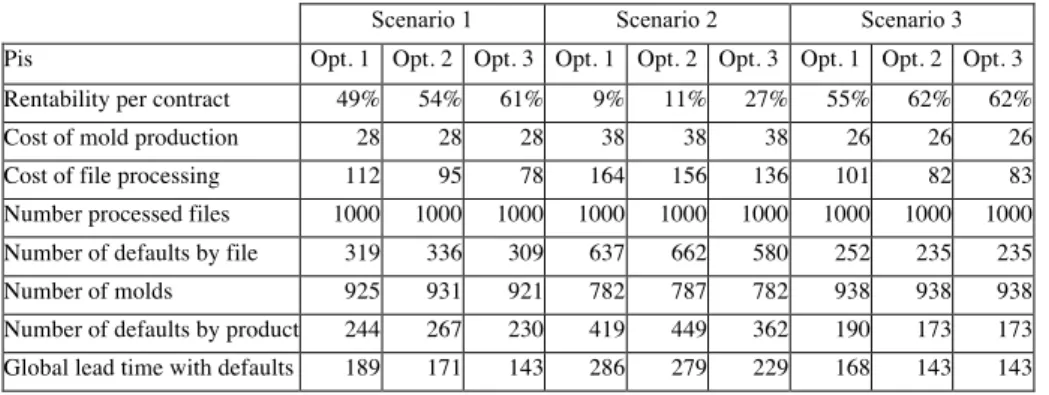
The results of the simulation are given in Table 2:
Scenario 1 Scenario 2 Scenario 3 Pis Opt. 1 Opt. 2 Opt. 3 Opt. 1 Opt. 2 Opt. 3 Opt. 1 Opt. 2 Opt. 3 Rentability per contract 49% 54% 61% 9% 11% 27% 55% 62% 62% Cost of mold production 28 28 28 38 38 38 26 26 26 Cost of file processing 112 95 78 164 156 136 101 82 83 Number processed files 1000 1000 1000 1000 1000 1000 1000 1000 1000 Number of defaults by file 319 336 309 637 662 580 252 235 235 Number of molds 925 931 921 782 787 782 938 938 938 Number of defaults by product 244 267 230 419 449 362 190 173 173 Global lead time with defaults 189 171 143 286 279 229 168 143 143
Tab. 2. Results given by simulation
It can be outlined, from Table 3, that the qualitative simulation corresponds to the results given by the discrete event simulation. As the level of interoperability increase for scenario 1 to 3, the IPs behave as predicted by the qualitative model. It can be noticed that in the case of scenario 3, moving from option 2 to 3 does not involve an important improvement of the IPs. Indeed, the scenario 3 is based on the less complicated orders. It can be guessed from these simulations that managing these simple orders does not require a high level of interoperability.
Figure 4 shows the results in terms of a priori aggregated performance. This aggregated performance is calculated as the average of the profitability per contract indicator.
Fig. 4. Comparison matrix regarding expected performance for the application case
In this application case, if the managers consider that scenario 1 or 3 are more likely to happen in a midterm basis, they should apply the interoperable solution given by the option 2. This option can be a good compromise between improvement of the performance and the accessibility of such a scenario
Otherwise, in the case that scenario 3 is more likely to happen, they should try to invest in the project recommended by option 3. In such a case, even if the performance considering scenario 2 is in the red part of the comparison matrix, there is a great improvement in both the average aggregated performance and the scenario 2 performance.
These results are obtained from the real case studied in the ISTA3 French Project. They are sufficient to show that a discrete event simulation can help managers to assess their potential performance.
5. Conclusion and Future Works
This paper presents a method to select in a given context the most appropriate interoperability solution. In order to do so, the first step is the modelling of the collaborative scenarios in order to understand the existing collaboration, if any, and to have a diagnosis on the points to improve. Based on the expected collaboration scenarios, performances of each scenario are assessed through a discrete event simulation approach and an aggregated performance is calculated using a CPMM qualitative model.
In parallel, the accessibility of each scenario is evaluated based on four criteria: human resource, budget, risk and cultural gap.
Finally, the comparison is done for several scenarios in a synthetic decision-support matrix in order to select the best solution.
In order to demonstrate the benefits and the applicability of the proposed methodology, a case study was proposed in the last part of the paper related to a real case study.
The main perspective of this work is to develop first a quantitative CPMM model. The difficulty is not high but the number of required data is huge and this is why this kind of quantification is difficult in the domain of interoperability.
The second perspective is to develop a quantitative model to evaluate the accessibility, based on the weighting of the various criteria and aggregation methods.
6. References
Akyuz, G.A., Erkan, T.E., (2010) Supply chain performance measurement: a literature review. International Journal of Production Research, 48(17), 5137-5155.
Alfaro J.J., Rodriguez-Rodriguez, R., Verdecho, M.J., Ortiz, A. (2009) Business process interoperability and collaborative performance measurement. International Journal of Computer Integrated Manufacturing. 22(9), 877-889. Archer, N.P. and Ghasemzadeh, F. (1999) An integrated framework for project portfolio selection, International Journal of Project Management, 17(4), 207-216. Baccarini, D. (1996) The concept of project complexity - a review, International Journal of Project Management, 14(4), 201-204.
Badri, M. A., Davis, D., & Davis, D. (2001) A comprehensive 0–1 goal programming model for project selection. International Journal of Project Management, 19, 243–252.
Beamon, B.M.(1999) Measuring Supply Chain Performance. International Journal of Operations and Production Management, 19(3), 275-292.
Bititci U.S., Carrie A.S., Mcdevitt L. (1997) Integrated Performance Measurement System: a development guide, International Journal of Operations & Production Management, 17(5-6), 522-534.
Blanc, S. (2006) Contribution à la caractérisation et l'évaluation de l'interopérabilité pour les entreprises collaboratives, Thèse de doctorat de l’université Bordeaux 1, Décembre 2006.
Boehm, B., Clark, B., Horowitz, E. and Westlan, C., (1995) Cost models for future software life cycle processes: COCOMO 2.0, Annals of software engineering, 57-94.
Chen, C., Dassisti, M., Elvesaeter, B.(2006) Interoperability Knowledge Corpus, Deliverable DI.1b, Workpackage DI, INTEROP NoE, available at http://interop-vlab.eu/backoffice/ei_public_deliverables/.
Chen, D., Daclin, N. (2007) Barrier driven methodology for enterprise interoperability, PROVE2007, In Proc. Establishing The foundation of Collaborative Networks, Guimarães, 10-12 Oct. 2007, 453-460.
Chen, D., Doumeingts, G., and F. Vernadat, (2008) Architectures for enterprise
integration and interoperability:Past, present and future, Computers in Industry
Clark, T., Jones, R.: (1999) Organisational Interoperability Maturity Model for C2, In Proceedings of the Command And Control Research And Technology Symposium, USA, 1999
Ducq Y., Vallespir B. (2005) Definition and aggregation of a Performance Measurement System in three Aeronautical workshops using the ECOGRAI Method, International Journal of Production Planning and Control, 16(2), 163-177.
Enstone, L.J., & Clark, M.F.(2006) BPMN and Simulation, Lanner Group Ed. Epstein, M. J., &. Westbrook, R. A (2001) Linking actions to profits in strategic decision making, MIT Sloan Management Review, 42(3), (2001), 39-49.
Geraldi, J., Adlbrecht, G. (2007) On faith, fact, and interaction in projects. Project Management Journal, 38(1), 87-98.
Ghalayini A.M., Noble J.S., Crowe T.J. (1997) An integrated dynamic performance measurement system for improving manufacturing competitiveness, International Journal of Production Economics, 48(3), 207-225.
Gunasekaran, A., Kobu, B. (2007) Performance measures and metrics in logistics and supply chain management: a review of recent literature (1995 – 2004) for research and applications. International Journal of Production Research, 45(12), 2819-2840.
Hamschera, W., Kiangb, M. Y., & Langc, R. (1995) Qualitative reasoning in
business, finance, and economics: Introduction, Decision Support Systems, 15(2), 99-103.
Hansen, T.A. and Riis, J.O., (1999) Exploratory performance assessment, International Journal of Business Performance Management, 1(2), 113-133.
Hinkkanen, A., K.R. Lang, & Whinston, A.B. (2003) A Set-Theoretic Foundation of Qualitative Reasoning and its Application to the Modeling of Economics and Business Management Problems. Information Systems Frontiers, 5(4), 379-399.
INTEROP (2006), Enterprise Interoperability-Framework and knowledge corpus - Advanced report, INTEROP NoE, FP6 – Network of Excellence – Contract n° 508011, Deliverable DI.2, December 15th 2006.
Jochem, R. (2010) Enterprise Interoperability Assessment, in 8th International
Conference of Modeling and Simulation MOSIM'10. Conference, Hammamet Kaplan R.S. & Norton D.P. (1996) The Balanced Scorecard – Harvard Business School Press.
Kaplan R.S. & Norton D.P. (2001) The strategy-focused organization, Harvard Business Press.
Lee, J. W., & Kim, S. H. (2001) An integrated approach for interdependent information system project selection. International Journal of Project Management, 19, 111–118.
Mahmudi, J., Nalchigar, S., & Ebrahimi, S. B. (2008) Selecting the most efficient information system project using data envelopment analysis: Case Study of Iran Ministry of Commerce. In Proceeding of 2008 international joint conference on e- Commerce, e-Administration, e-Society, and e-Education, March 2008
Martin, N.L, Pearson, J.M., and Furumo, K.A., (2005) IS Project Management: Size, Complexity, Practices and the Project Management Office, System Sciences, HICCS'05, Proceedings of the 38th annual Hawaï International Conference on03-06 Jan. 2005
Neely, A., Adams, C. & Kennerley, M.(2002) The performance prism:The scorecard
for measuring and managing business success, Financial Times Prentice Hall. Niven, P.R. (2002) Balanced scorecard step by step, John Wiley & Sons.
Panetto, H., & Molina, A. (2008) Enterprise integration and interoperability in manufacturing systems: Trends and issues. Computers in Industry. 59(7), 641-646.
PMI,(2008) A guide to the project management body of knowledge, fourth ed., Project Management Institute.
Ravelomanantsoa, M. (2009) Contribution à la définition d’un cadre générique pour la définition, l’implantation et l’exploitation de la performance : Application à la méthode ECOGRAI. PhD Thesis, University Bordeaux 1, Dec 17th 2009
Shenhar, A.J., Dvir, D., Levy, O. & Maltz, A.C., (2002) Project success: A multidimensional strategic concept, Long Range Planning Journal, 34, 699-725.
Sowlati, T., Paradi, J. C., & Suld, C. (2005) Information systems project prioritization using data envelopment analysis. Mathematical and Computer Modeling, 41, 1279-1298.
Supply Chain Council (2010) Model SCOR. version 10.0.
Value Chain Group (2012) Value Reference Model, 2012: www.value-chain.org Vidal, L.A., Marle, F., & Bocquet, J.C. (2011) Measuring project complexity using the Analytic Hierarchy Process, International Journal of Project Management, 29(6), 718-727.
Wen, H. J., Lim, B., & Huang, H. L. (2003) Measuring e-commerce efficiency: A data envelopment analysis (DEA) approach. Industrial Management and Data Systems, 103(9), 703–710.
White S.A., & Miers D. (2008), BPMN modeling and reference guide: understanding and using BPMN. Future Strategies Inc., USA.