HAL Id: hal-01460389
https://hal.archives-ouvertes.fr/hal-01460389
Submitted on 8 Feb 2021
HAL is a multi-disciplinary open access
archive for the deposit and dissemination of
sci-entific research documents, whether they are
pub-lished or not. The documents may come from
teaching and research institutions in France or
abroad, or from public or private research centers.
L’archive ouverte pluridisciplinaire HAL, est
destinée au dépôt et à la diffusion de documents
scientifiques de niveau recherche, publiés ou non,
émanant des établissements d’enseignement et de
recherche français ou étrangers, des laboratoires
publics ou privés.
Millennial-scale dynamics of the East Asian winter
monsoon during the last 200,000 years
T Garidel-Thoron, L Beaufort, Bk Linsley, S Dannenmann
To cite this version:
T Garidel-Thoron, L Beaufort, Bk Linsley, S Dannenmann. Millennial-scale dynamics of the East
Asian winter monsoon during the last 200,000 years. Paleoceanography, American Geophysical Union,
2001, 16 (5), pp.491-502. �10.1029/2000PA000557�. �hal-01460389�
PALEOCEANOGRAPHY, VOL. 16, NO. 5, PAGES 491 - 502, OCTOBER 2001
Millennial-scale dynamics of the East Asian winter monsoon during
the last 200,000 years
Thibault de Garidel-Thoron and Luc Beaufort
Centre Europben de Recherche et d'Enseignement en Gbosciences de l'Environnement (CEREGE), Aix-en-Provence, France
Braddock K. Linsley and Stefanie Dannenmann
Department of Earth and Atmospheric Sciences, University at Albany, State University of New York, Albany, New York, USA
Abstract. The primary productivity dynamics of the last 200,000 years in the Sulu Sea was reconstructed
using the
abundance
of the coccolithophore
Florisphaera profunda in the IMAGES MD97-2141 core. We find that primary
productivity
was enhanced
during glacial periods,
which we suggest
is due to a stronger
East Asian winter monsoon.
During
the last 80 kyr, eight significant increases
in primary productivity (PP) in the Sulu Sea are similar to East Asian winter
monsoon changes
recorded in Chinese loess. The PP maxima are not linked with Heinrich events (HE) in the North
Atlantic, although four PP peaks are synchronous
with HE. The PP oscillations
have frequencies
near those of the
Dansgaard-Oeschger
cycles in Northern Hemisphere
ice records and indicate a teleconnection
of the East Asian winter
monsoon
with Greenland
climate. In this Sulu Sea record the East Asian winter monsoon
oscillates
with periodicities
of •6,
4.2-3.4, 2.3, and 1.5 kyr. In particular,
the 1.5 kyr cycle exhibits
a strong
and pervasive
signal from stage
6 to the Holocene
without any ice volume modulation.
This stationarity
suggests
that the 1.5 kyr cycle is not driven by some high-latitude
forcing.
1. Introduction
The coupling between the atmosphere and the ocean is funda- mental to climate dynamics over seasonal to millennial time- scales. Variations in this coupling influence the oceanic biosphere and particularly the phytoplankton of the upper ocean layer. In low-latitude areas the phytoplanktonic activity quantified by primary productivity (PP) is correlated to the wind stress dynam- ics on the sea surface [Nair et al., 1989]. Previous studies have concentrated on long-term changes in the PP [e.g., Beaufort et al., 1997; Mix, 1989], but little is known about the millennial-scale dynamics of PP.
At present, we know that during the last glacial stage our climate system went through rapid changes that are well docu- mented in the North Atlantic area. Two major types of abrupt changes have been described. Heinrich events are documented massive iceberg discharges of ice-rafted debris to the North Atlantic deep-sea sediments occurring with a periodicity of •6-7 kyr [Bond et al., 1992; Heinrich, 1988]. These events are followed by consecutive abrupt warmings on the Greenland continent. Dansgaard-Oeschger (D-O) climatic oscillations with periods of 1000-3000 years have been described in the Green- land ice cores records [Dansgaard et al., 1993]. These oscilla- tions correspond to •15øC air temperature shifts between a stadial (cold phase) and an interstadial (warm phase) [douzel, 1999].
The Heinrich events are correlative with major changes in the climate dynamics recorded worldwide, from the North Atlantic to the Antarctic. In the Asian region the East Asian winter monsoon strengthened during Heinrich events [Porter and Zhisheng, 1995; Xiao et al., 1999]. Planktonic foraminifera assemblages in South China Sea recorded these abrupt changes [Chen and Huang, 1998; Wang et al., 1999]. In the Sulu Sea the oxygen isotopes
(6280)
of planktonic
foraminifera
show
important
rapid
oscilla-
Copyright 2001 by the American Geophysical Union.Paper number 2000PA000557. 0883-8305/01/2000PA000557512.00
tions which appear synchronous with some Heinrich events [Linsley, 1996].
For the Dansgaard-Oeschger oscillations recorded in ice cores, similar changes are documented in sea surface temper- ature (SST) reconstructions, percentage of carbonate, magnetic susceptibility, planktonic foraminifera oxygen isotopic composi- tion, and foraminiferal assemblage records from the North Atlantic Ocean (for a review, see Corto'o et al. [2000]). The loess-paleosol record in China exhibits comparable shifts [Chen et al., 1997]. In the Santa Barbara basin a bioturbation index records nearly all stadials and interstadials described in the Greenland record [Behl and Kennet, 1996]. At low latitudes, organic carbon changes in the Arabian Sea appear to correlate with D-O cycles [Schulz et al., 1998].
To constrain the past millennial variations of low-latitude pale- oproductivity, we investigate, at high-resolution, variations in the coccolith assemblages in IMAGES giant piston core MD97-2141 located in the Sulu Sea (Figure 1).
The Sulu Sea is located between the Asian continent and the "Western Pacific Warm Pool" (WPWP), where annual SST is
above 29øC [Yah et al., 1992]. The climate of the Sulu Sea is
strongly influenced by the East Asian monsoon. The East Asian monsoon results from the different potential heating between the WPWP and the Asian continent. During the boreal winter the main heating source is located in the ocean. The latent heat release associated with intense convective precipita- tion fuels the meridional circulation. Tropical convection in the western equatorial Pacific is connected to the descending branch over the Siberian region, forming a strong local Hadley cell in the East Asian region [Zhang et al., 1997]. The East Asian winter monsoon winds in the Sulu Sea result from the merging of the northerly East Asian monsoon with the Pacific trade winds over the South China Sea [McGregor and Nieuwolt, 1998]. East Asian winter monsoon bursts during January to March (Figure 2) can induce blooms of coccolitho- phorids [Wiesner et al., 1996]. The PP rises correlatively to the wind stress strengthening because of the stronger mixing of the upper ocean (Figure 2) [Nair et al., 1989]. Thus coccolith
ASIA
••..
• Philippines
Sea
}'
.• '•--, MD972141
•,•-' .•
••%
•/•x• OdP
769
0
'•
Sulu.Sea 4; ?
c2•
/• c•
, Pcific
Ocean
,• •
• Celebes
Sea
2O N10N[• ,
O- 10S I I I 90 E 100 E 110 E 120 E 130 EFigure 1. Map of Southeast Asia and of the marginal seas of the western Pacific. Note location of core MD97-2141
in the Sulu Sea.
assemblages record information on both paleoproductivity
changes and also on East Asian winter monsoon variations in
the Sulu Sea.
2. Material
The 36 rn giant piston core IMAGES MD97-2141 (08ø47'N,
121ø17'E,
3633 m depth)
was
retrieved
during
the IPHIS-IMAGES
III cruise of the R/V Marion Dufresne in May 1997. This position is located in the vicinity of the Ocean Drilling Program (ODP) Site 769 [Linstey, 1996]. The core is located on the Cagayan ridge, which protects the site from downslope processes, and above the present lysocline depth (•3800 m), allowing for good preservation of carbonates [Linstey et at., 1985; Miao et at., 1994]. The sediments are composed predominantly of well-preserved nanno-
fossil-foraminifera oozes.
3. Methods
For coccolith counting, the core was sampled every 2 cm in the upper 6 m of the core, allowing for a resolution of •70 years,
and every 3-4 cm in the lower 30 m for a resolution of •200- 500 years. A smear slide was prepared for each sample, and at
least 300 coccoliths were counted for each slide (mean of 357
coccoliths) on a Zeiss Axioscop at a 1000x resolution. Percen-
tages of Ftorisphaera profunda (Fp) were computed using the
following equation:
%Fp = 100(numberFp)/(totalcoccoliths)
The 95% confidence interval for %Fp varies between +2 and
+6% depending on the percentage of Fp [Patterson and Fishbein, 1989].
3.1. Age Model
The age model of the core MD97-2141 was developed by
Dannenmann et at. [1998] and Oppo et at. [1998]. It was obtained
using
28 accelerator
mass
spectrometer
(AMS) 14C ages
on
Globigerinoides ruber and G. sacculifer and by comparison of
the planktonic
foraminifera
15180
curve
(on Gtobigerinoides
tuber
and G. saccutifer tests) with the SPECMAP stack [Imbrie et at.,
1984] (Table 1). The radiocarbon dates were converted to calendar
ages using (1) a correction of 400 years, according to the age reservoir of carbon in the ocean [Bard, 1988], and then (2) the CALIB3 calibration software [Stuiver and Reimer, 1993] to take into account past atmospheric changes in cosmogenic production. All the ages discussed here are calendar ages B.P. The carbon
reservoir age in this work is assumed to be invariant with time. We
also assumed that the carbon reservoir age changes in the tropical upper oceanic layer where G. tuber and G. saccutifer live are not varying more than •200 years [Duptessy et at., 1991]. The last
appearance datum of G. tuber pink at 1593 cm fits with the
Termination II [Thompson et at., 1979], strengthening the validity of the age model (Figure 3). Two ninth-order polynomial regres-
sions were used from the core top to 400 cm and from 440 to 920
cm on the 14C
ages
and SPECMAP
tie points
to smooth
the
sedimentation rate for the last 60 kyr. This smoothing is indispen- sable for the spectral analyses to avoid spurious peaks linked with
DE GARIDEL-THORON ET AL.' DYNAMICS OF THE EAST ASIAN WINTER MONSOON 493 summer winter monsoon monsoon 18 7
• 14
6
.0 12
5.5'
••_
10
5
:LY'
_
_
. p.p.
(gC.m_2.m.1,
•/'• 4.5
t ---
wind
speed
(m.s
-1)
6 , •,•,•,•,•,•,1,•,•,•,•, i,• 4may jul sep nov jan mar may
month
Figure 2. Wind strength in Sulu Sea at 10øN (Comprehensive
Ocean-Atmosphere Data Set (COADS) Atlas) and estimated monthly primary production at the same location from Antoine and Morel [ 1996].
The average
sedimentation
rate is •10.5 cm kyr
-•, with
maxima
during
glacial
stage
2 of 34 cm kyr
-•. For example,
the sedimentation
rate
during
the stage
3 is •30 cm kyr
-•, which
allows a 70 year resolution (2 cm sampling). A hiatus occurs between 30 and 22 ka (Figure 3). The sedimentation rates are coherent with other records; that is, they are increased during glacial periods and lower during interglacial stages [e.g., Chen and Huang, 1998]. Reduced benthic mixing due to dysaerobic conditions in the Sulu Sea lessens the bioturbation smoothing effect [Kuehl et al., 1993]. The sharp transition in the coccolith record at 14.55 ka, occurs within 2 cm, another argument for a weak bioturbation effect.3.2. Signal analysis
3.2.1. Spectral analysis. To extract the significant perio- dicities contained in the PP signal, we performed spectral analysis using different algorithms (Blackman-Tukey, maximum entropy, and multitaper methods) provided in the package Analysedes [Paillard et al., 1996]. The comparison of these different methods allows the discrimination of spurious results due to biases of a particular method. We present only the multitaper method (MTM) results here. The MTM is able to detect low-amplitude oscillations in relatively short time series with a high degree of statistical significance [Thomson, 1982]. The statistical significance reported in this work is computed using a Fisher test (F test). This F test is performed on the amplitude to analyze the harmonic oscillations assuming that the signal contains periodic and separated components [Iqou et aL, 1997].
3.2.2. Singular-spectrum analysis. Singular-spectrum analysis (SSA) is designed to extract the information contained in a short, nonstationary, and noisy signal [Vautard and Ghil, 1989]. This method is based on the computing of empirical orthogonal functions in the time domain. SSA can give insight into the dynamics of the underlying system that generates the signal. Using data-adaptive filters which are not period dependant, SSA allows the separation of the noise from the trend and the deterministic oscillations of the signal.
3.3. FIorisphaera profunda: A Paleoproductivity Marker The coccolithophoddae (Prymnesiophycaea) are phytoplank- tonic organisms that live in the oceanic photic zone. They are very sensitive to variations in light and nutrient availability, which are both depth dependent. The lower photic zone is darker and richer in nutrients than the upper photic zone. In the tropical ocean the lower photic zone coccolithophoridae community is dominated by Florisphaera profunda associated with Gladioli- thus fiabellatus and Algirosphaera robusta, while most of the other species live in the upper photic zone [Okada and Honjo, 1973].
When the nutricline is shallow, the upper photic zone species dominate the coccolith community, whereas when the nutricline is deeper, the relative proportion of lower photic community is more important. The depth of the nutdcline in the low-latitude open ocean is mainly driven by wind intensity. When winds are strong, the upper layers are well mixed, and the nutrients are upwelled into the upper photic zone. Inversely, when wind stress decreases, the mixing is less effective, and the photic zone is depleted in nutrients. This depth relationship between coccolithophorid com- munities was successfully used by Molfino and Mcintyre [1990] to monitor changes in the nutricline depth and has been calibrated to primary productivity by Beaufort et al. [1997] for paleopro- ductivity reconstructions.
The relationship between the Florisphaera profunda ratio and primary production has already been quantified by Beaufort et al. [1997] with the following equation:
y: 617 -[2791og(x + 3)],
where
y is the yearly
PP (g C m -2 yr -•) and
x is the percent
Fp.
This equation is based on Indian Ocean low-latitude core tops. We assume that the coccolithophodds' assemblage distributions are homogenous in the intertropical zone. The variations of Fp are in agreement with other paleoproductivity proxies [Beaufort et al.,1997].
4. Results
The present
annual
PP in the Sulu
Sea
is 148 g C m -2 yr -•
[Antoine and Morel, 1996], which is close to the average recon-2 1
structed PP over the last 200 kyr of 135 g C m- yr- . The PP (data are accessible at http://www. cerege.fr and at ftp:// ftp.noaa.ngdc.gov/paleo) oscillates during the last 200 kyr between
2 1
81 and 223 g C m- yr- (Figure 3).
4.1. Glacial-Interglacial Variations
On a glacial-interglacial timescale, PP increases during glacial periods and decreases during interglacials (Figure 3). PP is mod-
erately
correlated
(r 2 = 0.49) with the ice volume
curve
(SPEC-
MAP stack of Imbrie et al. [1984]). This is shown by the spectral analysis of the paleoproductivity record, which contains orbital frequency peaks of Milankovitch theory (i.e., 1/100 kyr, 1/41 kyr, and •1/20 kyr) (Figure 4) and confirmed by cross-spectral analysis between the PP and the SPECMAP stack (not shown). This orbital forcing explains about half of the variance of the PP record. Half ofTable 1. Radiocarbon Ages and Tie Points From the SPECMAP Stack Used in MD97-2141 Chronology a
Depth in Core, cm AMS •4C Age Error b Calendar Age, years Species/Age Model Accession Number
1 4,560 +50 4,798 G. tuber (white) OS- 16971
10.5 4,210 +40 4,286 G. tuber (white) OS- 16926
14 4,740 +40 4,962 G. tuber (white) OS- 16410
29 4,700 +55 4,873 G. tuber (white) OS-16972
59 6,020 +40 6,416 G. sacculifer (w/out sac) OS-16411
73 6,810 +55 7,274 G. sacculifer (w/out sac) OS- 16973
85 6,830 +90 7,295 G. sacculifer (w/out sac) OS- 18401
94 8,850 +55 9,455 G. sacculifer (w/out sac) OS-16974
99 10,700 +90 12,152 G. sacculifer (w/out sac) OS- 16975
120 93,80 + 160 10,001 G. sacculifer (w/out sac) OS- 16977
150 10,200 +80 11,045 G. tuber (white) OS- 16978
158 10,250 +120 11,153 G. sacculifer (w/out sac) OS-16980
162 10,750 +50 12,228 G. sacculifer (w/out sac) OS-16979
205.5 11,750 +130 13,258 G. sacculifer (w/out sac) OS-17238
212 12,350 +65 13,931 G. tuber (white) OS-16412
226.5 13,000 +95 14,796 G. tuber (white) OS-16970
244 14,100 +70 16,422 G. tuber (white) OS- 16413
269 14,750 +70 17,200 G. tuber (white) OS-16361
282 15,100 +90 17,591 G. sacculifer (w/out sac) OS-17913
339 17,150 +140 19,749 G. tuber (white) OS-17914
368 17,650 +85 20,430 c G. tuber (white) OS-22672
400 18,850 +140 21,847 c G. sacculifer (w/out sac) OS-17916 440 28,000 +130 32,101 c G. sacculifer (w/out sac) OS-17882
487 30,900 +260 35,146 c G. tuber (white) OS- 17912
506.5 33,000 +310 37,290 c G. sacculifer (w/out sac) OS-17917 543 33,600 +590 37,893 c G. sacculifer (w/out sac) OS-17911 553 34,300 +390 38,790 c G. sacculifer (w/out sac) OS- 17915 594 36,900 +460 41,134 c G. sacculifer (w/out sac) OS-17918
920 59,000 SPECMAP 1150 71,000 SPECMAP 1190 80,000 SPECMAP 1400 99,000 SPECMAP 1450 109,000 SPECMAP 1540 115,000 SPECMAP 1650 131,000 SPECMAP 1790 146,000 SPECMAP 1860 151,000 SPECMAP 2000 171,000 SPECMAP 2200 182,000 SPECMAP
aSee Dannenmann et al. [1998] and Oppo et al. [1998].
b
Error
is given
in 1
c Calendar ages have been calculated using a 400 year reservoir correction and applying the Stuiver and Braziunas [ 1993] calibration curve for samples younger than 20,000 calendar year in age and a U/Th calibration curve for the samples older than 20,000 calendar years [Bard et al., 1993].
the variance of the PP time series remains to be explored in the sub-Milankovitch timescale.
4.2. Sub-Milankovitch Dynamics
4.2.1. Bolling/Allerod and the Younger Dryas event. The last deglaciation is marked by the Younger Dryas event, which interrupts the global warming trend in the Northern Hemisphere. The Younger Dryas seems to be at least hemispheric in extent and has been already described in the Sulu Sea [Kudrass et al., 1991; Linsley and Thunell, 1990]. The Younger Dryas event is also
present
in the MD97-2141
15•80
record
between
13.5
and 11.5
ka
(Figure 3). The paleoproductivity record inferred from Fp is characterized by an abrupt decrease at 14.55 ka (from 170 to•125 g C m -2 yr -1) to a plateau
until 11.5
ka, followed
by another
decrease
to 100 g C m -2 yr-•.
We interpret this PP record to indicate a sharp decrease of the East Asian winter monsoon strength after 14.55 kyr. A similar abrupt transition at 14.5 ka is recorded in the alkenone-sea surface temperature (SST) record of the meridional South China
Sea as a 1.5øC step [Pelejero et al., 1999a]. Greenland Ice Core
Project (GRIP) and Greenland Ice Sheet Project 2 (GISP2) isotopic records also display an abrupt warming at •14.5 ka. This abrupt warming seems to be at least hemispheric [Bard et al., 1997]. The sea level rise (meltwater pulse (MWP) Ia of Fairbanks [1989]) was invoked by Pelejero et al. [1999c] to account for the thermal and ten'igenous input changes in the South China Sea. However, the abruptness of the PP change (<200 years) is not easily attributable to the flooding of the Sundaland. An abrupt drop in the East Asian winter monsoon intensity can explain this PP change in a more plausible
manner.
The interpretation of the Younger Dryas event in the Sulu Sea is still controversial. Two main hypotheses were summarized by Anderson and Thunell [1993]: either it reflects a cooling event or
it is due to a change
in the 15•80
of seawater.
Modem
analog
technique reconstruction of SST with planktonic foraminifera does not record enough SST difference during the Younger Dryas to account for the observed isotopic shift [Thunell and Miao,1996]. So the enrichment is probably due to changes in seawater isotopic composition during the Younger Dryas. The origin of this change is still being debated as an oceanic source [Duplessy
DE GARIDEL-THORON ET AL.: DYNAMICS OF THE EAST ASIAN WINTER MONSOON 495 2000
• 1000
"• 0:• -2,,5
•.•
-1,5
E 200 • 160 o '• 120 o '- 80Age (cal. yrs BP)
0
50000
100000
150000
a
•
'- - b ...
' ....
' ' ' I L.A.D
Globigerinoides
- _ •,• v ruberpink...
'
200000 ' • , -3 ' -2 . 0 -1 _ _ _ _ I I ... ] •;,,l l]•j I I I I0
50000
100000
150000
200000
Age (cal. yrs BP)
Figure
3. (a) Position
of accelerator
mass
spectrometry
(AMS)
dates
on planktonic
foraminifera
converted
in
calendar
ages
(small
triangles)
and
the
SPECMAP
tie points
used
in the
stratigraphy
(solid
circles).
Note
the
hiatus
between
400 and
440 cm (shaded
area).
(b) MD97-2141
0:80 planktonic
foraminifera
results
at 10 cm intervals
(shaded
line)
compared
with
the
SPECMAP
stacked
deep-ocean
record
(thick
solid
line).
(c) MD97-2141
primary
productivity
(PP)
as reconstructed
from
the coccolithophorid
record.
et aL, 1991] or an atmospheric
variation
[Anderson
and Thunell,
1993].The PP plateau
during
the Allerod
and the Younger
Dryas
is
similar
to the warming
recorded
by alkenones
records
from the
cores 17961 and 17964 in the South China Sea (SCS) [Pelejeroet al., 1999a, 1999b].
The Younger
Dryas-Allerod
SST differ-
ence in the SCS is 0.4øC. This corresponds to an increase of
•0.1%o of the foraminiferal
15:80,
20% of the 0.5%0 change
observed in Sulu Sea sediments [Linsley, 1996]. Our PP record
strengthens
the argument
that
East
Asian
winter
monsoon
dynam-
ics during
Younger
Dryas were not significantly
different
from
the Allerod because of the small measured change in the PPrecord between the Allerod and the Younger Dryas. Thus the
change
in planktonic
foraminifera
15:80
composition
in the Sulu
Sea between the Allerod and the Younger Dryas seems to be
mainly due to an isotopic
variation
in ocean
water linked to
salinity,
after a major
change
in atmospheric
processes
14.5 kyr
ago, during the Bolling.
4.2.2. Millennial-scale PP events during MIS 3. The
Heinrich events in the North Atlantic have been correlated to short increases of the East Asian winter monsoon dynamics
[Chen et al., 1997; Porter and Zhisheng,
1995]. In order to
compare
the millennial
variations
in the North Atlantic
and the
PP variations in the Sulu Sea we smoothed the PP record with a
2 kyr average
moving
window
and resampled
at a 100 year
time
step
(Figure
5). This
2 kyr window
keeps
only the variance
at the
millennial
and longer
timescales
and attenuates
the century-scale
variations.
During the last 80 kyr the•PP record
reveals
eight
events
numbered
PP1-PP8,
some
of wIiich may be synchronous
with North Atlantic environmental changes (Figure 5). The first
one (PP1) at •8.3 kyr ago is in phase,
with the early to middle
Holocene
transition
period
[Alley
et al., 1997].
PP2 matches
with
Heinrich Event 1 (HE1). PP3 occurs
during the Last Glacial
Maximum. PP4 seems to correlate with HE4. PP5 and PP6 do notmatch with any major Heinrich Events, and HE5 is being
intercalated between these two PP increases. However, PP5, at •44 ka is correlated to an increase of the winter monsoonstrength
recorded
in paleoloess
from China,
dated
between
43.3
and 45.2 kyr BP (PL7 of Chen et al. [1997]). PP7 could be
related to HE6. PP8 does not match any Heinrich Event. Chen et
al. [1997] also describe
two events
at 59.2-66.2 ka (PL9) and
68.6-71.2 ka (PL10), which may correlate
with PP7 and PP8
given
age model
uncertainties.
In conclusion,
all PP maxima
in
the Sulu Sea can be correlated with Chinese 1oess events andnotably
events
PP5 and PP8 may correspond
only with the
Chinese loess record. Therefore we conclude that these regional2,5 10
7
I i i i iI i i i i i i i i
111 kaI 39 ka
21 ka I o o i i10 5
10 4
1 10 6
8 10 5
6 10 5
4 10 5
2 10 5
period (ka)Figure 4. Spectral analysis ofthe MD97-2141 PP record between 4.1 and 200 ka. Three peaks appear in the spectral analysis computed using the Blackman-Tukey algorithm (solid line) and the maximum entropy algorithm (dotted line), which correspond to orbital frequencies of the Milankovitch theory.
i i i i i i i x --. m --.
events are indicative of significant changes in the East Asian winter monsoon dynamics. PP1, PP2, PP4, and PP7 match clearly with North Atlantic Heinrich Events. In stage 3, uncertainties in the age model that cannot be smaller than +2 kyr may explain the relative discrepancy between PP5 or PP6 and HE5 but cannot account for the occurrence of supplementary peaks (PP5 or PP6 and PP8). Our data indicate that the dynamics of the East Asian winter monsoon is not directly linked with the major iceberg discharges in the North Atlantic as stated by Porter and Zhisheng [1995]. The East Asian winter monsoon exhibits higher-frequency dynamics than that of the main HE. However, it remains to be determined if a common dynamic is present between the high- and the low-latitude records that is not linked with major icebergs discharges. We next compare the Dansgaard-Oeschger cycles
recorded in the Greenland ice core records with our PP record from the Sulu Sea.
To evaluate
Dansgaard-Oeschger
scale
variability,
we per-
formed SSA on the Sulu Sea PP and on the GRIP •5 80 records to examine the relationships between Greenland climate and East Asian winter monsoon dynamics. For this analysis, we resampled the two records at 200 year time intervals after interpolation. We computed SSA with the Vautard-Ghil autocovariance estimator embedded in 20 dimensions corresponding to 2000 years. The first principal component (PC) in the two records describes the long-term trend, and the second PC shows millennial dynamics (Figure 6 and Table 2). There is a good agreement between the two PC2 records of millennial dynamics in PP and temperature in Greenland during the last 70 kyr. PP increases in the Sulu Sea when temperatures in Greenland decrease. Cross-spectral analysis indicates high coherency between the PC2 of PP and the PC2 of GRIP for the •6 and 3.5 kyr frequency bands with phases of
•160 ø and of 140 ø, which is indicative of the opposite phase
described above. This phase relationship is well constrained for
the deglaciation
by •4C ages. The phase
cannot
be further
investigated because of limited synchronization between the ice
core records and the marine records inherent to differences in
established chronologies.
A strengthening of the East Asian winter monsoon during the glacial stages is compatible with the conclusions of several studies already carried out in this area [Chen and Huang, 1998; Wang et al., 1999]. It corresponds to a strengthening of the Hadley cell
between the Western Pacific Warm Pool Low and the Siberian
High. This mode of atmospheric circulation is compatible with last glacial stage simulations [Kutzbach et al., 1993]. The Siberian Highs are directly connected to the Ferrel cells, which influence the Greenland and Asian climates. This teleconnection should operate via the coupling of these two cells (Ferrel and Hadley) during the winter.
In conclusion, the lack of a systematic correlation between the Sulu Sea PP and HE indicates that iceberg discharges in the North
Atlantic and the East Asian winter monsoon follow different
dynamics. However, the correlation between the Greenland climate
PC2 and the East Asian winter monsoon PC2 indicates that similar
millennial-scale climate variability affects both the Greenland and
the Western Pacific climates.
4.3. Analysis in the Frequency Domain (Suborbital Frequencies)
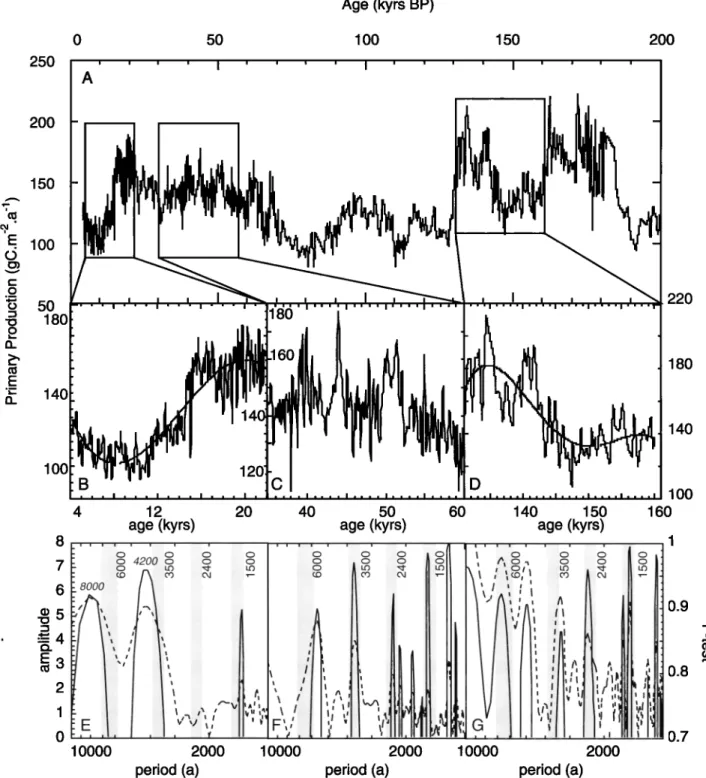
Three time slices were defined to explore high-frequency cycles in the PP record. The first one, from 22 to 4.1 ka, spans the whole deglaciation. The second one, from 60 to 30 ka, includes most of stage 3. The third one, from 160 to 130 ka, corresponds to the end of stage 6. The PP records were derrended in each segment using a ninth-order polynomial for the deglaciation, a fourth-order poly- nomial for stage 6, and a linear derrend for stage 3 (Figure 7c). The three records show variance peaks at periods of •6, 3.5, and 2.4 kyr and between 1780 and 1200 years with a mean at 1500 years (Figure 7e-7g). The spectral peaks could be related to the age
DE GARIDEL-THORON ET AL.: DYNAMICS OF THE EAST ASIAN WINTER MONSOON 497
180 PP3 PP5 PP7 t 180
t PP1
PP2 PP4
PP6 PP8
•'E 160
/
!
•:'•
160
•/..
'
õ -40
I I
-40
I !
a_. 120
120
., ..,
',.ViSit
'V'
lOO
b
& .4
lOO
83i00tD'
2
80
80
0
10
20
30
40
50
60
70
80
Age (kyrs BP)
Figure
5. MD97-2141
primary
productivity
versus
calendar
age
(solid
line)
smoothed
with
a 2 kyr
moving
average
window.
Between
22 and
30
calendar
kyr
B.P.,
a hiatus
exists
in the
sediment
record
identified
with
•4C
dates
(shaded
area).
The
major
peaks
in PP are
numbered
from
1 to 8. The
Younger
Dryas
and
timing
of Heinrich
Events
in the
North
Atlantic
(shaded
area)
are
shown
in toward
bottom.
The
ages
for these
events
are
from
Bard
[1998]
for the
Younger
Dryas,
Thouveny
et al. [2000]
for
North
Atlantic
Heinrich
Events
1-4, and
Chapman
and
Shackleton
[ 1998]
for the chronology of H5 and H6.
model.
However,
changing
the age model
from polynomial
fits to
linear
fits does
not change
the periods
of the peaks
> 100 years,
and
the relative
timing
of the peaks
is kept. Thus the spectral
peaks
seem to be robust features of the signal with this current agemodel.
4.3.1. The •1.5 kyr cycle. For the time slice
from 4.1 to 22
ka the most significant
peak occurs
at 1.38 kyr (significance
of
93%). In the 30-60 ka time slice,
two peaks
occur
at 1.54 kyr
(98.5%)
and 1.2 kyr (99.8%).
In the last
time slice
the peak
is at
1.48 ka (99%).
The strongest
periods
are all around
1.4-1.5 kyr,
and the occurrence in three different time-slices indicates probablya common
origin
and an almost
stationary
signal
across
different
climatic conditions.4.3.2. The m2.4 kyr cycle. In the 4.1-22 ka time slice,
two
minor
peaks
occur
(2.58 and
2.17 kyr), but they
are
not significant.
In the 30-60 ka time slice the prominent peak occurs at 2.32 kyr
(significance
of 79.8%).
In the 130-160
ka time
slice
a significant
peak
is at 2.43 kyr (96%). The period
of 2.4 kyr seems
also
stationary,
but its strength
varies
through
time.
It is more
marked
during
the glacial
stages
and may correspond
to ice volume
forcing.4.3.3. The •4.2-3.3 kyr cycle. In the time slice from 22 to
4.1 ka the peak
is at •4.2 (significance
of 97%). The 30-60 ka
time
slice
peaks
at 3.6 kyr (97%),
and
in the 130-160 ka time
slice
the significant
peak
is at 3.36 kyr (86%).
The strength
of this
peak
is strong
in all the time slices,
but the period
does
not seem
to be
stationary.4.3.4. The •6 kyr cycle. In the time slice
between
4.1 and
22
ka the peak
at •8 kyr is not significant
because
of the dominant
deglaciation
signal
overprints
on
the
low-frequency
band.
In the
30-
60 ka time
slice
a peak
occurs
at 5.7 kyr (significance
of 89.9%),
and
between 130 and 160 ka the significant peak is at 6.7 kyr (92.1%)
with another concentration of variance at •5.06 kyr (90.5%). This
frequency
is most
pronounced
during
the glacials
periods.
5. Discussion:
High-Frequency Cycles
Because
the frequency
of •6 kyr
-• is close
to the Heinrich
Events'
frequency
band,
we filtered
the PP record
in this
frequency
band
using
a Gaussian
filter
(bandwidth
of 0.1666
kyr
-• + 0.03)
(Figure
8a). The resulting
PP series
clearly
shows
an amplification
during
the glacial
periods,
with minima
during
interglacials
(i.e.,
Holocene
and
stage
5:75 - 130 ka), and
indicates
that
this
frequency
seems to be ice volume forced. The amplification could depend on
the high-latitude
ice volume
available
for ice rafting
events.
A 3.7 kyr cycle
has already
been
reported
by Pestiaux
et al.
[1988]
in the Indian
Ocean.
A similar
periodicity
of 3.3 kyr was
also
reported
by Sirocko
et al. [ 1996]
in a production
record
from
the Arabian Sea. These authors attributed this frequency band tocombination tones of orbital forcing on monsoon dynamics. In the
Sulu
Sea
this
period
is significant
during
the MIS3. This period
is
not very stable
in the PP record,
oscillating
between
3.62 kyr for
stage
3 and
3.36
kyr for stage
6. The identification
of this
period
in
several
paleomonsoon
records
seems
to indicate
that
this
period
is
significant
in Asian
monsoon
system
dynamics.
The hypothesis
of
combination tones related to precessional and to obliquity frequen-
cies, which forces
the climate
system
like a nonlinear
oscillator
[Pestiaux
et al., 1988],
could
explain
the variations
of the spectral
peaks
contained
in this frequency
band. Even if a nonlinear
climatic
oscillator
predicts
only periods
>5 kyr [Le Treut
and Ghil,
1983], the monsoon
system
by its amplification
of insolation
forcing
could
probably
generate
cycles
in this frequency
band
[Pestiaux et al., 1988].5.1. The 2.4 kyr Cycle
The PP exhibits
a strong
2.4 kyr cycle, especially
during
the
last
two glacial
stages
(MIS 2-3 and 6). This period
has already
been described in oceanic sediments. Pestiaux et al. [1988]observe
a 2.3 kyr period
in the Indian
Ocean.hydrography,
which
Age (kyrs BP) 80 E 100 (D • 12o ._ > ._ -o 140 o •" 160 E n 180 - 80 - 60 o - 40 ß • - 20 o 0 m 20 .E_
n 40
60 ß 10 20 30 40 50 60 70 _ _ ß .... ! .... ß .... ß .... ß .... ß .... ß PP,,
.,
.,
},
, _/, ,
) , ,
8180 GRIP
PC2 PP PC2 GRIP 10 2o 3o 4o - -I -35 -40 -45 Age (kyrs BP)Figure
6. (top)
MD97-2141
PP (smoothed;
solid
line)
record
versus
the 0•80 record
of the GRIP
ice core
(dotted
line).
(bottom)
PC2
of the
PP record
(solid
line)
and
PC2
of the 15180
record
of GRIP
(dotted
line)
as reconstructed
by
singular spectrum analysis (SSA), which show similar oscillations. Note that both scales in the bottom panel are inverted compared to the top panel.was interpreted as a combination tone of the precessional and obliquity cycles, representing an internal but nonlinear response of the monsoon system to solar forcing. This cycle is also present
in the atmospheric
•4C excess
record
[Stuiver
and Braziunas,
1993], which depends on the solar flux (Hallstattzeit cycle [Damon and dirikowic, 1992]) and on the oceanic-atmosphere
exchange
of •4C. A 2.2 kyr periodicity
was also
reported
in a
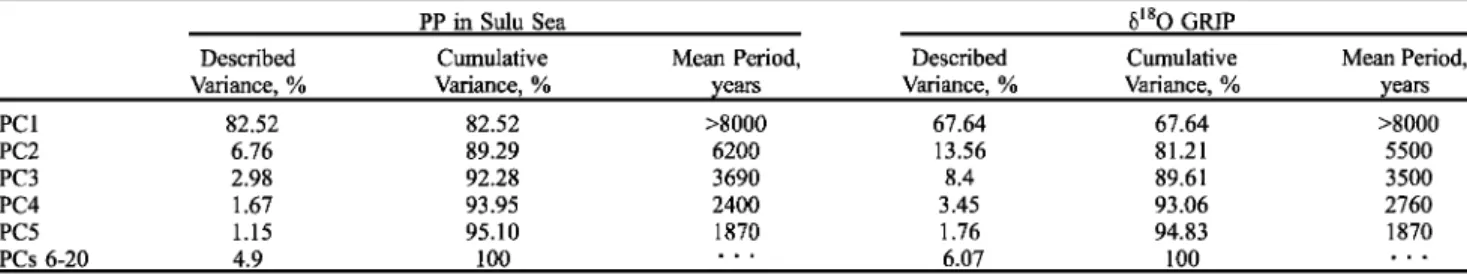
monsoon record from the Oman margin [Naidu and Malgrem,Table 2. Percent Variance Described by the Principal Components of the Singular-Spectrum Analysis and Mean Periods of the PCs
PP in Sulu Sea •80 GRIP
Described Cumulative Mean Period, Described Cumulative Mean Period,
Variance, % Variance, % years Variance, % Variance, % years
PC 1 82.52 82.52 >8000 67.64 67.64 >8000 PC2 6.76 89.29 6200 13.56 81.21 5500 PC3 2.98 92.28 3690 8.4 89.61 3500 PC4 1.67 93.95 2400 3.45 93.06 2760 PC5 1.15 95.10 1870 1.76 94.83 1870 PCs 6-20 4.9 100 ß ß ß 6.07 100 ß ß ß
DE GARIDEL-THORON ET AL.: DYNAMICS OF THE EAST ASIAN WINTER MONSOON 499
Age (kyrs BP)
25O 200 150 ßE. 100
o oø
o '•- 140 0 50 100 150 200 100 121 D 4 12 20 40 50 60 140 150age (kyrs)
age (kyrs)
age (kyrs)
i 22O 180 140 100 160 i i i i i i i i i i i i i i i i i ! i i i i I
8• o
ø 42ooo
ø o
ø o
ø I
oo • • ,o•I
o o nollI' o o o o.t
I P•o, o o , o I]1
I I I 1
' ',
,',
0.9
'
'
, ,
•
[
'
,• , " ,•1 •
2
,
,, , , ,,•,,,
','
,,,,,,,
0•"
"' ' ' '' ' " ',/, • ,- , •
,• , •,' t' 0.7
10000 2000 10000 2000 10( •00 2000period (a)
period (a)
period (a)
Figure 7. (a) MD97-2141 primary productivity (0-200 ka). Three intervals are enlarged in Figures 7a-7c. (b) From 4 to 22 calendar kyr B.P. A polynomial of third order (thin solid line) was applied to detrend the primary productivity signal (thick solid line) before the multitaper method (MTM) spectral analysis. (c) From 35 to 60 ka. PP (thick solid line) is represented, a linear detrend was performed before spectral analysis. (d) From 130 to 160 ka. A fifth-order polynomial (thin solid line) of the PP (thick solid line) was also subtracted from the PP record before the spectral analysis. (e-g) MTM spectra of the three time windows in Figures 7b, 7c, and 7d, respectively. Line amplitudes (dashed line) and F test (estimate of confidence; solid line) are plotted versus period. The shaded areas represent significant frequency bands.
1995], which was attributed to interactions between oceanic
circulation
changes
and atmospheric
]4C changes
at a 2.3 kyr
period. This cycle is not expressed in Termination I of the Sulu Sea PP record. However, it is significant for the glacials stages.The low expression of this cycle in the Sulu Sea during the last termination is perhaps due to the strong overprint of the 1.5 kyr cycle on the PP record. This cycle seems to be stationary throughout this record.
5.2. Pseudo 1.5 kyr Cyclicity
A 1.47 kyr period was first described by Dansgaard et al.
[ 1984]
in the
Camp
century
6•80 ice core
record.
In the
Summit
ice
core (GISP2)
the 6•80 and the polar
component
of a principal
component analysis computed on various chemical markers in the ice both show periods •,,1.5 kyr [Mayewsla' et al., 1997]. A 1.47 kyr period was also described by Bond et al. [1997] in North Atlantic deep-sea cores during the Holocene and the deglaciation. In Alaska, a lake record contains climatic variations with a 1.5 kyr cycle [Campbell et al., 1998]. These records provide growing evidence for cyclicity of •,,1.5 kyr in many high-latitude records. This cycle was also recently linked to fluctuations in continental ice mass during periods of lowered sea level (-45 m below present level) by a simple model of ice dynamics [Schulz et al., 1999]. At lower latitudes the southwest Indian monsoon also shows clear 1.45 kyr cycles in a paleoproductivity record spanning the last deglaciation [Sirocko et al., 1996]. Sirocko et al. speculate that this relationship could be due to subprecessional forcing.In the Sulu Sea the primary productivity shows clear peaks in a broader 1.5 kyr band (Figure 7). The peak in PP is at 1.38 kyr for the last 22 kyr. For stage 2-3 the major peak is at 1.37 kyr. That •,,1.5 kyr cyclicity is also present during stage 6. During the last deglaciation the cycles are well defined. This pseudoperiodicity appears significant in the three time slices, suggesting that it is a pervasive feature of the East Asian winter monsoon dynamics. Our low-latitude record clearly does not record an amplification with increase in the polar continental ice masses (i.e., the sea level does not modulate the envelope of the 1.5 kyr cycle). During the last 160 kyr, eight maxima in the 1.5 kyr envelope were counted, which correspond roughly to the precession period (160/8 = 20 kyr) (Figure 8b). The East Asian monsoon 1.5 kyr cycle thus could be the climatic expression of a combination tone of the orbital insolation frequencies as already expressed by Pestiaux et al. [1988] and Sirocko et al. [1996]. The pervasive occurrence of this cycle during both glacial and interglacial periods in the subtropics seems to indicate that if a 1.5 kyr climate oscillator exists, a common origin between high and low latitudes is expected for this cyclicity. We suggest that its presence in the Sulu Sea is not forced by high latitudes, as indicated by its presence during stages 1 and 5 in the Sulu Sea and absence in the intervals in the GRIP record [Stuiver and Braziunas, 1993]. Further data are necessary to improve the definition of the frequency bands and the geographical extent of these rapid climate cycles.
6. Conclusions
We reconstructed primary productivity (PP) from coccoliths in the MD97-2141 core, located in the Sulu Sea during the last 200 kyr.
1. We find that PP increased during the glacial stages, whereas the interglacials are times of lower PP. We attribute this PP change to a strengthening of the East Asian winter monsoon in the Sulu Sea during glacial stages.
2. The PP record indicates that an abrupt decrease in the East Asian winter monsoon occurred 14.55 calendar kyr B.P., followed by a •,,2 kyr plateau during both Allerod and Younger Dryas. It
shows
that
changes
in the
•80 record
from
the Sulu
Sea
during
the
Younger Dryas are most likely linked with sea surface salinities changes.3. The PP record exhibits eight rapid oscillations during the last 70 kyr. Only four PP events are synchronous with Heinrich Events. This implies that the East Asian winter monsoon and North Atlantic iceberg discharges follow different dynamics, and that HE are not systematically forcing increases in the East Asian winter monsoon. However, these PP oscillations appear to correlate
Age (kyrs BP)
lO
'- 5
-5
-lO
o 20 40 60 80 lOO 12o 14o 16o
15 I , , , I 11 Ii :: : I, , ,I , ,, I ,, , I, , ,I -15 0 20 40 60 80 100 120 140 160 10 -5 -10
Age (kyrs BP)
Figure 8. Filtered PP with a Gaussian filter centered on (a) 6000 years and (b) 1500 years. The envelope of the 1500 years filtered signal exhibits a •,,20,000 years modulation.
with peaks of the East Asian monsoon recorded in the Chinese loess. In the timescale close of the pacing of Dansgaard-Oeschger cycles, singular-spectrum analysis reveals that the PP record in the Sulu Sea can be correlated with the Greenland climate. Therefore a common dynamic, which is not forced by icebergs discharges in the North Atlantic, is present in both high- and low-latitude paleoclimatic records.
4. Four dominant frequencies were isolated in the high- frequency pacing of the East Asian winter monsoon. They occur (1) at •6 kyr, (2) in a 3.3-4.2 kyr frequency band of unknown origin, (3) in a 2.4 kyr frequency band probably resulting from the coupling between solar flux and oceanic processes, and (4) in a 1.5 kyr band. This •1.5 kyr pseudoperiodicity is a pervasive feature of the East Asian winter monsoon during the marine stages 1, 3, 5, and 6. The origin of this climatic cyclicity remains unknown, but we suggest that its presence at this site in the low-latitude western Pacific is not forced from the high
latitudes.
Acknowledgments. The support of French MENRT, TAAF, CNRS/ INSU, and IFRTP to the Marion-DuJ?esne and the IMAGES Program was necessary to perform this work. T.G. was supported by a predoctoral grant of the French Ministbre de la Recherche. Financial support from INSU grant to TG. and L.B. is acknowledged. B.K.L. acknowledges grant OCE 9710156 and technical assistant Stephen Howe. We are indebted to Delia Oppo, who contributed to the collection of the
AMS14C ages at the WHOI-NOSAMS AMS facility and •180 data with
the NSF grant OCE-9710097, and the technical help of Susan Trimarchi and Luping Zou.

![Figure 2. Wind strength in Sulu Sea at 10øN (Comprehensive Ocean-Atmosphere Data Set (COADS) Atlas) and estimated monthly primary production at the same location from Antoine and Morel [ 1996]](https://thumb-eu.123doks.com/thumbv2/123doknet/13707933.434156/4.897.86.441.98.552/figure-strength-comprehensive-atmosphere-estimated-production-location-antoine.webp)