Discovery and Characterization of a Small Molecule that Modulates c-Myc Mediated Transcription via Max Homodimer Stabilization
by
Andrew Chen
B.S., Cornell University, 2011
Submitted to the Department of Biological Engineering in partial fulfillment of the requirements for the degree of
Doctor of Philosophy at the
Massachusetts Institute of Technology June 2019
C 2019 Massachusetts Institute of Technology. All rights reserved.
Author ...
S ig natu re red acted
Department of Biological Engineering May 3, 2019
Signature redacted
C ertified by ...
Angela N. Koehler, Ph.D. Associate Professor of Biological Engineering
Signature redacted
Thesis SupervisorA ccepted by ... MASSACHUSETTS INSTITUTE
OF TECHNOLOGY
JUL 0
3
2019
Forest M. White, Ph.D. Professor of Biological Engineering Committee Chair
Thesis committee:
Angela N. Koehler, Ph.D.; Associate Professor of Biological Engineering, MIT (Thesis Supervisor)
Forest M. White, Ph.D.; Professor of Biological Engineering, MIT (Committee Chair) Richard A. Young, Ph.D.; Professor of Biology, MIT
Discovery and Characterization of a Small Molecule that Modulates c-Myc Mediated Transcription via Max Homodimer Stabilization
by
Andrew Chen
Submitted to the Department of Biological Engineering on May 3, 2019, in partial fulfillment of the
requirements for the degree of Doctor of Philosophy
Abstract
The transcription factor Myc is a basic helix-loop-helix leucine zipper (bHLHLZ) protein with crucial roles in regulating normal cellular processes, but its transcriptional activity is deregulated in a majority of human cancers. Myc transcriptional activity is dependent on dimerization with its obligate partner Max, another bHLHLZ transcription factor. Max also forms homodimers as well as heterodimers with other proteins including the Mxd family of proteins, creating a dynamic network of protein-protein interactions to regulate transcriptional programs. Despite the significance of this network, the arsenal of chemical probes to interrogate these proteins in cancer biology remains limited.
Here, we utilized small molecule microarrays and luciferase-based reporter assays to identify compounds that bind Max and modulate Myc transcriptional activity. We discovered the small molecule KI-MS2-008, which stabilizes the Max homodimer while reducing Myc protein and Myc-regulated transcript levels. KI-MS2-008 also decreases viable cancer cell growth in a Myc-dependent manner and suppresses tumor growth in mouse models of Myc-driven cancers. In a cancer cell line model treated with KI-MS2-008, the equilibrium of protein-protein interactions shifts toward a transcriptionally repressed state over time by recruiting Mxd4 and other repressive machinery to Max. This study establishes that perturbing Max dimerization with small molecules is a tractable approach to targeting Myc activity in cancer.
Thesis Supervisor: Angela N. Koehler
Table of Contents
A b s tr a c t ... 3
A cknow ledgem ents ... 9
L ist o f F ig u r e s ... 1 3 L ist o f T a b le s ... 1 6 List of A bbreviations Used...17
Chapter 1: Introduction ... 20
M yc: a m aster regulator and com m on oncoprotein... 20
M yc-M ax heterodim er disrupters ... 28
M ax-M ax stabilization as an alternative m ethod to inhibit M yc... 33
Chapter 2: Discovery of a Max-binding small molecule that modulates Myc-driven transcription via stabilization of the M ax hom odim er ... 34
A b str a ct... 3 4 C o n tr ib u tio n s ... 3 5 In tr o d u c tio n ... 3 6 Results and discussion ... 38
Small molecule microarrays and Mye reporter assays led to the prioritization of KI-MS2-001 from a library of 45,000 com pounds. ... 38
Structure-activity relationship studies revealed the simpler active analogue KI-MS2-008...42
KI-MS2-001 and KI-MS2-008 display efficacy in cancer cell lines consistent with Max as a d ir e c t ta r g e t. ... 4 6 K I-M S2-008 analogues engage M ax in vitro and in live cells ... 51
K I-M S2-008 engages M ax in vitro and in live cells. ... 58
K I-M S2-008 induces M ax/M ax hom odim erization... 60
N e x t ste p s ... 6 2 M apping the binding site of K I-M S2-008 on M ax ... 62
Future SM M screens... 63
M aterials and m ethods ... 63
Sm all m olecule m icroarray ... 63
Transcriptional reporter assay ... 64
DNA -binding ELISA for activated c-M yc ... 65
Protein binding assay...65
Liver m icrosom e stability of KI-M S2-001 ... 66
V ia b le c e ll a ssa y ... 6 6 F lo w cy to m e try ... 6 7 Bead-based lysate pull-down with KI-M S2-081... 67
In vitro labeling of M ax with KI-M S2-085... 68
Pull-down with KI-M S2-085 in live cells... 69
Cellular therm al shift assay (M olina et al., 2013)... 70
'sN-heteronuclear single quantum coherence... 71
Electrophoretic m obility shift assay ... 71
Analytical ultracentrifugation ... 72
Size exclusion chrom atography ... 73
C o n c lu sio n ... 7 4 A ck n o w led g e m e n ts ... 7 5 Chapter 3: Investigating the strategy of modulating Myc-driven transcription via Max homodimer stabilization by profiling the effects of KI-MS2-008 treatment on cellular and murine cancer models ... 7 6 A b str a c t... 7 6 C o n tr ib u tio n s ... 7 7 In tr o d u c tio n ... 7 8 R esu lts a n d d isc u ssio n ... 7 9 K I-M S2-008 displays a wide variety of responses in cancer cell lines... 79
KI-MS2-008 does not appear to have off-target effects in a panel of kinases...83
In P493-6 cells, KI-M S2-008 treatm ent decreases c-M vc protein levels ... 84
KI-MS2-008 treatment decreases c-Myc protein binding and increases Max protein binding at prom oters of active M yc-regulated genes ... 94
KI-MS2-008 exhibits efficacy in cellular cancer models derived from mice ... 96
K I-M S2-008 exhibits efficacy in m urine cancer m odels ... 98
N e x t ste p s ... 1 0 1 Further m urine studies...101
M aterials an d m ethods ... 101
M ycoplasm a testing ... 101
V ia b le c ell a ssay ... 1 0 2 Tim e course of protein levels...102
Ubiquitination assay ... 103
R N A -seq ... 1 0 4 q P C R ... 1 0 7 C hrom atin im m unoprecipitation sequencing... 107
Im m unofluorescence staining and im aging ... 109
M yc-addicted tum or cell lines in m ice... 110
M etabolic stability studies ... 110
Pharm acokinetics ... 112
Repeat dose toxicity studies...112
LC/M S analysis of plasm a sam ples ... 113
C o n c lu sio n ... 1 1 4 A cknow ledgem ents ... 115
Chapter 4: Characterization of the Max interactome and its perturbations in response to KI-MS2-0 KI-MS2-0 8 tr e a tm e n t...1 1 6 A b str a c t ... 1 1 6 C o n tr ib u tio n s ... 1 1 7 In tr o d u c tio n ... 1 1 8 Results and discussion ... 120
Approach 1: Monitoring the Max interactome in cell lysates treated with compound ... 120
Approach 2: Monitoring the Max interactome in lysates corresponding to cells treated with c o m p o u n d ... 1 2 5 At long time points of 4 and 8 hours, KI-MS2-008 treatment results in recruitment of transcriptional repressive m achinery to the M ax interactom e ... 127
Preliminary validation experiments appeared to support mass spectrometry findings...132
M ax interactom e characterized by m ass spectrom etry in P493-6 cells...137
Perturbations to the M ax interactom e in M V-4-11 cells ... 142
N e x t ste p s ... 1 4 6 Experiments to validate the recruitment of transcriptional repressive machinery ... 146
M aterials an d m ethods ... 146
C o-im m unoprecipitation ... 146
M ass spectrom etry ... 149
Protein association netw ork analysis via string-db...151
4.
A cknow ledgem ents ... 155 Chapter 5: Conclusion and future directions ... 156 C o n c lu sio n ... 1 5 6
Future directions...158 Measuring mass and mass accumulation rate at the single cell level with suspended
m icrochannel resonators (SM Rs) ... 158 Proteolysis targeting chim eras (PRO TA Cs) and K I-M SI-001 ... 162 Small molecule microarray screens with cell lysates and endogenous levels of transcription fa c to r s ... 1 7 3
Acknowledgements
It's been a long, challenging journey since I first arrived at MIT in August 2013 as an
excited first-year student. I knew it would be an academically rigorous test from the beginning,
but I didn't expect the other mental obstacles that were part of the experience and I'd be lying if I
told you I didn't break down a few times. Fortunately, I had world-class mentors and teachers to
guide me through the learning process and skills development, as well as a massive support group
made up of old friends, and new friends going through similar experiences or who had just finished
similar journeys. This section would probably be at least ten pages long if I described everyone
I'm thankful for, so I apologize to those I do not explicitly name. I'll reserve this section to the
individuals who had personal impacts on me; the more formal scientific contributions are listed in
later chapters.
I have learned so much from Angela Koehler, who let me join her lab even though I had
no previous experience with small molecules and did not even know what chemical biology was.
She constantly creates opportunities for learning through research talks, collaborations, and new
types of experiments. I'm always inspired by her breadth of knowledge and enthusiasm for
research that shows up each meeting or talk. The number of names she remembers is
mind-boggling, as is her ability to secure funding for the Myc project. Apart from science, I'm especially
appreciative of Angela's support in finding a reasonable work-life balance, as I was able to
complete my first marathons and Spartan races while completing my studies at MIT.
I have also been fortunate to have incredible scientists guide me as thesis committee
members. Thanks to Forest White for being the chair of this committee and having a massive
always great to hear regardless. To Rick Young and Phil Sharp for creating the friendliest, most
supportive learning environment for a topic as difficult and complicated as "cell biology: structure
and functions of the nucleus", and suggesting all types of key experiments for this thesis.
The group of people Angela has recruited has made this experience especially memorable.
Thanks to Francisco Caballero, Melissa Kemp and Jiyoung Hong for being so welcoming and
convincing me to join the lab. Extra thanks to Francisco for being so patient while mentoring me
at the beginning of this journey. Many thanks to Rob Wilson for always asking the thorough
questions no one else wanted to ask for good, meticulous science, and educating me about
basketball and rural Indiana. To Shelby Doyle for always offering to help out with written and oral
communication, and cheering me up when I'm down. Thanks to Andre Richters for support in the
lab and running Spartan races with me. To Becky Leifer for taking care of so many things in lab
and supplying adorable videos of her nephew and niece. To Catherine Henry - as well as Helen
Evans and Marius Pop - for hosting lab get-togethers despite also doing a hundred other things.
Thanks to Kristen Frombach and Hanna Tseng for helping me with experiments and always being
excited, friendly and happy (along with Kimia Ziadkhanpour and Katie Gohres, who earned the
title of quokka as her spirit animal). To the whole Myc team of the Koehler lab (Francisco
Caballero, Brice Curtin, Helen Evans, Dave Freeman, Kristen Frombach, Jiyoung Hong, Dylan
Neel, Marius Pop, Eric Stefan, Nick Struntz, Yulong Su, Hanna Tseng, Mattheus (Thijs)
Wildschut, and Rob Wilson) for work included in our paper and this thesis. To Edward (Ted)
Richards, our honorary Koehler lab member, who gave support both in lab and in life. Finally,
thanks to everyone who shaped the culture of the lab to make it fun and to create memories - like
Andre asking Rob which sport March Madness was about and proceeding to win the office bracket
If you look through the author list of the paper our lab wrote introducing the small molecule
described in this thesis, you'll notice a diverse set of scientists with whom I've had the pleasure of
working. I'd like to specifically thank Anja Deutzmann of Stanford School of Medicine and
Charles Lin of Baylor College of Medicine for answering a seemingly endless barrage of questions
as we prepared this manuscript. To Monica Schenone, Gaelen Guzman, and Annie Apffel of the
Proteomics group at the Broad Institute for running the mass spec experiments and teaching me so
much about mass spec. To Amedeo Vetere for years of attending Koehler lab group meetings and
giving advice that shaped the direction of so many projects including the ones in this thesis. To
Jaime Cheah for supporting me on so many projects as the High Throughput Screening Facility
leader and for introducing me to Spartan racing as a friend.
I could not have made it to MIT without previous mentorship and guidance. Thanks to
Ailong Ke and Fran Ding for accepting me into their lab at Cornell University and teaching me
the basics starting from how to use a pipette. Thanks to my Cornell academic advisor Dan Luo for
support and advice. Thanks to Jun Tian and Bruce Eagan for teaching me how to grow cells in
shake flasks and bioreactors at Bristol-Myers Squibb and shaping my decision to go to graduate
school.
Outside of the lab, I've had support from so many people. Thanks to the BE class of 2013
for helping me through the BE core classes and for all the social events that kept me sane. Thanks
to my former roommates Jaideep Dudani, Naveen Mehta, Bo Qing, and Ben Mead for all the fun
and support, and to my current roommate Alex Wang for being awesome at music and running.
To Natasha Patel-Murray for being the most amazing TA partner ever. To everyone who ever did
Thanks to all my friends from the past who visited me in Boston while I was working
toward this thesis: Yufei Chen, Yi Deng, Michelle Huynh, Charles Lee, Dennis Liu, and Michael
Shu. Thanks to Margaret Xu for reminding me I'm getting older each year. Many thanks to Han
Jiang for taking me on a food tour of the greater Boston area throughout this journey.
I owe all the opportunities I've been given to my family, who immigrated to America
before I was born. To my mother and father, Tai-Jen Chang and Ray-Der Chen, for making that
decision that changed everything. It's pretty crazy that they left everyone they knew and the culture
they were familiar with to give their kids more opportunities and further their education, but I'm
glad they did it. I'd like to give additional thanks to my mother, who has always done everything
she could to give me more opportunities and encourage learning - from teaching me math when I
was little to bribing me to get good grades in 5th grade to literally driving me to the MIT interview
through a snowstorm when my flight was cancelled so I could nap on the car. To my sisters, Diana
Chen and JiaYing Grygiel, for being the best role models and being supportive of me throughout
my life. I'm grateful to have grown up with them and it's an amazing feeling to know I can share
anything with them and get advice from them. Also, thanks for all the cute pictures and stories of
their kids. And finally, thanks to my cute niblings - Joseph Grygiel, Paul Grygiel, Lily Ton-Nu,
List of Figures
Figure 1.1. Crystal structure of heterodimer formed from bHLHLZ regions of c-Myc (blue) and Max
(red) binding the E-box sequence of DNA . ... 21
F igure 1.2. T he M ax netw ork...27
Figure 1.3. Structures of M yc/M ax disrupters. ... 31
Figure 1.4. Structure of Max/Max homodimer stabilizer NSC 13728 ... 33
Figure 2.1. Discovery of putative Max binders using small molecule microarrays... 39
Figure 2.2. Prioritization of Max binders that modulate Myc-driven transcription... 40
Figure 2.3. Prioritization of a lead compound from top hits... 41
Figure 2.4. Chemical structures of KI-MS2-001 analogues to establish cursory SAR. ... 43
Figure 2.5. Analysis of KI-MS2-001 analogues in Myc dual luciferase reporter assays. ... 44
Figure 2.6. Analysis of KI-MS2-001 analogues in CellTiter-Glo@ assays... 45
Figure 2.7. KI-MS2-001 and KI-MS2-008 modulate Myc-driven transcription in cells and inhibit viable cell levels in a M yc-dependent m anner... 48
Figure 2.8. KI-MS2-001 and KI-MS2-008 do not affect viable cell levels of PCl2 cells... 50
Figure 2.9. K I-M S2-081 engages M ax in vitro ... 52
Figure 2.10. KI-MS2-081-linked beads pull down many cellular proteins... 55
Figure 2.11. Workflow schematic for KI-MS2-085... 56
Figure 2.12. KI-MS2-085 engages Max in vitro and in live cells... 57
Figure 2.13. KI-MS2-008 engages Max in live cells as seen by cellular thermal shift assay. ... 59
Figure 2.14. KI-MS2-008 engages chemically stabilized Max...60
Figure 2.15. KI-MS2-008 induces Max/Max homodimerization... 62
Figure 3.1. Profiling of KI-MS2-001 and KI-MS2-008 in cancer cell lines... 80
Figure 3.2. Dose-response curves for viable cell levels in a variety of cancer cell lines, including some derived from KrasLSL-GI2 D/+;Trp53Flox/Flox (KP) mouse models, in response to treatment with KI-MS2-008. ... 8 1 Figure 3.3. Normalized viability values for a panel of almost 500 adherent cell lines at 4 doses of KI-M S2-008 as m easured by PR ISKI-M ... 82
Figure 3.4. Normalized viability values for a panel of almost 300 suspension cell lines at 4 doses of KI-M S2-008 as m easured by PR ISKI-M ... 83
Figure 3.5. K inase profiling of K I-M S2-008... 84
Figure 3.6. KI-MS2-008 decreases Myc protein levels, while other protein levels in the network were u n ch an g ed . ... 8 5 Figure 3.7. Protein levels of c-Myc after treatment with KI-MS2-008 in various cell lines. ... 86 Figure 3.8. Time course of c-Myc, c-Myc (pS62), c-Myc (pT58) and corresponding vinculin protein
Figure 3.9. Dose-response effect of KI-MS2-008 on c-Myc, c-Myc (pT58) and vinculin protein levels. 89
Figure 3.10. KI-MS2-008 affects the global Myc transcriptional program... 93
Figure 3.11. KI-MS2-008 treatment decreases c-Myc protein binding and increases Max protein binding at prom oters of M yc-occupied genes...95
Figure 3.12. KI-MS2-008 treatment specifically decreases Myc-regulated gene expression. ... 96
Figure 3.13. KI-MS2-008 exhibits efficacy in cellular and murine cancer models. ... 98
Figure 3.14. Metabolism and toxicity in mouse microsomes and mice... 100
Figure 4.1. Quantitative mass spectrometry allows comparisons of relative protein abundance between sam p les... 1 19 Figure 4.2. Workflow for Max-anchored pulldown of cell lysates treated with 20 pM KI-MS2-008 or DMSO, followed by quantitative mass spectrometry. ... 120
Figure 4.3. Immunoblots of c-Myc and Max when P493-6 lysates were treated with 20 IM KI-MS2-008 or D M S O ... 12 1 Figure 4.4. Max interactome when cell lysate was treated with KI-MS2-008... 122
Figure 4.5. Effect of KI-MS2-008 on Max interactome when cell lysate was treated with KI-MS2-008. ... 12 3 Figure 4.6. Workflow for Max-anchored pulldowns of proteins from cell lysates generated from P493-6 cells treated with 20 tM KI-MS2-008 or DMSO, followed by quantitative mass spectrometry... 125
Figure 4.7. Immunoblots of c-Myc and Max when P493-6 cells were treated with 20 pM KI-MS2-008 or D M SO at various tim e points. ... 126
Figure 4.8. Effect of KI-MS2-008 on the Max interactome when P493-6 cells were treated with 20 [tM K I-M S2-008 or D M SO . ... 128
Figure 4.9. Max network analysis at 4 and 8 hours for P493-6 cells treated with KI-MS2-008 or DMSO. ... 13 0 Figure 4.10. Preliminary validation of Max-Mxd4 and Max-Mxd4-Sin3a interactions strengthened by K I-M S2-008 treatm ent. ... 133
Figure 4.11. Kinetics of Max interactome protein levels increased in response to KI-MS2-008 treatment. ... 13 5 Figure 4.12. Kinetics of Max interactome protein levels decreased in response to KI-MS2-008 treatment. ... 13 6 Figure 4.13. Max interactome defined by Max-anchored co-immunoprecipitations followed by mass sp ectrom etry ... 13 9 Figure 4.14. Preliminary Max interactome using the cell lysate-based approach... 140
Figure 4.15. Prothymosin alpha (Ptma) was discovered to be enriched in the Max interactome in MV-4-11 cells treated w ith 50 pM K I-M S2-008... 143 Figure 5.1. Mass accumulation rate (MAR) and cell mass distributions for P493-6 cells treated with
D M S O ... 16 0
Figure 5.2. Mass accumulation rate distributions for P493-6 cells treated with 10 gM KI-MS2-008 or D M S O for 8 h ours. ... 16 1
Figure 5.3. Structure of K I-M S1-001... 164
Figure 5.4. Effect of KI-MS1-001 on Myc transcriptional activity and P493-6 viable cell levels... 164
Figure 5.5. Cell line profiling for KI-MS1-001 across the NCI CTD2 cell line panel of over 800 cell lin e s... 16 5 Figure 5.6. Correlation between sensitivity of cell lines toward KI-MSI-001 and gene expression of the M y c ... 16 6 Figure 5.7. Dose-response curves for effect of KI-MS1-001 on kinases most sensitive to compound treatm en t. ... 16 7 Figure 5.8. Effect of ATP and KI-MSI-001 concentrations on Haspin activity (top) and Lineweaver-Burk plot of 1/v vs. 1 [S] to evaluate the effect of KI-MS1-001 on Haspin (bottom). ... 168
Figure 5.9. Immunoblots of Haspin, c-Myc and Max from samples containing proteins pulled down by beads linked to KI-MS1-055 with varying amounts of compound on the beads. ... 170
Figure 5.10. Cursory structure-activity relationships for KI-MS1-001 with activity in Myc transcriptional reporter and inhibitory effect on H aspin... 171
Figure 5.11. Schematic for SM M screens of cellular lysates... 175
Figure 5.12. Recombinant c-Myc protein was produced from E. coli. ... 176
Figure 5.13. Snapshots of subarrays from a completed small molecule microarray screen. ... 178
Figure 5.14. Myc dual luciferase reporter assay results for 16 of the 19 hits from small molecule microarray screens of purified c-Myc and c-Myc containing cell lysates. ... 179
Figure 5.15. Viable cell counts of various SMM hits and lead compounds MS1-001 (MS 1) and KI-M S2-001 (KI-M S2) 72 hours after treatm ent... 181
Figure 5.16. 3 novel compounds (BRD-9694, BRD-7700 and BRD-6589) inhibited the growth of NAMALWA cells in a dose dependent manner comparable to our lead compounds KI-MS1-001 (KI-M S1) and K I-(KI-M S2-001 (K I-(KI-M S2). ... 182
Figure 5.17. 3 novel compounds inhibited c-Myc transcriptional activity in HEK-293T cells in a dose dependent manner similarly to lead compounds KI-MS1-001 (KI-MS1) and KI-MS2-001 (KI-MS2).. 183
Figure 5.18. Dose-response curves of viable cell levels in response to treatment with BRD-9694 and BRD-6589 in P493-6 cells with or without doxycycline... 184
List of Tables
Table 1. Analysis of KI-MS2-001 analogues in cellular assays... 46
Table 2. Proteins most strongly recruited to the Max interactome when P493-6 cell lysate was treated w ith 20 pM K I-M S2-008. ... 124 Table 3. Proteins most strongly recruited to the Max interactome when P493-6 cells were treated with 20
pM K I-M S2-008 for 8 hours... 129
Table 4. Values for proteins most strongly recruited to the Max interactome at long time points of 4 and 8 h o u rs... 13 1 Table 5. Values for proteins most strongly recruited to the Max interactome at long time points of 4 and 8
hours in P 493-6 cells... 137
Table 6. Proteins in the M ax interactom e... 138 Table 7. Values for proteins most strongly recruited to the Max interactome at 30 minutes in MV-4-1 1
ce lls... 14 4
Table 8. Values for proteins most strongly recruited to the Max interactome at 8 hours in MV-4-1 1 cells.
... 14 5 Table 9. List of cell lines most sensitive to KI-MS1-001 treatment... 166 Table 10. Common enzyme inhibition types, the mechanism of action and the slopes and y-intercepts in
the L inew eaver-B urk plot. ... 169 Table 11. The 3 novel compounds had comparable solubility and potency in the viability assay... 182
List of Abbreviations Used
acetonitrile (ACN)
Administrative Panel on Laboratory Animal Care (APLAC) analytical ultracentrifugation (AUC)
basic helix-loop-helix leucine zipper (bHLHLZ) bioluminescence imaging (BLI)
a G 1/S-specific cyclin-D 1 (CCND 1) cyclin dependent kinase (CDK) cellular thermal shift assay (CETSA)
chromatin immunoprecipitation sequencing (ChIP-seq) collision induced dissociation (CID)
chromosomal passenger complex (CPC) counts per million mapped reads (CPMs) CellTiter-Glo@ (CTG)
elution (E)
Enhancer boxes (E-boxes)
ethylenediaminetetraacetic acid (EDTA) ethyleneglycol tetraacetic acid (EGTA)
eukaryotic translation initiation factor 3 subunit A (Eif3a) eukaryotic translation initiation factor 4E (EIF4E)
enzyme-linked immunosorbent assays (ELISAs) electrophoretic mobility shift assays (EMSAs) enrichment scores (ES)
10058-F4 (F4) formic acid (FA)
fluorescence resonance energy transfer (FRET) flow through (FT)
gene set enrichment analysis (GSEA) threonine 3 of histone 3 (H3T3)
HALLMARKMYCTARGETS _V2 (HALLMARK MYC) hepatocellular carcinoma (HC)
haemotoxylin and eosin (H&E)
2-Hydroxypropyl)-p-cyclodextrin (HPBCD) human serum albumin (HSA)
input (I)
inhibitor of acetyltransferases (INHAT)
isobaric tags for relative and absolute quantification (iTRAQ) Institutional Animal Care and Use Committee (IUCAC) Kras LSL-GI2D/+; Trp53Flox/Flox (KP)
liquid chromatography - mass spectrometry (LCMS)
Matrix Assisted Laser Desorption/Ionization (MALDI) mass accumulation rate (MAR)
mechanism of action (MoA) moesin (Msn)
Max dimerization protein 4 (Mxd4)
nucleus accumbens-associated protein 2 (Nacc2) normalized enrichment scores (NES)
NSC13728 (NSC)
NOD/SCID/IL-2Ry"nul (NSG)
osteosarcoma (OS)
protein-fragment complementation (PCA) propidium iodide (PI)
phosphatidylinositol 3-kinase (PI3K) protein-protein interactions (PPI)
prothymosin alpha (Ptma) REST corepressor 1 (Reorl)
reads per million per basepair (rpm/bp) structure-activity relationship (SAR) size exclusion chromatography (SEC)
stable isotope labeling by amino acids in cell culture (SILAC) small molecule microarrays (SMMs)
suspended microchannel resonators (SMRs) signal to noise ratio (SNR)
surface plasmon resonance (SPR) serine/arginine protein kinase (SRPKl) transcriptional activation domain (TAD) T-cell acute lymphoblastic leukemia (T-ALL) tandem mass tags (TMT)
transcriptional start sites (TSSs) wash (W)
extracted ion chromatograms (XIC)
Chapter 1: Introduction
Myc: a master regulator and common oncoprotein
As a master regulator aberrant in -70% of human cancers, the transcription factor c-Myc
has become one of the most studied proteins in history. In 1911, Peyton Rous demonstrated that
cell-free filtrates isolated from chicken sarcomas could be used to induce tumor formation in
recipient chickens (Rous, 1911). This work paved the way toward the discovery of MC29, a virus
that causes myelocytomatosis in chickens, eventually contributing to the name MYC. The virus
itself was found to consist of a gag-myc fusion gene, from which the v-myc gene was characterized
(Hu et al., 1979; Mellon et al., 1978; Sheiness et al., 1978). Finally in 1982, the cellular homologue
c-myc was discovered (Vennstrom et al., 1982).
Since its discovery, a plethora of information has been published surrounding c-Myc
including studies related to structure and mechanism of action. The N-terminus of c-Myc contains
a transcriptional activation domain (TAD), which contacts proteins associated with RNA
polymerase II for transcription and mediates degradation through ubiquitination (Salghetti, 1999;
Tansey, 2014). At the C-terminus, c-Myc contains a basic helix-loop-helix leucine zipper
(bHLHLZ) region that binds to DNA (Prendergast and Ziff, 1991). To bind DNA, however, c-Myc
must first form a heterodimer with another bHLHLZ protein called Max. This interaction causes
c-Myc to change from an intrinsically disordered state to a structured state with coiled coils that
interact with Max (Figure 1.1) (Tansey, 2014). c-Myc-Max heterodimers can then bind to
Enhancer boxes (E-boxes) with the canonical sequence "CACGTG" (Jones, 2004; Blackwood and
increases transcription of target genes, though repression is also well-known (eg. through binding
with Miz-1) (Salghetti, 1999; Tansey, 2014).
Figure 1.1. Crystal structure of heterodimer formed from bHLHLZ regions of c-Myc (blue) and
Max (red) binding the E-box sequence of DNA (Tansey, 2014).
In addition to the previously mentioned c-Myc interactors Max and Miz- 1, some additional
interactors include TRRAP, PTEF-b and TFIIF. Interactions with TRRAP are necessary to recruit
GCN5 for histone acetyltransferase activity (McMahon et al., 2000), and these interactions are
critical for tumor initiation (Kalkat et al., 2018). Interactions with TFIIF and PTEF-b facilitate
phosphorylation of RNA Pol II and transcriptional pause release, which can accelerate tumor
growth (Bres et al., 2008; Eberhardy and Farnham, 2002; Kalkat et al., 2018). Other c-Myc
interactors are involved in transcriptional activation, transcriptional repression and post
translational modifications (Tu et al., 2015). However, the larger c-Myc interactome remains
discovery of very different lists of putative c-Myc interacting proteins (Agrawal et al., 2010;
Kalkat et al., 2011; Kim et al., 2010; Koch et al., 2007). This observation suggests that c-Myc
binding proteins may depend on experimental conditions such as the technique used, the cell type
and cell state.
As a master regulator, it is estimated that c-Myc controls 15% of all genes (Patel et al.,
2004). c-Myc controls diverse cellular processes such as the cell cycle, metabolism, protein
synthesis and apoptosis, and interacts with many signaling transduction pathways including the
Wnt pathway and MAPK cascade (Dang, 2013, 2012; Nie et al., 2012). As c-Myc is so crucial for
normal functioning, healthy cells must have tight regulation of c-Myc, which occurs at the
transcription, translation, and post translational steps. c-Myc transcription is regulated through
transcription initiation and release of paused RNA polymerase II in elongation (Bentley and
Groudine, 1986; Eick and Bornkamm, 1986; Krystal et al., 1988). Furthermore, the transcription
initiation factor eIF4E controls the export of c-Myc mRNA to the cytoplasm (Culjkovic et al.,
2006). During the process of forming c-Myc protein, translation can be repressed by the
RNA-binding protein TIAR and is limited by the relatively short half-life of the c-Myc mRNA (~ 10
minutes) (Dani et al., 1984; Mazan-Mamczarz et al., 2006). Finally, the c-Myc protein is controlled
through posttranslational modifications such as phosphorylation, acetylation, glycosylation and
ubiquitination (Chou et al., 1995; Vervoorts et al., 2006, 2003). For example, phosphorylation at
Ser62 stablizes c-Myc and the subsequent phosphorylation at Thr58 marks c-Myc proteins for
degradation (Dang, 2012). Ubiquitination and prolyl isomerization are especially important in
controlling c-Myc protein levels with E3 ubiquitin ligase components and other proteins to
decrease Myc stability, including Fbw7, Skp2, Fbx29, and PinI (Farrell and Sears, 2014; Thomas
Myc is phosphorylated at Thr58 and Ser62 to lead to dephosphorylation at Ser62. SCFFbw7 then
recognizes Myc phosphorylated only at T58 to label it for degradation by the 26S proteasome
(Farrell and Sears, 2014; Yeh et al., 2004). These processes limit c-Myc protein half-life to 15 to
20 minutes (Dang, 2012; Hann and Eisenman, 1984).
As an example of normal Myc function and regulation in cell growth and proliferation,
addition of growth factors or mitogens to quiescent cells activates signal transduction pathways,
such as the Wnt pathway and Raf/Mek/Erk kinase cascade (Dang, 2012; Kerkhoff et al., 1998), which can result in 10 - 40 fold increases in expression of Myc mRNA within three hours (Kelly
et al., 1983) and subsequent increases in Myc protein levels three to five hours after addition of
mitogen stimulation (Bretones et al., 2015, Waters et al., 1991). Myc activates expression of many
proteins involved in progression of the cell cycle, including cyclin dependent kinases (CDKs),
cyclins and E2F transcription factors (Bretones et al., 2015). For example, Myc induces expression
of cyclin D2 to advance the cell through the G 1 phase through activated cyclin D2/Cdk4 and cyclin
D2/Cdk6 (Bouchard et al., 2001; Malumbres and Barbacid, 2005). Additionally, Myc increases
expression of cyclin El, which activates cyclin E/Cdk2 in late G1 phase and leads to synthesis of
DNA (Perez-Roger et al., 1997), and promotes transcription of Cdk4 to regulate G1/S phase
transitions (Bretones et al., 2015; Hermeking et al., 2000). Myc activates transcription of
phosphatase Cdc25a (Galaktionov et. al., 1996), which is expressed during early GI phase to
activate CDKs (e.g. Cdk2, Cdk4) and cause cells to move through the GI phase (Zbrmig and Evan,
1996). Activation of CDKs in the G1 phase results in phosphorylation of retinoblastoma protein
to inactivate it and allows the cell to continue the cell cycle to S phase through the release of E2F
transcription factors (Nevins, 2001; Zrnig and Evan, 1996). Other examples of Myc's ability to
and p27 by repressing transcription of p21 - for example, by interacting with Miz-1 (M6r6y et al.,
2011) - and activating expression of SCFSIP2 ubiquitin ligase complex components to ubiquitinate
p27 to lead to its degradation (Bretones et al., 2011). Meanwhile, to promote cell growth, Myc
regulates enzymes involved in nucleotide production as well as enyzmes involved in glycolysis
and glutaminolysis that provide inputs for the tricarboxylic acid cycle, promotes production of
fatty acids and cholesterol for membrane production, and leads to production of ribosome
components and growth of mitochondria to fuel growing cells (Stine et al., 2015). When the
growth factor or mitogen is no longer present, or when cells reach confluence, c-Myc mRNA and
protein levels decrease rapidly due to their short half lives and aforementioned regulation (Dean
et al., 1986; Waters et al., 1991, Z6mig and Evan, 1996).
Cancers involving deregulated c-Myc activity are estimated to cause the deaths of 100,000
Americans and millions of people worldwide each year (Tansey, 2014). In most of these cancers,
c-Myc is overexpressed rather than mutated. Overexpression of c-Myc typically occurs through
changes in the MYC loci to increase c-Myc mRNA levels (gene amplification, translocations and
increased activation of distal enhancers) and aberrations that sabotage the regulatory mechanisms
of c-Myc (Pomerantz et al., 2009; Tansey, 2014; Wright et al., 2010). Super-enhancers, or large
clusters of enhancers that regulate genes associated with cell identity, can be found in the vicinity
of the Myc gene in tumor cells and vary in location with respect to the Myc gene depending on
cell type (e.g. upstream, within, and downstream of the Myc gene), but are not present in healthy
cells (Hnisz et al., 2013; Schuijers et al., 2018). Elevated levels of c-Myc drive overexpression of
its active target genes rather than upregulate a new group of targets (Lin et al., 2012). Aberrant
pathways, enhances growth, changes metabolic pathways, damages DNA, and promotes
angiogenesis for metastasis.
In fact, cancer cells with deregulated c-Myc are so transformed that they are "addicted" to
this oncogene and disruption of c-Myc can cause cancer cells to die through a phenomenon called
oncogene addiction (Tansey, 2014). As a proof of concept, the dominant negative Omomyc can
dimerize with Myc proteins, preventing Max from binding Myc (Soucek et al., 1998) and blocking
binding to E-box sequences on DNA (Soucek et al., 2002). In mouse models of lung cancer driven
by Kras G12D, expression of Omomyc decreased the counts of proliferating cells and caused
regression of both early-stage lung adenomas and established lung tumors (Soucek et al., 2008).
As Myc regulates proliferation for normal cells as well, side-effects on rapidly proliferating tissues
such as the skin, testes and gastrointestinal tract are a concern. However, restoration of Myc
function after 4 weeks of Myc inhibition resulted in recovery of these organs (Soucek et al., 2008).
Recently, purified Omomyc has also been shown to cross cell membranes of cancer cells to inhibit
Myc transcriptional activity. This discovery has translated into studies showing its efficacy in
mouse models of lung adenocarcinoma (Beaulieu et al., 2019). Additionally, conditional
transgenic mouse models have been used to show that Myc inactivation via doxycycline addition
can cause a variety of responses such as differentiation, apoptosis and senescence (Felsher, 2010).
The response of the tumors toward Myc inactivation was cell type-specific, ranging in responses
from differentiation with Myc inactivation and apoptosis after restoration of Myc in osteosarcoma
to apoptosis in lymphomas (Felsher, 2010). Outside of the tumor cell, Myc also served crucial
roles in maintenance of the tumor microenvironment in a RIP 1 -Tag2 mouse model, specifically
While Myc does not dimerize with bHLHLZ proteins other than Max, Max forms dimers
with a family of Mxd proteins and Mga (Conacci-Sorrell et al., 2014) (Figure 1.2). In contrast to
Myc, Max is constitutively expressed (Jiang et al., 2009), and regulation of its effects occurs
through these other binding partners. Through these other interactions, Max exists in a dynamic
equilibrium of protein-protein interactions in which the predominant dimers can influence the
effects on transcription of Myc target genes. For example, Myc/Max heterodimers can recruit
demethylases and histone acetyltransferases to mark chromatin for transactivation and allow RNA
polymerase II to bind the promoter. On the other hand, while Max is bound to Mxd proteins, this
alternative heterodimer form competes with Myc/Max heterodimers for E-box binding and recruits
histone deacetylases to repress transcription of Myc target genes (Poole and Van Riggelen, 2017).
Through a simplified version of the Max network, we can visualize various forms of Max dimers
proliferation growth arrest self-renewal differentiation N-Myc Max c-Myc Max Mxd3 L-Myc gMn E-Box
Figure 1.2. The Max network. Cartoon diagram of the Max (green) dimerization network
displaying transcriptional activation by the Myc (blue)/Max heterodimer, transcriptional attenuation by the Max/Max homodimer, and transcriptional attenuation and repression by other Max-containing dimers such as the Max/Mxd4 (purple) heterodimer (Conacci-Sorrell et al., 2014).
In 2002, James Darnell argued that targeting transcription factors overactive in human
cancers provides the most direct approach for therapeutics, as there are fewer possible targets and
multiple signaling pathways can converge on the same transcription factor (Darnell, 2002).
However, transcription factors like c-Myc lack enzymatic activity and have thus been dubbed
"undruggable." Unlike enzymes with known active sites, these proteins lack obvious binding
points and lack hydrophobic folds (Berg, 2008; McKeown and Bradner, 2014). Modulation of
transcription factors would instead require disruption of DNA-protein and protein-protein
interactions (PPI), but defined rules for discovering small molecule PPI disrupters do not yet exist
(Koehler, 2010). Thus, it has been challenging for the scientific community to build high-quality
chemical probes - that is, small molecules that specifically modulate a protein of interest to allow
interrogation of its function in vitro, in cells and/or in animals (Arrowsmith et al., 2015) - for Myc
and Max. In addition to providing an orthogonal tool to CRISPR and RNAi to study the roles of
proteins of interest, chemical probes have advantages in that they can rapidly and reversibly affect
the protein of interest, as well as easily provide tunable dose-responsive effects and temporal
information (Arrowsmith et al., 2015).
Myc-Max heterodimer disrupters
As Myc requires Max for DNA binding, many groups have focused on inhibiting the
Myc/Max interaction, which involves a large protein-protein interface between the two proteins
stretching an area of 3,206
A
2 (Nair & Burley, 2003). Using fluorescence resonance energy transfer (FRET) and enzyme-linked immunosorbent assays (ELISAs), compounds IIA6B 17 and IIA4B20were found to inhibit c-Myc/Max dimerization and were further shown to block Myc-dependent
oncogenic chicken embryo fibroblast transformation (Berg et al., 2002). Chemical changes to the
core of the molecule were made to improve specificity, leading to a small molecule library of 240
compounds, which was screened using an oncogenic transformation assay. Two small molecules,
II-A5B 12 (Mycmycin- 1) and II-A3B 16 (Mycmycin-2), were found to nearly completely inhibit
Myc-dependent oncogenic transformation at 20 ptM with specificity for Myc compared to Src or
10050-Cb, 10074-A4, 10074-G5, 10031-B8, 10075-G5, and 10058-F4 - which disrupted c-Myc/Max domain binding in yeast two-hybrid assays, inhibited growth of fibroblasts and c-Myc dependent
transcription (Yin et al., 2003). Of these seven compounds, four (10009-G9, 10050-C1O,
10074-A4 and 10058-F4) were tested in vivo and inhibited tumor growth in mice when Rat la-c-Myc cells
were pre-treated in vitro and then inoculated into nude mice (Yin et al., 2003). Janda and Vogt
discovered NY2267, NY2276, NY2279, and NY2280 from a library of mostly planar and aromatic
moieties via FRET and that these compounds inhibited Myc functions in chicken embryo fibroblast
assays (Xu et al., 2006). As c-Myc mediated transcription requires DNA binding, DNA binding
assays were used to screen libraries of 17,000 and ~1,400 compounds, leading to the discovery of
Mycrol, Mycro2 and Mycro3 (Berg, 2011). These compounds inhibited the c-Myc/Max
interaction, cell proliferation, transcription and oncogenic transformation (Kiessling et al., 2006).
More recently, sAJM589 was discovered via a protein-fragment complementation (PCA) assay.
This compound showed relatively potent effects on viable cell levels (IC5 0 of 1.9 piM in P493-6
cells without doxycycline), affected transcription in a manner consistent with Myc depletion, and
decreased Myc protein levels with treatment possibly due to increased ubiquitin-mediated
degradation (Choi et al., 2017). This brief review of inhibitors of the Myc/Max interaction does
not discuss all of the inhibitors discovered to date, but provides a sense of the significant effort put
in by the scientific community to disrupt this interaction and the types of mechanism-specific
0 0 N "fCO 2tBu N H H NHMe S02 o ci I B r /N C I Boo IIA6B 17 0 0 N' - CO2tBu BOc-N N H N 'COOH HN 2 Mycmycin- 1 02N N H 10009-G9 0 IIA4B20 N O CO 2tBu N H HN - 2 'CONHMe Boc N -/Mycmycin-2 clcl N 0 N
IN0
0-HN O2 N H HN50CN 10050CCI/ CI CI N HO 0 N 0 -10074-A4 O NK CI -N 0 1007 5-G5 NO2 N 0 N~ N HN 10074-G5 0 NH 10058-F4 0 o -02C 1003 1-B8 N HO N sAJM589N' 0 0 N N 101,O 0 0 tBuO 0 x HN, tBuO 0- HN, 0 0 NY2267 00 N 0 tBuO - HN, 0 NY2279 F F, ,, F 0 NN 0 '- N H N X Mycro 1 C I 0 0 NN 0 C~ - N HN N Mycro3 NY2276 00 N --y0 tBuO 0 HN 0 NY2280 F F,-, F N- N HN Mycro2 02N
/
NO H2N 0 KJ-Pyr-9However, many of the aforementioned small molecules failed to show efficacy in vivo. To
my knowledge, the first example of a Myc-Max interaction inhibitor to show efficacy in vivo
without first pre-treating the tumor cells came from the labs of Vogt and Janda (Hart et al., 2014).
From a fluorescence polarization screen and an assay to test the efficiency of Myc-induced
oncogenic transformation in chicken embryo fibroblasts, four small molecules were found to be
effective. Among these, KJ-Pyr-9 (Figure 1.3) had the highest solubility in water and became the
subject of further study. This molecule exhibited specificity for Myc and N-Myc compared to other
oncoproteins: v-Src, v-Jun and an H1047R mutant of phosphatidylinositol 3-kinase (P13K). In
P493-6 cells, an engineered B cell line with a Tet-off system for Myc, the compound inhibited
proliferation and downregulated expression of Myc-regulated genes. The compound also
suppressed the growth of a xenograft of MDA-MB-231 in mice given daily intraperitoneal
injections of 10 mg/kg, becoming the first Myc/Max disrupter to exhibit in vivo efficacy (Hart et
al., 2014). The potential of Myc/Max disrupters to display in vivo efficacy was also observed with
Mycro3, which increased cancer cell apoptosis, reduced cell proliferation and promoted tumor
shrinkage of mutant KRAS-driven pancreatic ductal adenocarcinoma when moribund mice were
treated with daily oral doses of 100 mg/kg Mycro3 (Stellas et al., 2014). Additionally, obstacles
delivering Myc/Max inhibitors were overcome when a prodrug version of 10058-F4 was
encapsulated in nanoparticles targeting integrin-expressing multiple myeloma cells (Soodgupta et
al., 2015). In this study, the use of a prodrug enabled stabilization and encapsulation of the drug in
the hydrophobic portion of the nanoparticles to prevent early release during delivery. The inhibitor
10058-F4 without nanoparticle-aided delivery did not provide improvements in survival of mice
and this study provided the first evidence that Myc/Max inhibitors previously limited by poor
Max-Max stabilization as an alternative method to inhibit Myc
As an alternative strategy to regulate Myc function, Vogt's group postulated that
stabilization of the Max homodimer could attenuate Myc-driven transcription by reducing the
amount of Max available to bind Myc and form Myc/Max heterodimers to mediate transcription.
Using virtual ligand screening on the full structures of Myc/Max and Max/Max dimers, they
identified three sites that contained 85% of the compounds predicted to bind Myc/Max and
Max/Max dimers. The compound NSC13728 (Figure 1.4) bound to the third binding site, which
provided specificity for Max/Max dimers over Myc/Max dimers compared to the other two binding
sites due to a binding site in the Max/Max dimer that is blocked by Max residues Arg 254 and Gln
261 in the Myc/Max heterodimer. Stabilization of the Max/Max homodimer by NSC 13728 was
reinforced by FRET and analytical ultracentrifugation observations. NSC 13728 was found to also
directly inhibit the Myc/Max interaction via co-immunoprecipitation, ELISA and surface plasmon
resonance (SPR) experiments. The compound decreased the proliferation of Q8 cells (a cell line
transformed by v-myc), inhibited Myc-mediated oncogenic transformation of chicken embryonic
fibroblasts (IC50 of 3 pM) and decreased Myc-mediated transcription in HEK293T cells (Jiang et
al., 2009). The discovery of this molecule suggested that stabilization of the Max homodimer could
indirectly attenuate Myc-driven transcription. Despite the success of this strategy to indirectly
inhibit Myc, this area of research has been understudied.
N N N N
Chapter 2: Discovery of a Max-binding small molecule that modulates
Myc-driven transcription via stabilization of the Max homodimer
Abstract
Due to the challenges in designing small molecules to bind intrinsically disordered
proteins, small molecule microarrays (SMMs) were used to screen a library of 45,000 compounds
for ability to bind purified recombinant Max. After specificity and purity filters, 16 compounds
were tested for inhibitive effects on Myc transcriptional activity. Of the 6 compounds with IC50
values less than 5 pM, KI-MS2-001 emerged as a lead compound with reasonable
physicochemical properties. Cursory structure-activity relationship (SAR) studies led to the
discovery of the analogue KI-MS2-008, which could be accessed through a simplified synthetic
pathway and had slightly more potent activity in Myc reporter and viable cell assays compared to
the original SMM hit. The SAR studies also led to the development of two analogues with
modifications that enabled target engagement experiments, which further suggested binding of the
compound to Max in both cell lysate and live cells. Target engagement to Max was also supported
by cellular thermal shift assays and NMR spectroscopy. In electrophoretic mobility shift assays
(EMSAs), analytical ultracentrifugation (AUC), and size exclusion chromatography (SEC),
This chapter reuses material from:
Nicholas B. Struntz*, Andrew Chen*, Anja Deutzmann, Robert M. Wilson, Eric Stefan, Helen L. Evans, Maricela A. Ramirez, Tong Liang, Francisco Caballero, Mattheus H. E. Wildschut, Dylan V. Neel, David B. Freeman, Marius S. Pop, Marie McConkey, Sandrine Muller, Brice H. Curtin, Hanna Tseng, Kristen R. Frombach, Vincent L. Butty, Stuart S. Levine, Clementine Feau, Sarah Elmiligy, Jiyoung A. Hong, Timothy A. Lewis, Amedeo Vetere, Paul A. Clemons, Scott E. Malstrom, Benjamin L. Ebert, Charles Y. Lin, Dean W. Felsher, Angela N. Koehler. "Stabilization of the Max homodimer with a small molecule attenuates Myc-driven transcription." Cell Chemical Biology, 26, 1 - 13, 2019.
* co-first authors
Contributions
A.N.K. performed the small molecule microarray screens. M.M. and B.L.E. performed the
secondary screen of Myc transcriptional activity. F.C. performed cellular assays for KI-MS2-001
analogues. E.S., H.L.E., B.H.C., and T.A.L. synthesized small molecules. M.S.P., D.B.F, and
B.H.C. analyzed NMR studies. N.B.S. performed target engagement studies with KI-MS2-085
and KI-MS2-008, and performed mechanistic studies involving Max/Max homodimer
stabilization. G. Guzman and M. Schenone performed mass spectrometry experiments associated
Introduction
As previously discussed, inhibition of transcription factors often involves disruption or
stabilization of protein-protein or protein-DNA interactions (Koehler, 2010). These interfaces are
typically large and lack obvious binding pockets from which small molecules could be designed
(McKeown and Bradner, 2014). Due to the challenges in small molecule design, our approach to
discovering small molecules with specific binding and functional properties involved
implementation of a critical path containing high-throughput screening assays coupled to
functional and mechanistic assays. We then synthesized analogues of lead compounds to
understand cursory structure-activity relationships, which enabled use of analogues for target
engagement studies validating binding of the lead compound to the target proteins in both in vitro
and cellular settings.
For a primary screen in this critical path, we used the small molecule microarray (SMM)
technology. These screens involve glass slides functionalized with up to 12,288 printed chemical
array features, enabling fast, robust screening of tens of thousands of small molecules (Figure
2. lA). For isocyanate-mediated attachment to the glass slide, the small molecule must contain a
reactive nucleophile such as an amine, hydroxyl, phenol, carboxyl, thiol, urea, hydroxamic acid or
amide (Casalena et al., 2012). Small molecules with multiple functional groups can be displayed
in multiple orientations, allowing many different binding orientations to be sampled for such small
molecules. In contrast to many of the other high-throughput screening approaches used to discover
inhibitors of the Myc/Max interaction, small molecule microarrays offer a mechanism-unbiased
approach, screening for small molecules capable of binding a target protein throughout its structure
In this study, a solution of purified recombinant Max protein was used to screen against
the compound library and SMM positives would be expected to bind to Max protein directly. The
small molecule microarray platform has also been used to study binding - whether direct or
indirect - to a protein of interest in cellular lysates (Bradner et al., 2006; Bradner et al., 2006). The
lysate-based strategy is expected to retain proteins in a more native state, as - especially often the
case with transcription factors - they may be more folded and structured when bound to their
usual binding partners. In this case, the small molecule could interact with the more folded and
structured version of the protein, but could also bind to nearby complex members (Bradner et al.,
2006; Vegas et al., 2008).
Since lead compounds were discovered to bind the target protein in an in vitro setting using
small molecule microarrays, additional studies should be completed to confirm that the compound
binds the target protein in more cellular settings. Additionally, since small molecule microarrays
could select compounds with a variety of mechanism of actions (MoAs), MoA studies will be
required to establish a high-quality chemical probe (Frye, 2010). While it may seem like a
disadvantage to use a mechanism-unbiased screening approach and be required to interrogate the
mechanism of action later, this property of the SMM can also be viewed as an advantage. The
simple and flexible nature of the SMM can cast a wider net compared to a mechanism-specific
assay such as FRET or PCA, allowing discovery of small molecules with favorable properties that
Results and discussion
Small molecule microarrays and Myc reporter assays led to the prioritization of KI-MS2-001 from a library of 45,000 compounds.
Previously, small molecule microarrays were used to screen a library of 15,252 compounds against 100 proteins that were diverse in terms of sequence and structure, and related to transcriptional regulation. These compounds included commercial compounds common in many chemical libraries (6,152 compounds), academic compounds created via diversity-oriented synthesis (6,623 compounds) and natural products (2,477 compounds). One of the 100 proteins screened was purified recombinant Max (Clemons et al., 2010). When combined with an additional screen against a library of compounds derived from diversity-oriented synthesis, a total of-45,000 compounds were screened against purified recombinant Max, yielding 117 putative Max binders (Figures 2.1B and 2.1C).
B C ~-;t--~ ~/ / 500 400 N 300 200 100 0-5.0 * Compound *Hit DMSO -2.5 25 5.0 7.5 Composite Z C 0 0 500 400 300 200 100 0 -5.0 Z Score C -1 0 Z Score A ~ Z Score C 4 -21 Z Score AZ o
Figure 2.1. Discovery of putative Max binders using small molecule microarrays. (A) Schematic
of a small molecule microarray (SMM) showing SMM positives (red spots), which were detected
by AlexaFluorTM 647-labeled antibodies against the His-tag on the purified Max protein. (B) SMM
screening results for DIV06 compound library, which is comprised mostly of products of diversity-oriented synthesis (n = 3 technical replicates). Histogram of composite Z-scores and 3D scatterplot
showing Z-scores of feature to background ratios in triplicate for compounds on the SMMs. (C) SMM screening results for NPC 'Natural Products and Commercials' compound library array set, which contains natural products and commercial 'drug-like' compounds (n = 3 technical
replicates). Histogram of composite Z scores and 3D scatterplot showing Z scores of feature to background ratios in triplicate for compounds on the SMMs.
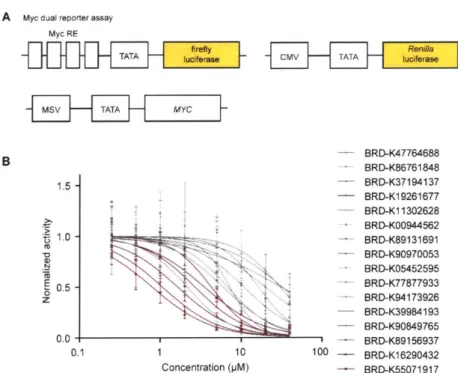
After prioritizing small molecule microarray positives specific to Max compared to the
other proteins screened against the same set of molecules and filtering out small molecules less
than 70% pure as measured by liquid chromatography - mass spectrometry (LCMS), 16
compounds were evaluated for their ability to inhibit Myc transcriptional activity in a dual
luciferase reporter. In this assay, tandem repeats of the Myc response element are located upstream
of firefly luciferase, while Renilla luciferase is constitutively expressed as a control. Thus,
* Compound Hit DMSO
A
-2.5 0.0 2.5 Composite Z 5.0 7.5 Afrom firefly luciferase to Renilla luciferase (Figure 2.2A). Using this reporter assay, we identified
six compounds that inhibited Myc transcriptional activity with an IC50 less than 5 piM (Figures
2.2B and 2.3A). Among these six compounds, the DOS polycyclic lactam BRD-K19261677
(KI-MS2-001) had one of the lowest IC50 values at 1.06 ptM, retained activity upon resynthesis and
exhibited reasonable physicochemical properties (Figures 2.3B and 2.7A). Overall, we prioritized
the small molecule KI-MS2-001 from a library of ~45,000 compounds (Figure 2.3C).
A Myc dual reporter assay Myc RE - BRD-K47764688 BRD-K86761848 1.5 - BRD-K37194137 - BRD-K19261677 - BRD-K11302628 -+1BRD-KO0944562 1.0 -BRD-K89131691 BRD-K90970053 a, 24 BRD-K05452595 S0.5 - BRD-K77877933 0 z BRD-K94173926 - BRD-K39984193 - BRD-K90849765 0.0 - BRD-K89156937 0.1 1 10 100 - BRD-K16290432 Concentration (pM) - BRD-K55071917
Figure 2.2. Prioritization of Max binders that modulate Myc-driven transcription. (A) Myc dual reporter assay design to filter SMM hits. (B) Dose-response curves of Myc-transcriptional activity for SMM positives after purity triage. Red curves correspond to the six compounds with IC5o values less than 5 pM (n = 3 technical replicates, error bars represent mean SD).
-41 A HO N N KI-MS2-001 BRD-K19261677 IC, = 1.06 pM: SMM CompZ = 3.54 cLogP = 5.15 N3 -OH OM HO N N N3 BRD-K55071917 IC50 = 2.68 pM: SMM CompZ = 3.81 cLogP = 2.38 Property KI-MS2-001 Mean protein >99.9 bound (%) Mean recovery 86 Solubility (PBS, pM) 9 Solubility (intestinal fluid. pM) 200 Solubility (gastric fluid, pM) 51.2 CACO-2 permeability 23.6 (10- cm/s) Efflux ratio (BA/AB) Liver microsome stability (min) NO U BRD-K371 94137 IC5 = 4.24 pM; SMM CompZ =4.14 cLog P = 6.79 O9~oH HH H N 0 N N N0 BRD-K16290432 IC5 0 =0.794 pM; SMM CompZ= 3.63 cLogP = 4.78 C Number of compounds HN3 BRD-K90849765 IC5 = 1.63 pM; SMM CompZ = 3.81 cLogP = 3.56 N3 0 HO O N NH2 N3 BRD-K89156937 IC5 = 3.48 pM: SMM CompZ = 4.26 cLogP = 2.25 Screening activity Criteria for advancement -45,000 primary Max SMM binding assay compZscore > 3.5
117 specificity filter vs. >100 proteins selective for Max evaluation of purity in DMSO stocks > 70% by LCMS
16 Myc reporter gene assay in dose IC5 < 5 pM
6 evaluation of physicochemical properties, potential reactivity, ease of synthesis
N 0
N- 0 N--- 0
BRD-K19261677 KI-MS2-008
(KI-MS2-001)
21
Figure 2.3. Prioritization of a lead compound from top hits. (A) Chemical structures for the 6
SMM hits against purified Max protein after dose-response Myc dual reporter assay. Blue side chains denote site of attachment to SMMs. cLogP values were calculated by ChemDraw Professional 15.0. (B) Experiments were conducted at Cerep. Fraction of the compound that is bound to proteins as determined by a protein binding assay that simulates human plasma, solubility of KI-MS2-001 in aqueous buffers, bidirectional permeability of KI-MS2-001, and liver microsome stability of KI-MS2-001. (C) Prioritization scheme for Max binders that modulate Myc-driven transcription leading to hit stock solution BRD-K19261677 (resynthesized as
KI-MS2-001) and KI-MS2-008 as a more potent and synthetically accessible probe.