Publisher’s version / Version de l'éditeur:
Vous avez des questions? Nous pouvons vous aider. Pour communiquer directement avec un auteur, consultez la première page de la revue dans laquelle son article a été publié afin de trouver ses coordonnées. Si vous n’arrivez pas à les repérer, communiquez avec nous à [email protected].
Questions? Contact the NRC Publications Archive team at
[email protected]. If you wish to email the authors directly, please see the first page of the publication for their contact information.
https://publications-cnrc.canada.ca/fra/droits
L’accès à ce site Web et l’utilisation de son contenu sont assujettis aux conditions présentées dans le site LISEZ CES CONDITIONS ATTENTIVEMENT AVANT D’UTILISER CE SITE WEB.
Proceedings of International Congress on Sound and Vibration: 02 July 2006, Vienna, Austria, pp. 1-8, 2006-07-02
READ THESE TERMS AND CONDITIONS CAREFULLY BEFORE USING THIS WEBSITE.
https://nrc-publications.canada.ca/eng/copyright
NRC Publications Archive Record / Notice des Archives des publications du CNRC :
https://nrc-publications.canada.ca/eng/view/object/?id=6823bf44-4ac7-4c2b-b682-918fe2b9fcea https://publications-cnrc.canada.ca/fra/voir/objet/?id=6823bf44-4ac7-4c2b-b682-918fe2b9fcea
NRC Publications Archive
Archives des publications du CNRC
This publication could be one of several versions: author’s original, accepted manuscript or the publisher’s version. / La version de cette publication peut être l’une des suivantes : la version prépublication de l’auteur, la version acceptée du manuscrit ou la version de l’éditeur.
Access and use of this website and the material on it are subject to the Terms and Conditions set forth at Bending wavenumber and associated damping
http://irc.nrc-cnrc.gc.ca
B e n d i n g w a v e n u m b e r a n d a s s o c i a t e d d a m p i n g
N R C C - 4 7 6 7 9
N i g h t i n g a l e , T . R . T . ; K i n g , F .
A version of this document is published in / Une version de ce document se trouve dans: Proceedings of International Congress on Sound and Vibration, Vienna, Austria, July 2-6, 2002-6, pp. 1-8
The material in this document is covered by the provisions of the Copyright Act, by Canadian laws, policies, regulations and international agreements. Such provisions serve to identify the information source and, in specific instances, to prohibit reproduction of materials without written permission. For more information visit http://laws.justice.gc.ca/en/showtdm/cs/C-42
Les renseignements dans ce document sont protégés par la Loi sur le droit d'auteur, par les lois, les politiques et les règlements du Canada et des accords internationaux. Ces dispositions permettent d'identifier la source de l'information et, dans certains cas, d'interdire la copie de documents sans permission écrite. Pour obtenir de plus amples renseignements : http://lois.justice.gc.ca/fr/showtdm/cs/C-42
Eds.: J. Eberhardsteiner, H.A. Mang, H. Waubke
BENDING WAVENUMBER AND ASSOCIATED DAMPING
T.R.T. Nightingale*, Frances King
National Research Council Canada, Institute for Research in Construction, Acoustics Laboratory, 1200 Montreal Road, Ottawa, Ontario, K1A 0R6, Canada.
Abstract
This paper outlines and evaluates a non-destructive experimental technique used to obtain in-situ measures of the real part of the bending wavenumber in the two principal directions of a wood joist floor. Measurements confirm the highly orthotropic nature when the floor is bare, without topping. Wavenumbers in the direction parallel to the joists are a function of location between the joists. Lower wavenumbers in this direction can be expected closer to the joists. A floor topping is shown to significantly modify the wavenumbers in the exposed surface; with a topping, the floor is less orthotropic. Changes in measured wavenumbers due to adding a topping are shown to correlate well with the changes in vibration
distribution and rates of structure borne attenuation. Finally, measured wavenumbers and vibration levels are combined to obtain with theory to obtain an estimate of the loss factor that agrees well with that measured by the power injection method.
INTRODUCTION
The paper begins by providing a brief overview of measuring wavenumbers using the draw-away approach[1]. Measured wavenumbers for the floor, with and without a topping, are compared to assess the effect a topping has on the vibration response of a wood joist floor. Changes in the measured wavenumbers are then compared to vibration mappings of the floor to show the correlation between wavenumbers and vibration gradients. Finally, measured wavenumbers, and vibration mapping results are combined with the necessary theory to obtain estimates of the loss factor using a modified intensity relation.
Using the draw-away approach, an estimate of the real part of the bending wavenumber is obtained from the slope of the best-fit line of measured phase change between a reference accelerometer near a point source and a field accelerometer that
T. Nightingale, and F. King
is systematically moved away from the source,
( )
dr d k e B = φ ℜ Eqn. 1The phase angle between the field and reference accelerometers (PCB 352C33) is obtained from a cross-spectrum analyzer (B&K 2144). There is no need to correct for phase mismatch between the measurement channels and the near field at the reference point. The phase mismatch is constant for all measurements, and does not affect the slope of the best-fit line (estimate of the wavenumber), only the intercept.
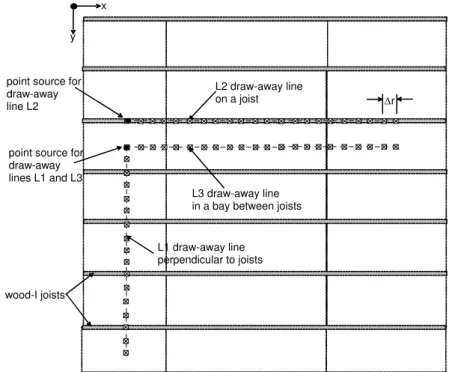
The difficulty of the approach is that the phase has to be “unwrapped” because the phase of the cross-spectrum is always in the principal branch of the arctangent function. However, by selecting a series of closely spaced measurement positions, as shown in Figure 1, it is possible to track the incremental increase in phase between consecutive points. The spacing between measurement points must be less than a half wavelength to unequivocally interpret “wrapping”.
point source for draw-away lines L1 and L3 L2 draw-away line on a joist L1 draw-away line perpendicular to joists Δr wood-I joists point source for draw-away line L2
x
y
L3 draw-away line in a bay between joists
Figure 1: Sketch showing the layout of the three draw-away lines to estimate the change in phase with distance.
MEASURED WAVENUMBERS
This section presents wavenumber data for the two principal directions of the wood joist floor shown in Figure 1 when the floor is bare and when a topping is applied. The bare floor consisted of 1.21 x 2.42 x 0.018 m sheets of oriented strand board (OSB) applied with the long axis at right angles to 305 mm deep wood I-beam joists spaced 406 mm on center. The gypsum board ceiling was attached to the bottom of the joists via resilient channels spaced 610 mm on center. To this floor three toppings were systematically added. First was 25mm gypsum concrete on a
ICSV13, July 2-6, 2006, Vienna, Austria
resilient interlayer, second was 25mm gypsum concrete applied directly to the OSB, third was a gypsum fiber board raft applied over the OSB but without mechanical connection. Details of these constructions can be found elsewhere[2].
The bare floor is assumed orthotropic. Parallel to the joists, one would expect the effective stiffness to increase as the line defined by the field points and source is moved toward a joist, with the maximum occurring immediately above a joist and the minimum midway between two joists. To test this hypothesis two draw-away lines were measured parallel to the joists – one immediately on top of a joist and the second midway between the joists, as shown in Figure 1. A third draw-away line was oriented perpendicular to the joists.
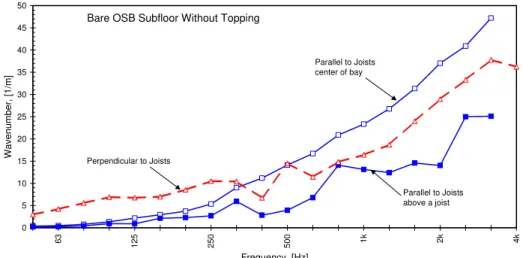
Figure 2 compares the measured in-situ wavenumbers along the three draw-away lines. Perhaps it is most interesting to compare the wavenumbers for the direction perpendicular to the joists (draw-away line L1) with those parallel to the
joists and midway between the joists (draw-away line L3). Of particular interest is
the fact that the two wavenumber curves cross, indicating that in the frequency range (315 to 500 Hz) around the crossing point the floor might be effectively isotropic because of the similarity in the OSB wavenumbers in the x and y-principal directions.
Above about 500 Hz in the direction parallel to the joists, the OSB wavenumber between the joists is higher than in the direction perpendicular to the joists indicating that the bending stiffness of the OSB is lower in the direction parallel to the joists than perpendicular. This is fully consistent with OSB panels having a Young’s modulus (and stiffness) that is greater in the long axis of the panel which is oriented perpendicular to the joists when installed on a framed floor. Below about 315 Hz (frequency of first OSB sub-panel cross-mode), the wavenumber is greater in the direction perpendicular to the joists than in the direction parallel to the joists. This indicates that below about 315 Hz the stiffness of the OSB is now greater in the direction parallel to the joists than perpendicular. Also, the wavenumber measured in the bay tends to converge to the wavenumber measured on the joist as the frequency decreases indicating that below the first cross mode of the OSB sheathing the stiffness parallel to the joists is significantly affected by the joists.
Figure 3 shows the wavenumbers measured parallel and perpendicular to the joists but when the floor has a topping. It is evident that a topping modifies the vibration response (and hence wavenumbers) of the exposed surface. There are three important things to notice. First, with an applied topping the wavenumbers of the exposed surface are similar in the two orthogonal directions (parallel and perpendicular to the joists), for frequencies above about 200 Hz. The floor appears considerably less orthotropic than the bare floor. Second, below about 200 Hz the measured wavenumbers indicate the floor is still orthotropic. Here the wavenumbers parallel to the joists are controlled by the joists as they were for the bare floor. Third, the gypsum fiberboard raft (formed from two 12.7mm plies secured together by a viscoelastic material and staples spaced 200mm on centre) exhibited the largest wavenumbers of all the toppings (because it is the least stiff). While the bonded 25mm gypsum concrete exhibited the lowest (because it was the most stiff).
T. Nightingale, and F. King
Bare OSB Subfloor Without Topping
0 5 10 15 20 25 30 35 40 45 50 63 125 250 500 1k 2k 4k Frequency, [Hz] Wavenumber, [1/m] Parallel to Joists center of bay Parallel to Joists above a joist Perpendicular to Joists
Figure 2: Estimates of the in-situ wavenumber for the direction perpendicular to the joists, ky, using draw-away line L1 and parallel to the joists, kx, using draw-away lines L2 and L3.
Floor With Indicated Topping
0 5 10 15 20 25 30 35 40 45 50 63 125 250 500 1k 2k 4k Frequency, [Hz] Wavenum ber, [ 1/ m ] Gypsum-Fiberboard Raft Floating Gypsum-Concrete Bonded Gypsum-Concrete Perpendicular to Joists Parallel to Joists
Figure 3: Estimates of the in-situ wavenumber for floor with the indicated topping in the direction perpendicular to the joists, ky, using draw-away line L1 and parallel to the joists,
kx, using draw-away line L3.
VIBRATION MAPS
In this section, vibration maps of the floor with and without a topping are compared to assess the effect a topping has on the distribution of vibration energy. These changes are qualitatively related to the change in wavenumber.
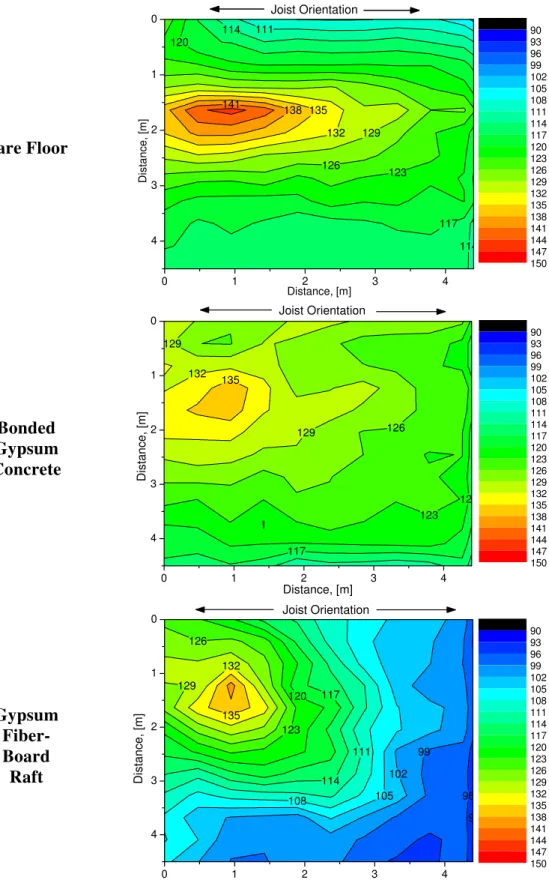
Figure 4 (top) shows the vibration response of the bare floor (i.e., without a topping) at 1kHz when excited by the point source used for wavenumber measurements. The mapping clearly shows the orthotropic nature of the floor – contours of equal acceleration are not circular. Instead, they are more elliptical with the long axis parallel to the joists implying there is considerably less propagation attenuation parallel to the joists than perpendicular to the joists.
ICSV13, July 2-6, 2006, Vienna, Austria Bare Floor 120 123 117 126 129 132 114 135 111 114 1 138 141 0 1 2 3 4 4 3 2 1 0 Joist Orientation Distance, [m] D ist a n ce , [ m ] 90 93 96 99 102 105 108 111 114 117 120 123 126 129 132 135 138 141 144 147 150 Bonded Gypsum Concrete 129 126 123 12 117 132 129 135 0 1 2 3 4 4 3 2 1 0 Joist Orientation Distance, [m] Dista nce, [m] 90 93 96 99 102 105 108 111 114 117 120 123 126 129 132 135 138 141 144 147 150 Gypsum Fiber-Board Raft 123 120 117 114 111 108 105 102 99 126 129 96 9 132 135 0 1 2 3 4 4 3 2 1 0 Joist Orientation Distance, [m] D ist ance, [ m ] 90 93 96 99 102 105 108 111 114 117 120 123 126 129 132 135 138 141 144 147 150
Figure 4: Contour map of measured acceleration level (dB arb.) at 1kHz for the wood joist floor with the indicated topping, if present. A point source is located at (0.85,1.44) m.
T. Nightingale, and F. King
Figure 4 (middle) shows that with a bonded 25mm thick gypsum concrete topping, vibration levels become considerably more uniform and the propagation attenuation (change in vibration level with distance from the point source) is considerably reduced for both directions parallel and perpendicular to the joists.
Figure 4 (bottom) shows the vibration response for 25mm thick gypsum fiberboard raft. Here the contours most closely resemble circles centred about the source. Compared to the gypsum concrete topping, the rate of propagation attenuation is considerably greater in the gypsum fiber-board raft, and is attributed to two factors: increased internal loss factor due to the viscoelastic material between the two plies, and large wavenumber. As shown in the next section, propagation attenuation is a function of the product of the wavenumber and loss factor.
The figures have shown that the vibration response of the exposed surface of a floor can be significantly modified by adding a topping. Not only will the space average levels change (typically they will decrease) but the rates of propagation attenuation parallel and perpendicular to the joists will change, too. The general trend is that with a topping the rate of attenuation parallel and perpendicular to the joists will be more similar than for the bare floor.
ESTIMATING THE LOSS FACTOR
In this section, the measured wavenumbers and the vibration mappings are used to obtain estimates of the loss factor for the floor.
Consider a point source exciting an orthotropic plate. Suppose that we know the displacement at all points on this plate and that the wavenumbers in the two principal directions are known, too. We can then apply the intensity relation to estimate the loss factor of the plate. Define two contours that completely enclose the point source such that all points on that contour have the same phase. In other words define contours r1 and r2 such that
( ) ( )
θ r1 θ =φ1kB and kB
( ) ( )
θ r2 θ =φ2 Eqn. 2 where φ1 < φ2, and are constants for angles, . This immediately implies that thecontours r1 and r2 must be inversely proportional to the slowness contour which is
defined as the kB
( )
θ /ω. If we select φ1 and φ2 to be greater than one, the effect ofthe near field can be avoided. The power, Π, flowing across the contours is given by
(
I1 n1)
r1( )
θ dθ 1 =∫
⋅ˆΠ r and Π2 =
∫
(
Ir2⋅nˆ2)
r2( )
θ dθ Eqn. 3where is the unit normal to the contour of integration. In the limit that there are no losses there must be conservation of energy so the power injected is equal to the power through the two contours;
nˆ
2 1=Π
Π =
Πinjected , but we are interested in the case where there are internal losses so this will not hold. Instead, we need to write[3],
2 2 2 1 2 1η φη φ e e injected =Π =Π Π Eqn. 4
ICSV13, July 2-6, 2006, Vienna, Austria
where is the loss factor. Equating the expressions and solving for gives,
⎟⎟ ⎠ ⎞ ⎜⎜ ⎝ ⎛ Π Π ⎟ ⎠ ⎞ ⎜ ⎝ ⎛ − = 2 1 1 2 log log 2 1 e φ φ η Eqn. 5
In the limit that the plate is isotropic, the wavenumber and contour of integration are no longer angular dependent because they are constants, and the direction of power flow is radial i.e., normal to a circle centred at the source. This allows for simplification, and after some manipulation gives,
(
)
⎟⎟ ⎠ ⎞ ⎜ ⎜ ⎝ ⎛ − = 2 2 2 1 2 1 1 2 log log 2 r v r v e r r kB η Eqn. 6Letting r1 and r2 be large, such that the wave front approximates that of a plane wave,
gives the result often in textbooks[4],
(
)
⎟⎟ ⎠ ⎞ ⎜ ⎜ ⎝ ⎛ − = 2 2 2 1 1 2 log 6 . 13 10 v v r r λ η Eqn. 7To implement the approach one must know the angular dependent wavenumber as this defines the slowness (and integration) contour. Estimates can be obtained from measures in the two principal directions (parallel and perpendicular to the joists). Vibration levels along the contours of integration are generally found through interpolation of vibration levels measured on a regular grid (like those used to generate the maps above). With these input data it is possible to evaluate Eqn. 5 to obtain an estimate of the loss factor.
Figure 5 shows the loss factor for the wood joist floor with a bonded 25mm gypsum-concrete topping measured using the power injection method[5] and using the wavenumber method described above. In general, the agreement is good.
Bonded Gypsum-Concrete 0.00 0.05 0.10 0.15 0.20 125 250 500 1k 2k 4k Frequency, [Hz] Loss Factor, [-]
Power Injection Method
Estimate from Wavenumbers and Vibration Mapping
Figure 5: Loss factor of the floor with the bonded gypsum concrete topping measured using the wavenumber method (described above) and power injection method.
T. Nightingale, and F. King
DISCUSSION AND CONCLUSIONS
Wavenumber measurements along draw-away lines parallel and perpendicular to the joists confirmed the highly orthotropic nature of a wood joist floor. Stiffness in the direction parallel to the joists is partially determined by the complex interaction of the OSB floor sheathing and the joists. Below the cut-on frequency of the first cross mode, the joists significantly affect the stiffness of the OSB floor sheathing parallel to the joists. Above the frequency of the first cross mode, the effect of the joists is significantly reduced and as the bending wavelength becomes much smaller than the joist spacing, the wavenumber (and bending stiffness) approaches that of the OSB floor sheathing in isolation[1]. Wavenumbers in the direction parallel to the joists also approached those measured on OSB in isolation[1].
Measurements on the exposed surface of the floor having a topping suggest that both bonded and floating toppings can significantly modify the vibration response. The toppings examined make the floor less orthotropic and for frequencies above about 200 Hz the floor appears essentially isotropic. Below this frequency, the floor appears orthotropic – significantly stiffer parallel to the joists.
In addition to making the floor more isotropic, the bonded gypsum concrete topping also significantly reduced the wavenumber relative to that measured on the bare OSB perpendicular to the joists and parallel to the joists but in the sub-panel bay. Whereas, a raft formed from gypsum fiberboard increased the wavenumber.
The rate of structure borne attenuation across the floor surface is proportional to the product of the wavenumber and internal loss factor. This allows the loss factor of an orthotropic floor to be obtained using a modified intensity relation developed here. Comparison of the change in wavenumbers and vibration distribution due to adding a topping suggests that the most effective toppings for controlling flanking transmission will have a high wavenumber and high internal loss factor so that propagation attenuation is maximized.
REFERENCES
1 Nightingale, T.R.T.; Halliwell, R.E.; Pernica, G. "Estimating in-situ material properties of a wood joist floor: Part 1 - Measurements of the real part of bending wavenumber and modulus of elasticity,"
Building Acoustics, 11, (3), September, pp. 175-196, 2004.
2 Nightingale, T.R.T.; Quirt, J.D.; King, F.; Halliwell, R.E., “Flanking Transmission in Multi-Family Dwellings: Phase IV”, Research Report, Institute for Research in Construction, National Research Council Canada, 218, pp. 425, March 01, 2006
3 Lyon, Richard, H., DeJong, Richard, G., “Theory and application of statistical energy analysis,” RH Lyon Corp. Cambridge, MA, USA, Second edition 1998.
4 Cremer, L., Heckl, M., “Structure borne sound,” Springer Verlag, Berlin, Second edition 1998.
5 Bies.D.A., Hamid, S., “In-situ determination of loss and coupling loss factors by the power injection method,” Journal of Sound and Vibration, Vol. 70 pp. 187-204, 1980.
![Figure 5 shows the loss factor for the wood joist floor with a bonded 25mm gypsum-concrete topping measured using the power injection method[ 5 ] and using the wavenumber method described above](https://thumb-eu.123doks.com/thumbv2/123doknet/14177601.475619/9.892.182.712.756.1017/figure-factor-concrete-topping-measured-injection-wavenumber-described.webp)
