Publisher’s version / Version de l'éditeur:
12th International Conference on the Physics and Chemistry of Ice, 2010-09-05
READ THESE TERMS AND CONDITIONS CAREFULLY BEFORE USING THIS WEBSITE. https://nrc-publications.canada.ca/eng/copyright
Vous avez des questions? Nous pouvons vous aider. Pour communiquer directement avec un auteur, consultez la
première page de la revue dans laquelle son article a été publié afin de trouver ses coordonnées. Si vous n’arrivez pas à les repérer, communiquez avec nous à [email protected].
Questions? Contact the NRC Publications Archive team at
[email protected]. If you wish to email the authors directly, please see the first page of the publication for their contact information.
NRC Publications Archive
Archives des publications du CNRC
This publication could be one of several versions: author’s original, accepted manuscript or the publisher’s version. / La version de cette publication peut être l’une des suivantes : la version prépublication de l’auteur, la version acceptée du manuscrit ou la version de l’éditeur.
Access and use of this website and the material on it are subject to the Terms and Conditions set forth at
Liquid/solid jets from ice crushing experiments and implications for
plumes on enceladus
Gagnon, Robert
https://publications-cnrc.canada.ca/fra/droits
L’accès à ce site Web et l’utilisation de son contenu sont assujettis aux conditions présentées dans le site LISEZ CES CONDITIONS ATTENTIVEMENT AVANT D’UTILISER CE SITE WEB.
NRC Publications Record / Notice d'Archives des publications de CNRC:
https://nrc-publications.canada.ca/eng/view/object/?id=4beb3576-9136-47c7-ac37-9e3e4f150259 https://publications-cnrc.canada.ca/fra/voir/objet/?id=4beb3576-9136-47c7-ac37-9e3e4f150259
Liquid/Solid Jets from Ice Crushing Experiments
and Implications for Plumes on Enceladus
Robert Gagnon
Institute for Ocean Technology, National Research Council of Canada, St. John's, NL, Canada, A1B 3T5 E-mail: [email protected]
High-speed imaging (30,000 images/s) has been used to observe the behavior of freshwater ice during crushing at –10˚C. The ice contact zone consisted of an intact high-pressure central area surrounded by pulverized spall debris and partially refrozen melt. The removal of ice from the intact ice zone occurred through the viscous radial flow of a pressurized thin layer of melt. A sawtooth pattern was evident in the load record, due to spalling behavior. The movement of the platen and ice towards each other was intermittent, that is, slow on the ascending side of a sawtooth and very rapid on the descending side. Liquid was produced at the platen/ice interface during both the slow and rapid movements and was observed to create rapidly moving jets of ice and liquid (up to 40 m/s) emanating from the periphery of the contact zone during the load drops. The Saturnian moon Enceladus is an intriguing body consisting largely of water ice that exhibits great tectonic behavior in some areas, known as tiger stripes, and has been observed to eject plumes of water vapour and ice crystals from faults in these regions. The ice crushing mechanisms described here could occur when warm ice prominences, on opposing walls of open fissures in the upper regions of faults, crush against each other during the interfacial sliding events that are known to occur throughout the diurnal tidal stress cycle. This may contribute to the plumes through generation of liquid and warm ice that act as sources of water vapour that escapes from the moon. Furthermore, the liquid/solid ejecta itself may be jettisoned directly out of the fissures, upwards from the moon’s surface to significant altitude, possibly even at escape velocity. Some ice-ice interaction scenarios at the sliding ice interfaces of faults in the tiger stripes region are proposed that may generate ice crushing conditions similar to those in the experiments reported here.
1. INTRODUCTION
Ice crushing and indentation has been studied intensively over the past few decades. Some characteristics of the ice behavior recur during field and lab studies and at various scales1. High pressures have been observed on so-called ‘hard spots’ of relatively intact ice and the rapid production and flow of melt in these areas has also been documented. Another interesting aspect has been the apparent cyclic sawtooth pattern in load that has been described frequently and attributed to spalling behavior1. Aspects of the sawtooth patterns, such as their regularity, have only recently been addressed in detail in the literature2 and explanations for the size of spalls, and the associated magnitude of the load drops, have been offered. These were based on observations of ice crushing behavior from images acquired at very high speed (30,000 images per second). A summary is provided here.
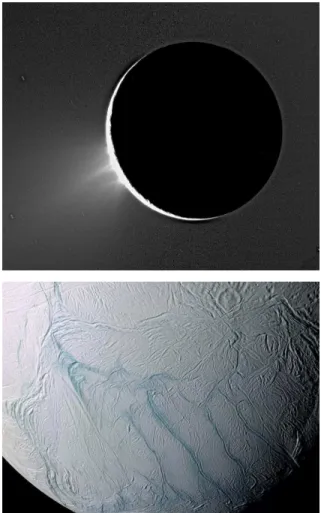
The Saturnian moon Enceladus has been observed to be ejecting water vapour and ice crystals (Fig. 1,
top) from a region of its surface, called tiger stripes, where significant tectonic activity is happening (Fig. 1, bottom). The tiger stripes are significantly warmer than the surrounding ice3 and it has been suggested that even much higher temperature ice exits at depths in the fissures either due to frictional heating of the ice or warm liquid water below the ice. Since there is tectonic activity, there must be considerable grinding and crushing at the opposing walls of fissures and crevasses in this region. Based on the observations of liquid/solid water jets in the present crushing experiments it seems reasonable to imagine similar jetting behavior happening during ice-ice crushing within warm crevasses and fissures on Enceladus and that some of the ejected material would have the preferred direction and velocity to be ejected upward away from the moon’s surface to a significant altitude, and possibly even at escape velocity.
2. METHODS
Fig. 2 shows the test setup, where the ice, confined in a rigid holder, is pressed against a transparent
PlexiglasTM crushing platen (5 cm thickness) in a testing frame as high-speed images are acquired from the opposite side of the platen. The ice sample was mono-crystalline with the c-axis oriented vertically. The specimen was initially a block 13 cm x 13 cm x 10 cm with the top trimmed to the shape of a truncated pyramid with a slope of about 40o. Details of the procedure for preparing the ice specimen and mounting it in the ice holder have been given before4. A single crystal was used primarily to avoid intergranular cracking that would normally obscure visual observations. The ice holder has been described before and the method of growing large single crystals4. The test
was carried out at –10oC and the actuator was moving at a nominal rate of 32 mm/s. The load data for the test were acquired at 20,000 samples per second.
3. RESUTS AND DISCUSSION
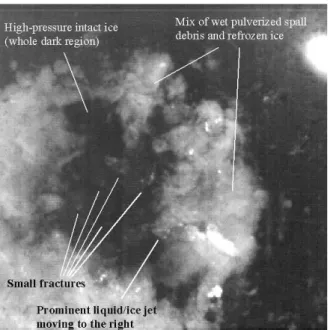
Fig. 3 shows an image acquired during the crushing test. The figure is annotated to illustrate features of the ice behavior to assist the reader in understanding the discussion that follows. The region of the image showing white material surrounding a central dark region corresponds to the area of contact where the top of the pyramid-shaped ice sample is being crushed against the Plexiglas crushing platen.
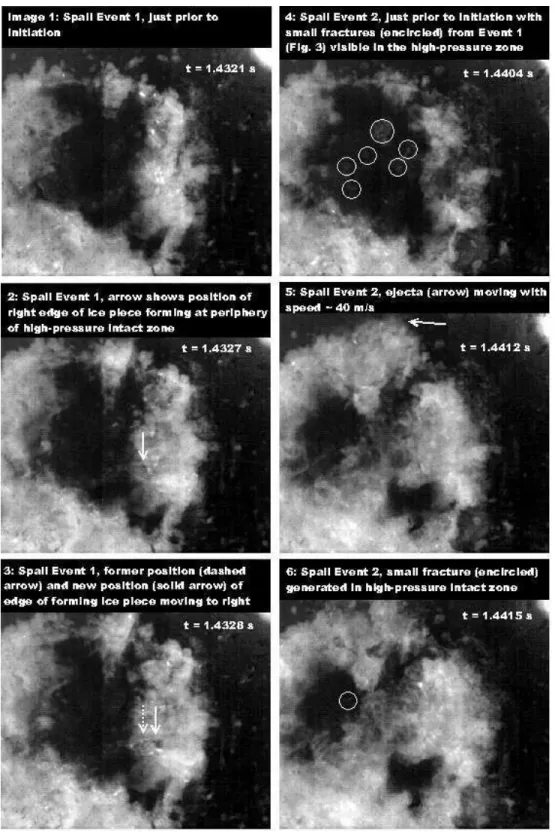
Fig. 4 shows 12 images from a portion of the high-speed video record of the test. The camera (Fastcam-APX RS) was running at a capture rate of 30,000 images per second and each image was 256 x 256 pixels in size. The images run from the top left to the bottom right of the figure and are not consecutive but rather were chosen to show relevant features of the ice behavior. The particular Fig. 1. (Top) Plumes of water vapour and
ice crystals emanating from the surface of the Saturnian moon Enceladus; (Bottom) tiger stripes area on Enceladus where the
plumes originate. (Courtesy
NASA/JPL/Space Science Institute)
Fig. 2. Crushing apparatus with camera for
viewing the contact zone during
locations of the images in the time series of the load record of the test are shown in Fig. 5. The oscillating pattern in the load record between the load drops is elastic resonance in the ice/apparatus system.
The first image shows the ice contact just prior to a spall event, (i.e. designated Spall Event 1). The dark irregular shape somewhat to the left of center shows the region of ice / crushing platen contact where the ice is essentially intact and where the pressure is high (roughly 70 MPa usually and apparently higher at the onset of spalling events4). Surrounding this is white material that is a mix of pulverized spall debris and partially refrozen melt from earlier in the test. The melt was created in the high-pressure region by a process that has been described before4. Essentially a thin layer of liquid, on the order of several microns thick, flows under pressure radially out of the high-pressure zone and this generates heat that causes melting and more liquid flow. The flow rate is much faster during the load drops than on the ascending portions of the sawtooth load pattern. While the nominal speed of the crushing platen towards the ice is 32 mm/s, the maximum actual relative speeds of the ice moving towards the platen during periods when load increases and at load drops are around 0.019 m/s and 0.3 m/s respectively, due to the compliance of the ice/apparatus system (1.4x10⁻⁸ m/N). The rapid exit and refreezing of melt is particularly evident in the form of a liquid/ice jet indicated in the figure. In this case, the velocity of the thin layer of ice produced indicates a lower-limit estimate for the liquid flow rate that produced the ice of about 15 m/s during the load drop. The thin piece of ice forming and moving to the right in Images 2 and 3 of Fig. 4 was used for the velocity estimate. The fully-formed piece is visible in Fig. 3 at the left of the bright elongated feature in the lower right of the image. Later in the high-speed image record the flat piece of ice was observed to be extremely thin (on the order of one image pixel, corresponding to ~ 0.17 mm) after it had rotated somewhat to give an edge-on view while moving to the right. The image in Fig. 3 occurred shortly after Images 2 and 3 of Fig. 4, as indicated on the load record (Fig. 5). It shows the formation of small stable cracks in the dark intact ice zone and the further production of fresh white material around the periphery of the dark zone due to the rapid exit of refreezing liquid and pulverization of the new spalls. Note that the
pulverized material in the general vicinity to the right of the forming ice piece had the same velocity at the time the velocity measurement was made for the ice piece.
The rapid melt and fluid flow stops at the end of the spall event and bottom of the load drop. Further relatively slow melting and flow continues to occur during the ascending portion of the following load sawtooth, thereby expanding the intact ice contact area, as seen in Image 4 just prior to the next spall event. The small stable cracks in the intact ice region, shown in Fig. 3, are still visible in Image 4. The next load drop is precipitated by the second spalling event, shown in Image 5, where portions of ice at the top, bottom and to the lower right of the main intact ice zone have broken away and shattered. It can be seen how the locations of the prior small stable cracks have influenced the shapes of the ice pieces that broke away, that is, they served as nucleation sites for the initial fractures. Three regions of remaining intact ice are present after Spall Event 2. From this sequence of events we can surmise that the seeds of a spalling event (i.e. the small cracks) are planted in the previous spalling event and possibly earlier ones. The measured velocity of the ejecta at the top of Image 5 (arrow) yielded an even higher lower-limit of fluid/ice flow speed (about 40 m/s) at load
Fig. 3. Image from the high-speed video record indicating various aspects of the ice behavior. The image is 43 mm wide. (From Gagnon[2])
Fig. 4. Annotated images from the high-speed video record indicating various aspects of the ice behavior during four consecutive spalling events. The arrow in images 2 and 3 is a marker that follows the edge of a freshly-freezing thin piece of ice as it forms and moves to the right. Fig. 5 shows the corresponding points in time on the load record for the images. (From Gagnon[2])
drops, that is, if we assume the outer peripheral ejecta velocity was similar to the liquid flow rate at the periphery of the intact ice region, as implied from the previous velocity measurement. This was the highest ejecta velocity observed in the test. An actual velocity measurement of ice forming at the periphery of the intact ice zone could not be made in this case due to lighting aspects and the limited quality of the images. Image 6 was acquired shortly after, near the bottom of the drop in load. A small stable crack has formed in the intact zone.
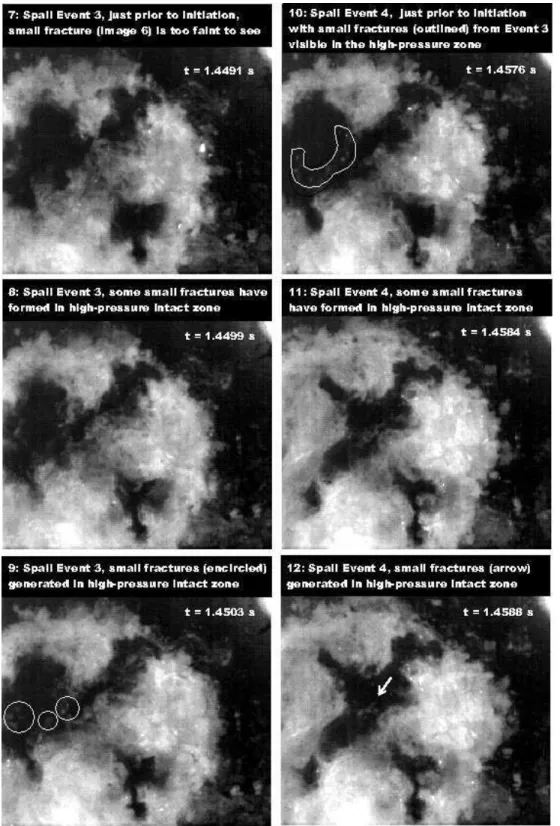
Image 7 shows the situation just prior to the third spalling event and associated load drop where the intact ice contact area has expanded, as we saw in the case of the previous spalling event. Images 8 and 9 show the third spalling event in process where pieces have broken away from the intact ice region and where small fractures have occurred in the intact ice zone as before. In Image 8 we can see spalling that initiated in the vicinity of the small crack shown in Image 6. Image 10 shows the situation just prior to the fourth spalling event where again we see the intact ice contact area has expanded and the small stable cracks in the intact ice are still visible. Images 11 and 12 show the fourth spalling event in process where, as before, pieces have broken away from the intact ice region
and small fractures have occurred in the intact ice zone.
We have shown four spalling events in Fig. 4 to assist the reader in appreciating the repetitive sequence of events that constitute a sawtooth in the load record.
The regularity of the sawtooth load pattern appears to stem from two effects associated with the small fractures: 1. The stable fractures are roughly the same size regardless of the size of the load sawtooth or load drop. That is, they seem to be regulated by the stress in the ice during the load drop when the cracks are created rather than by the total load. 2. The cracks occur in the approximate center of the remaining intact ice during a load drop because there is little or no liquid flow and melt there and consequently the ice experiences more compressive stress than in the peripheral regions where ice is removed by melting due to the viscous flow of the liquid layer. Hence, when a spall occurs its nucleation point and ultimate shape are determined from the position and distribution of the cracks created during the previous load drop, and the spalling roughly reduces the initial intact ice contact area by one half. The drop in load due to the spall is consequently half the peak load on the sawtooth just prior to the spall event. The spalling initiates when the stress in the area where the small Fig. 5. Load record for the test shown in Fig. 4 with markers (open circles) corresponding to the twelve images. The oscillating pattern in the load record between the load drops is elastic resonance in the ice/apparatus system. (From Gagnon[2])
fractures reside reaches a value to make the fractures propagate. The consequence is that the magnitude of the rise in load on a sawtooth following a spalling and load drop event is not arbitrary but determined by the stress required to start the small fractures propagating.
The energy balance of the situation during a load drop event is such that sufficient mechanical energy is absorbed by the actual volume of ice removed from the high-pressure zone (i.e. pressure times the volume) during the process to imply that on leaving the zone at the periphery about 20% of the ejecta is liquid and the rest is presumably very tiny refrozen ice particles. This is why much of the material surrounding the periphery has a pasty texture in appearance. The pressure decreases radially from the center of the contact zone and the
corresponding degree of melt temperature
depression would also be diminishing. The elevation of the melt temperature as the distance from the center increases leads to the freezing of super-cooled liquid that was stable at higher pressure when nearer the center. Presumably the entrainment of ice particles in the liquid layer flow would increase its viscosity. In the description of squeeze films, discussed below, the flow speed of the liquid layer can still be high even if the viscosity is elevated by the presence of a fraction of ice particles. For example if we strongly elevate the viscosity of the liquid/ice particle layer by a factor of 3, due to the ice particle fraction, it only decreases the flow speed at the periphery by about 40%. In the rest of the discussion below when the ‘liquid layer’ is referred to it presumes that the layer is in fact a mix of liquid and microscopic ice particles as it leaves the high-pressure zone. The observations in this study lead to the interpretation given above. For the present test results, at least, the interpretation is reasonable. In the present case a relatively small ice sample was used and it was mono-crystalline. It is noted, however, that similar crushing behaviors during tests using single crystals and polycrystalline samples have been observed5 using a different type of apparatus, suggesting that the interpretation given here is applicable to the polycrystalline case. Along the same lines, similar crushing behaviors of ice at different scales have been observed1 and the present interpretation could again be applicable at various scales. Since the present experiments were
performed other recent unpublished tests have been conducted with the same apparatus using lab-grown polycrystalline ice where similar observations were made. Furthermore the apparatus described here was then modified to enable ice-on-ice crushing tests using mono-crystalline and polycrystalline ice, again with similar observations.
4. POSSIBLE IMPLICATIONS FOR WATER PLUMES ON ENCELADUS
If we replace the crushing platen in Fig. 2 with ice then we can envisage an ice-ice interaction where the very same mechanisms in the former case apply, that is, high-pressure zones, spalling behavior, liquid production and rapid flow causing high-speed liquid/solid ejecta. As mentioned above, recent ice-on-ice crushing experiments have been performed with similar observations as those reported here. Results from those tests will be reported in the near future.
We note that the escape velocity on Enceladus is around 240 m/s and it is not unreasonable that such speeds could be attained when the particulars of the crushing interaction are scaled up. While the scale of the present experiments is small, similar behaviors have been observed on larger scales (3 orders of magnitude1), that suggest the same
phenomenon could be occurring at arbitrarily large scales, where the various parameters such as liquid layer thickness and flow rate are governed by the scale. If we use squeeze film theory and approximate the contact area as a circle we have the following expression6 for the thickness (h) of a liquid layer as a function of its viscosity (η), radius (R), average pressure (P) and rate (V) at which the two surfaces are moving towards one another to squeeze the liquid out.
h = (3ηVR2/2P)1/3 (1)
Using this expression for the present case where V, η, R and P are 0.3 m/s, 1750x10-6 Pa s (the bulk viscosity of liquid water), 9 mm and 70 MPa respectively, we get a thickness of around 10 microns, in roughly the same range as actual thickness measurements4. This layer thickness and the simple geometry further imply that the flow rate of the liquid as it approaches the periphery is about 140 m/s. In the video record for the test in Fig. 4 the highest ejecta speed was observed to be 40 m/s. This is lower than the fluid flow speed at the
periphery probably because of accumulation of liquid in the peripheral area where its thickness is apparently increasing and where other material may have been blocking its path. We recall that a small thin piece of ice (~ 0.17 mm in thickness) was generated at the periphery of the contact zone, i.e. over 10 times the average thickness of the fluid layer. One only has to increase the size of the contact area and /or the velocity of the ice/platen to generate higher rates of fluid flow. For example, the present tests are quite small in scale (about 3x10⁻⁴ m2 contact area), if we scale the diameter of the area of contact up by a factor of 10 and the penetration rate up by a factor of 3 (at a load drop precipitated by a spall event) we get a fluid flow rate at the periphery of about 630 m/s, that far exceeds the escape velocity for Enceladus. Even if the flow is substantially slowed down at the periphery for reasons mentioned above it is conceivable that the ejecta would still have adequate speed for escape.
It was observed in the tests that slushy material wedged in very shallow-angled spaces around the periphery of the high-pressure zone can itself be squeezed between the two surfaces during subsequent spall events thereby attaining high flow speeds
The issue of whether the ejecta has escape velocity is perhaps of secondary importance since we know the velocity will be substantial enough at least to carry the ejecta to a significant altitude above the surface of Enceladus while liberating water vapour during its flight. Eventually the ejecta moving at less than the escape velocity would return to the surface around the fissures and have the texture of fine snow. Furthermore the production of liquid water and warm ice by the process, both during spall events and during the times between the spall events, provides a source of water vapour that can directly escape from the surface fissures regardless of whether the liquid and warm ice stay in the fissures.
We note that large-scale tectonic behavior on Enceladus in the tiger stripes region is substantial over the course of the diurnal tidal stress cycle7. For the sake of the present discussion we will assume the model and analysis of Smith-Konter and Pappalardo [7] is correct. One of the cases the authors studied consisted of an elastic layer with a
depth is 6 km overlying a viscoeleastic layer for a total shell thickness of 24 km. The elastic layer has a vertical fault with a depth of 4 km. For an overburden depth of 2 km and friction coefficient of 0.2 their analysis shows that the scenario is conducive to fault activity. The resolved diurnal tidal shear stress and normal stress have maximal values of ~ 45 kPa and ~ 70 kPa respectively. The overburden pressure is ~ 200 kPa. The fault region is seismic. At times the tidal shear stress is insufficient to overcome the frictional stress resulting from the resolved tidal normal stress and overburden stress and the assumed friction coefficient. At those times the fault segments are locked and stress is stored elastically, similar to the case of earthquake zones on Earth. At other times the stress configuration leads to the diurnal tidal shear stress overcoming the frictional stress. Consequently a large slip (0.3-0.5 m) occurs, assumed instantaneously, when the Coulomb failure criterion is met, followed by some smaller creeping motions. It is reasonable to assume from the description7 that the actual sliding rate of the fault faces during the large seismic events would lead to associated strain rates at the ice-ice interface that would be in the brittle regime for ice behavior. How then does this scenario relate to the crushing and high pressures observed in the present experiments?
Note that there are many fault segments with varying stress conditions at any point in the diurnal cycle. At shallow depths there are fault areas at certain times in the cycle where tensile stresses overcome overburden stress causing openings7, that is fissures, to a maximum depth of ~ 700 m. In a freshly opened fissure the faces would be expected to have some degree of bumpiness (Fig. 6) as the ice is pulled apart due to adhesive effects and non-uniformities in the ice resulting from small voids, pre-existing cracks and spatially varying crystallographic fabric and texture. There will be little or no ice-ice contact in the fresh opening until a seismic sliding event occurs and then
Fig. 6. Downward view of prominences in a newly-opened fissure before (left) and during (right) interfacial fault sliding.
prominences on opposing fissure walls would collide. In older fissures some ice-ice contact areas would already be established from earlier sliding events. In either case during the sliding event the actual ice-ice contact areas would be significantly less than full wall contact.
If the opposing faces of a fault are sliding past one another relatively quickly during the seismic events, as implied in the Smith-Konter and Pappalardo [7] analysis, then colliding prominences on opposing walls of open fissures will generate high pressures since the crushing of ice in the brittle regime involves high-pressure contact, as has been documented in several studies1. Expanding on the rapidly sliding fault scenario7 we note that it implies that the dynamic friction coefficient in the fault, by definition, will be significantly less than the static friction coefficient. Hence the majority of the elastic stress, stored in the bulk ice on a large scale when static friction conditions prevailed in the fault, is available for conversion to kinetic energy through the acceleration of the massive volumes of ice on either side of the fault during sliding. Recall that a fissure is only ~ 700 m in depth and will be relatively limited in length whereas the fault is 4 km deep and extends many kilometers for and aft of a fissure zone. Hence the prominences on the fissure walls are attached to huge masses of ice that possess great momentum during fault sliding. The associated driving force leads to the high pressures at ice-ice contact areas (Fig. 6) when opposing prominences collide and crush against each other.
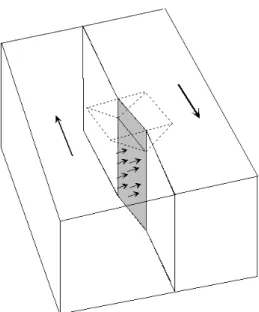
Fault geometry at the local scale may play a role. For example, fast (or slow) interfacial sliding of fault walls can lead to elastic stress buildup in the bulk ice in areas where the walls are misaligned with the general sliding direction (Fig 7). The situation creates increased normal stress on the misaligned section and a reduction of normal stress ahead and behind the fault section. This mechanism can lead to opening of new fissures immediately ahead and behind the misaligned section and consequent opportunities for opposing prominences on the fissure walls to collide during the sliding, as described before. Furthermore, the increased stress on the misaligned section could cause sudden fracture and separation of large chunks of ice in the top regions of the fault walls where confinement is
reduced. Stress in the surrounding ice would cause the newly-opened fissures to elastically rebound and close to some extent when the chunks separate,
leading to ice-ice crushing of opposing
prominences in the normal direction in addition to the crushing due to sliding.
Some of the interacting prominences would be in locations and orientations where ejection of material from the moon’s surface is possible, that is, near the tops of fissures. Other ejecta would remain on the walls of the fissures as a vapour source, but could nevertheless provide a slushy fluid material for subsequent squeeze events between rapidly moving ice faces that could also generate high-speed ejecta. Furthermore, the slush provides heat that could locally warm the region of the tectonic-induced crushing activity. The tiger stripe areas on Enceladus have been shown to be the warmest regions of the moon’s surface8. How much particulate ice and water vapour the processes we have discussed here would contribute to the plumes of Enceladus is beyond the scope of this paper.
Fig. 7. Fracture and separation of large ice chunks (dashed lines) at the top region of a misaligned fault section (grey). Long arrows indicate relative sliding directions on opposing sides of the fault. Small arrows indicate stress on the misaligned fault section.
Other researchers have suggested that frictional heating at the fault walls in the tiger stripe zones elevates the temperature of the ice and creates plumes of water vapour and ice crystals8. Where the present work differs from that study is that their interpretation is related to water vapour created by frictional heating as the sole source of the plumes whereas this work goes into the detailed nature of some of the frictional heating and creation of liquid and warm refrozen ice (i.e. the viscous flow of liquid), and furthermore reports a mechanism for jets of liquid and ice particles in addition to a source of water vapour. The present mechanism applies whether or not there is liquid present in large or small quantities from thermal heat sources deep inside the moon. The present process does, however, require that the ice be somewhat close to its melting temperature. The lowest temperature at which the process could operate would have to be determined through experiments and it is unlikely that it could work at very low temperatures, as would be the case for the ice in the frigid faithful model9.
Some scientists have proposed that vents of water from liquid reservoirs deep below the surface are the cause of the water plumes on Enceladus10. The vents would be a heat source to contribute to the warmth of ice in the region of activity. Furthermore, liquid from the vents that wets the walls of fissures would help get the present process going during crushing events, that is, by providing a preexisting layer of liquid between ice faces that are crushed against each other. This liquid is not required however, since pressure melting of warm ice in high tectonic regions and possibly the presence of a liquid–like layer on the ice surface11 may also provide a small amount of initial liquid to get the rapid viscous flow and melting process going, as in these tests.
5. CONCLUSIONS
In situ observations of ice crushing behavior obtained from a high-speed imaging camera have revealed processes that can explain the sawtooth cyclic load pattern that is often characteristic of ice crushing and indentation experiments. Small stable cracks that occur in the roughly central region of the high-pressure intact ice zone during spalling events serve as nucleation sites for the next spall event and associated load drop. The roughly central
location of the small cracks, and their distribution, determines the size and shape of the next spall. The production and high flow rate of liquid and refrozen water from the contact zone during spall events in these tests probably happens during ice-ice crushing at larger scales. If ice-ice crushing events near the tops of fissures, due to tectonic behavior, occur on Enceladus and if the ice is sufficiently warm then the ejecta velocity could enable it to rise high above the moon’s surface, liberating water vapour at altitude due to its warmth. The ejecta velocity may even be high enough to enable escape from the moon. The warm ejecta that stays in the fissures still serves as a source of water vapour that can escape and also as a heat source that warms the local ice.
REFERENCES
(1) R. E.Gagnon, Proc. POAC-99, Helsinki, Finland, 2, 858-869 (1999).
(2) R.E. Gagnon, Proc. IAHR-08, Vancouver, Canada, 2, 983-991 (2008).
(3) J.N. Spitale and C.C. Porco, Nature, 449, 695-697 (2007).
(4) R.E. Gagnon, J. Glaciol., 40(134), 119-124 (1994).
(5) R.E. Gagnon and A. Bugden, Proc. POAC-07, Dalian, China, 235-244 (2007).
(6) F.P. Bowden and D. Tabor, The friction and lubrication of solids, Oxford, Clarendon Press (1986).
(7) B. Smith-Konter and R.T. Pappalardo, Icarus,
198, 435-451 (2008).
(8) F. Nimmo, J.R. Spencer, R.T. Pappalardo, M.E. Mullen, Nature, 447, 289-291 (2007). (9) S.W. Kieffer, X. Lu, C.M. Bethke, J.R.
Spencer, S. Marshak, A. Navrotsky, Science,
314(5806), 1764 – 1766 (2006).
(10) C.C. Porco, P. Helfenstein, P. C. Thomas, A. P. Ingersoll, J. Wisdom, R. West, G. Neukum, T. Denk, R. Wagner, T. Roatsch, S. Kieffer, E. Turtle, A. McEwen, T. V. Johnson, J.
Rathbun, J. Veverka, D. Wilson, J. Perry, J. Spitale, A. Brahic, J. A. Burns, A. D. DelGenio, L. Dones, C. D. Murray, S. Squyres, Science, 311(5766), 1393 – 1401 (2006).