Ash Impacts on Gasoline Particulate Filter Performance and Service Life by
Nicholas C. Custer
B.S. Naval Architecture and Marine Engineering United States Coast Guard Academy, 2009
Submitted to the Department of Mechanical Engineering in Partial Fulfillment of the Requirements for the Degrees of
MASTER OF SCIENCE IN MECHANICAL ENGINEERING AND
MASTER OF SCIENCE IN NAVAL ARCHITECTURE AND MARINE ENGINEERING
AT THE
MASSACHUSETTS INSTITUTE OF TECHNOLOGY June 2015
0 2015 Massachusetts Institute of Technology All rights reserved
Signature of Author:
Certified by:
Accepted by:
ARCHNES
MASSACHU: ETS INSTITUTEOF flECHNO0LOLG-Y
JUL 3
0
2015
LIBRARIES
Signature redacted
Department of Mechanical Engineering May 8, 2015
Signature redacted_____
I Victor W. Wong
Principal Research Scientist and Lecturer in Mechanical Engineering Thesis Supervisor g -r t
ed
Signature redacted'
David Hardt Chairman, Department Committee on Graduate Students
Ash Impacts on Gasoline Particulate Filter Performance and Service Life by
Nicholas C. Custer
Submitted to the Department of Mechanical Engineering on May 8, 2015 in Partial Fulfillment of the Requirements for the Degree of
MASTER OF SCIENCE IN MECHANICAL ENGINEERING AND
MASTER OF SCIENCE IN NAVAL ARCHITECTURE AND MARINE ENGINEERING
ABSTRACT
New regulations in the United States and Europe, designed to address climate change concerns by reducing greenhouse gas emissions, are causing increased use of gasoline direct-injection (GDI) engines in light-duty vehicles (LDV). Separate new regulations that aim to reduce particulate emissions to address air pollution concerns are taking effect concurrent with greenhouse gas limitations in both jurisdictions. GDI engines are proven to create more particulate emissions than previously utilized port-injection technology. Increasing particulate emissions rates combined with falling regulatory particulate emissions limits requires new strategies to reduce these emissions from gasoline powered LDVs.
Particulate filters have been successfully implemented to reduce particulate emissions from diesel engine exhaust for over a decade. Diesel particulate filters have a demonstrated filtration efficiency of 95% or greater and have reduced diesel particulate mass (PM) emissions by one to two orders of magnitude. GDI engines require no more than one order of magnitude reduction in particulate emissions to meet new regulations. Existing particulate filter technology in use in diesel vehicles is capable of reducing GDI engine emissions to new regulatory levels; however, it is proposed that these reduction may be achievable through means other than gasoline particulate filters (GPF).
A GPF will create an additional backpressure in the engine exhaust system that will reduce engine power and efficiency. This backpressure will increase as PM is trapped in the filter and decrease as combustible PM removed. A buildup of incombustible ash present in engine-out PM will increase the baseline backpressure of the filter during the course of its service life. It is important to understand the impact of ash on the filter pressure drop performance before implementing GPF to meet new emissions regulations.
This study builds on existing diesel particulate filter technology and demonstrates through experimental results the mechanisms by which ash increases GPF pressure drop. Ash deposits are also shown to increase the light-off temperature of three-way catalyst coatings in GPF.
Acknowledgments
I have hoped for an opportunity to study at MIT since my times as an undergraduate at the Coast Guard Academy. It was there that I developed my love of engineering and at the same time learned about the impressive opportunities available to graduate students at MIT. I would like to thank Dr. Todd Taylor, CAPT John Reeves, LCDR Nicholas Parker, CDR Michael Corl and Dr. Kurt Colella, among many others, for guiding me through the formative years of my engineering education and setting me on the path to where I am today.
My time at MIT has been extremely challenging and rewarding. First and foremost I would like to thank my thesis advisor, Dr. Victor Wong, for giving me the opportunity to work at the Sloan Automotive Engine Laboratory and supporting me throughout my time at MIT in every way imaginable. Dr. Wong's advice and wisdom throughout my research at the Sloan lab moved my research forward and his flexibility and positive foresight allowed me to reach all of my goals
during two years as a master's student.
My research project would not have been possible without the support of the Ford Motor Company. I would like to thank James Pakko, Christine Lambert, Christoph Boerensen, and Tim Chanko for all of their advice, guidance, and patience throughout this project. I have learned a lot about conducting research and the realities of engineering outside of an academic setting from our interactions.
I would like to thank Dr. Carl Justin Kamp for his continuous encouragement, guidance, and support on this project. I doubt that I will again encounter someone with the impressive combination of scientific knowledge, curiosity, and work ethic that Dr. Kamp brings to the lab every day. I could not have reached my research goals without the mountain of effort that he has contributed to this project. Thank you also to Dr. Alexander Sappok for the invaluable wisdom and guidance on this project.
My research would not have been possible without the help of the highly skilled and professional staff at the automotive engine lab. Thank you to Thane DeWitt, Raymond Phan, and Janet Maslow for the constant and unwavering support.
To my lab mates, Tim Murray, Paul Folino, James Jorgensen, Greg Monahan, and Michael Arnold, thank you for all of the advice, both academic and otherwise. Time spent in the office covered the spectrum of productivity but was crucial to answering the tough questions as research progressed and maintaining balanced mental health over two long years.
I would like to thank the US Coast Guard allowing me the opportunity to spend two years as a full time student in the midst of my career. Thank you also to the US Navy 2N program for supporting me during my time at MIT and facilitating my continued study of Naval Architecture.
Finally, I would like to thank my loving family for supporting and encouraging me all along the way. My time at MIT represents the culmination of a long academic career made possible by the
Table of Contents
Acknow ledgem ents... 5
List of Figures ... 9
List of Tables ... 11
List of Abbreviations ... 13
1. Introduction... 15
1.1 Increased U se of Gasoline D irect Injection ... 16
1.2 Com bustion and Stoichiom etry... 17
1.3 Engine Em issions and Controls ... 19
1.3.1 N itrogen Oxides ... 20
1.3.2 Unburned Hydrocarbons ... 21
1..>.3 Carbon M onoxide ... 24
1.3.4 Particulate Em issions... 24
1.3.5 Increased Particulate Emissions from Direct-Injection Engines ... 25
1.3.6 Three-W ay Catalyst ... 27
1.3.7 D iesel Particulate Filter... 28
1.3.7.1 W all Flow M onolith D PF ... 30
1.3.7.2 Regeneration of W all Flow M onolith D PF... 30
1.3.7.3 Typical DPF M aterials... 32
1.3.8 G asoline Particulate Filter Concept of Operation... 32
1.3.8.1 GPF Installation Location... 33
1.3.8.2 GPF Regeneration Strategies ... 33
1.3.8.3 Three-way Catalyst Coating of GPF... 35
2. Experim ental Plan... 37
2.1 A ccelerated Filter Loading ... 37
2.1.1 Experim ental Apparatus... 37
2.1.2 Loading Procedure ... 40
2.2 Catalytic A ctivity Testing ... 44
2.2.1 Catalyst Test Bench ... 44
2.2.2 Test Procedure ... 45
3.2 Characterization of A sh D istribution in Test Sam ples ... 50
3.3 Packing D ensity ... 52
4. Results... 53
4.1 G PF Pressure Drop Perform ance ... 53
4.1.1 Un-Catalyzed GPF ... 53
4.1.2 Un-Catalyzed G PF w ith Soot Loading ... 56
4.1.3 Catalyzed GPF ... 59
4.2 Catalyst Perform ance for A sh Loaded C-G PF... 62
4.3 A sh D istribution in U n-catalyzed GPF ... 65
5. Conclusions... 67
5.1 GPF Pressure D rop Response to A sh... 67
5.2 GPF Pressure Drop Response to Soot... 67
5.3 A sh Im pacts on Catalytic A ctivity in C-GPF ... 68
6. Future W ork ... 69
List of Figures
Figure 1-1. Exhaust Gases Composition versus Equivalence Ratio... 19
Figure 1-2. Soot Sources in a GDI Engine ... 26
Figure 1-3. Three-W ay Catalyst ... 27
Figure 1-4. Typical Pressure Drop versus Ash Load for a DPF... 29
Figure 1-5. Wall Flow Monolith Arrangement and Flow Diagram... 30
Figure 2-1. Accelerated Aging System Diagram... 38
Figure 2-2. Example Raw Pressure Drop Data with Quadratic Model Fit ... 44
Figure 2-3. Flow Bench System Diagram ... 45
Figure 2-4. Example of Lean Light-off Catalytic Activity Test ... 46
Figure 2-5. Example of Near-Stoichiometric Light-off Catalytic Activity Test ... 47
Figure 3-1. Ash and Soot Deposit in a Wall Flow Monolith Filter ... 49
Figure 3-2. Example of Channel Area Reduction at High Ash Load ... 50
Figure 3-3. GPF Core Sample and Sub-sections ... 51
Figure 3-4. Im age-J A nalysis M ethod ... 51
Figure 4-1. Pressure Drop versus Ash Load; Experiment 1 ... 53
Figure 4-2. Electron Microscope Image of Ash Islands ... 54
Figure 4-3. Pressure Drop versus Void Volume Filling; Experiment 1 ... 56
Figure 4-4. Pressure Drop versus Ash and Soot Load; Experiment 2... 56
Figure 4-5. Absolute Pressure Drop versus Soot Load at 0-30g/L Ash Load ... 57
Figure 4-6. Normalized Pressure Drop Response to Soot Load at 0-30g/L Ash Load ... 58
Figure 4-7. Pressure Drop versus Ash Load; Experiment 3 ... 60
Figure 4-8. Pressure Drop versus Void Volume Filling; Experiment 3... 61
Figure 4-9. Electron Microscopic Image of Wash Coat Distribution in Cordierite Substrate... 62
Figure 4-10. Lean; Catalyst Light-off Temperature versus Ash Load ... 63
Figure 4-11. Near-Stoichiometric; Catalyst Light-off Temperature versus Ash Load ... 64
Figure 4-12. Filter 4 and 5 Ash Distribution Plot ... 65
Test Filter Characteristics ...
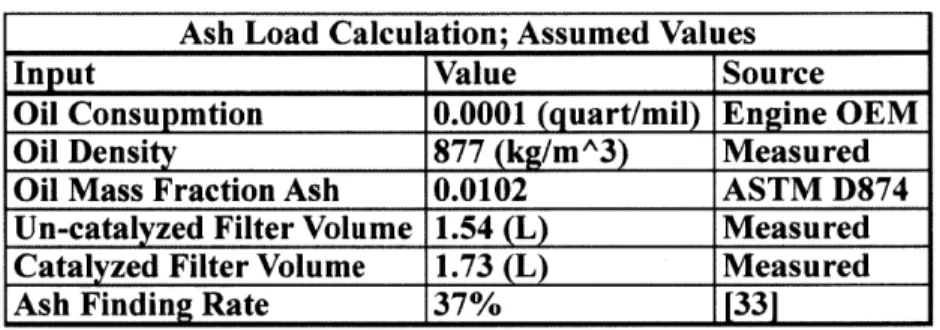
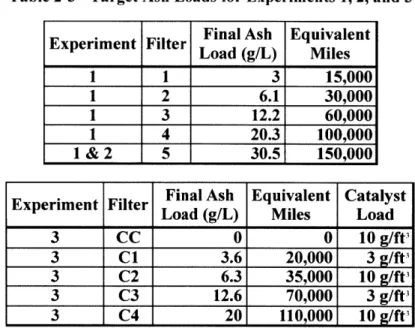
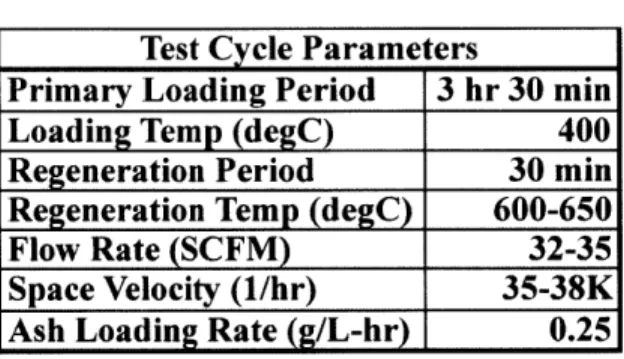
M ileage to Ash Load Conversion Inputs ... Target A sh Loads for Experim ent 1, 2, and 3...
Loading Cycle Param eters ... Catalytic Experim ent Inlet Gas Com position ... Soot Response Y-Intercept P-values ... Catalyst Light-off Tem peratures...
List of Tables Table 2-1. Table 2-2. Table 2-3. Table 2-4. Table 2-5. Table 4-1. Table 4-2. 40 41 42 43 45 59 63
List of Abbreviations
AFR - Air to Fuel Ratio by Mass
AFRs - Stoichiometric Air to Fuel Ratio
C-GPF - Catalyzed GPF
CO - Carbon Monoxide
CO2 - Carbon Dioxide
DPF - Diesel Particulate Filter
ECM - Engine Control Module
EPA - Environmental Protection Agency
FTIR - Fourier Transform Infrared Spectroscopy GDI - Gasoline Direct Injection
GHG - Greenhouse Gas
GPF - Gasoline Particulate Filter
GPI - Gasoline Port Injection
GTDI - Gasoline Turbocharged Direct Injection
HC - Hydrocarbon
H/C - Fuel Hydrogen to Carbon Ratio
H20 - Water
LDV - Light-Duty Vehicle
MY - Model Year
NHTSA - National Highway Traffic Safety Administration
NMOG - Non-Methane Organic Masses
NO - Nitric Oxide NO2 - Nitrogen Dioxide
NOx - Nitrogen Oxides
PM - Particulate Mass
PN - Particulate Number
SI - Spark Ignition
SOF - Soluble Organic Fraction
TWC - Three Way Catalyst
VOC - Volatile Organic Compounds
y - Heat Capacity Ratio
1. Introduction
The transportation sector consumes 28% of total energy usage in the United States and contributes 27% of US greenhouse gas (GHG) emissions [1, 2]. Vehicles powered by gasoline internal combustion engines consume 57% of US transportation energy [1]. Reducing GHG emissions has become an important part of curbing global climate change. In April 2010, the US Environmental Protection Agency (EPA) and National Highway Traffic Safety Administration (NHTSA) established final rules for phase one on the Light-Duty Vehicle (LDV) Greenhouse Gas Emissions and Corporate Average Fuel Economy Standards (CAFE) setting goals to reduce fleet wide CO2 emissions and increase fleet average fuel economy [3]. The final rule for phase
two of this effort was passed in October 2012. CAFE standards aim to reduce the fleet average CO2 emissions for LDVs by 45% between model year (MY) 2012 and MY2025 with an
associated increase in fleet average fuel efficiency of 81% [3, 4].
To address vehicle emissions other than GHG, the EPA will implement Tier 3 Motor Vehicle and Fuel Standards in 2017. This regulation will set strict limits on vehicle tailpipe emissions of non-methane organic gasses (NMOG), nitrogen oxides (NOx), and particulate mass (PM). Tier 3 standards aim to reduce NMOG+NOx emissions levels by 70% and PM emissions by 80% relative to current fleet averages. These standards will phase in from MY2017 to MY2025 concurrent with the phase in of CAFE standards. The final Tier 3 PM emissions limit for LDV is 3mg/mi [5].
For the European market, Euro 6 emissions standards were adopted in 2007. Euro 6 includes a PM limit for gasoline direct injection (GDI) engines of 4.5 mg/km (7.2mg/mi) but also includes an additional limitation on particle number (PN) emissions of 6.0x10" particles/km. This requirement will phase in for GDI engines with an initial standard of 6.Oxl012 particles/km taking force this year and the full Euro 6b limit of 6.0x10¹¹ particles/km beginning in 2018 [6]. Analysis of diesel soot has estimated that there are approximately 2.0x10¹² particles per mg of
soot [7]. Utilizing this value for a first order estimate of GDI soot emissions, the PM level equivalent to the Euro 6b PN limit of 6.Ox10 particles/km is 0.3mg/km (0.48mg/mi). This limit is an order of magnitude lower than the PM limits set by Tier 3 and Euro 6 for GDI engines.
the largest particulate emission reduction relative to current levels. Current technology can perform near Tier 3 and Euro 6 PM limits but are an order of magnitude above the Euro 6b PN limit [8].
1.1 Increased Use of Gasoline Direct-Injection
One strategy for fleet-wide fuel economy improvement for gasoline engines to meet CAFE standards is implementation of GDI engines. Direct injection offers improvements in an engine's thermal efficiency over gasoline port injected (GPI) engines because the latent heat of vaporization of the liquid fuel is drawn from the charge air for GDI. In GPI engines the vaporization energy is predominantly drawn from solid surfaces in the air intake manifold such as the manifold walls and intake valve. In cylinder vaporization of the fuel spray in a GDI engine increases the heat capacity ratio ( y ) of the charge mixture. Higher y increases the thermodynamic efficiency (qf i) of the engine cycle, which is given in equation 1 [9, 10].
1
rA=1 - - (1)
77f~i
rc-GDI can also pair well with engine downsizing and turbo charging to further increase fuel efficiency to meet CAFE standards [9]. Reducing the engine displacement will increase the overall fuel efficiency by forcing the engine to operate at higher load levels during normal operation. The engine is then turbocharged to increase the volumetric efficiency in order to achieve the required peak power with smaller displacement. A drawback of this strategy is that the resulting downsized turbocharged engine will operate at a higher compression ratio and therefore be more prone to knocking during high load operation. Direct-injection of the fuel to the cylinder is an effective knock mitigation strategy for this type of engine. The result is a gasoline turbocharged direct injection (GTDI) engine with higher fuel efficiency and a smaller displacement than a naturally aspirated port-injected engine of similar power.
GDI mitigates engine knock by reducing the charge temperature when compared with GPI by changing the source of the latent heat of vaporization. In the case of GDI the majority of the latent heat is taken from the charge air. For GPI the latent heat is primarily conducted from the
surfaces of the inlet manifold and intake valve, cooling those solid components and not the charge gases. The reduction in charge temperature with GDI maintains the end gas pressure below the knock limit at higher compression ratios resulting in higher volumetric and thermodynamic efficiency for the GTDI engine at peak power. The EPA and NHTSA project market penetration of 94% for GDI and 89% for turbocharged-downsizing by MY2025 [9]. With the increase usage of this technology comes two notable disadvantages, increased cost and
increased particulate emissions.
The component cost of direct-injection fuel systems is higher than port-injection fuel systems primarily because of the pressures required for the atomizing fuel spray needed to facilitate in-cylinder fuel vaporization. The normal fuel pressure for GPI is 3-7bar resulting in fuel droplets of 80-200ptm [11]. Direct-injection requires smaller fuel droplets to promote vaporization in the charge gases without the help of hot surfaces that facilitate evaporation for port-injection. The fuel pressure for GDI is 50-150bar to produce fuel droplets of 15-50pm [11]. The direct-injection fuel system requires a high-pressure fuel pump and nozzles that can handle these pressures. Direct-injection nozzles also require higher cost materials and manufacturing to operate in a harsher in-cylinder environment compared with port-injection nozzles located in the inlet manifold. The one time added cost of direct-injection systems has discouraged their use in spark ignition engines in the past. However the need to implement fuel economy improvements to meet CAFE standards combined with the increasing cost benefit of fuel economy with rising gasoline prices makes direct-injection fuel systems a critical part of future LDV engine design.
1.2 Combustion and Stoichiometry
Chemical energy is converted to thermal energy inside a gasoline engine through combustion. The thermal energy is then converted to mechanical energy and output as mechanical work. During ideal combustion an oxidizer reacts with hydrocarbon species to form CO2 and H20. Actual engine combustion does not result in full oxidation of all fuel hydrocarbons resulting in secondary products in addition to CO2 and H20. In consumer vehicles the oxidizer for the combustion reaction is oxygen present in atmospheric air. Additional oxidizers may be introduced in some unique applications.
Gasoline can consists of over 200 different hydrocarbon species. Each species will have its own stoichiometric balance for ideal combustion. The average hydrogen to carbon (H/C) ratio of gasoline is 1.87 and the molecular weight is -110[10]. Iso-octane is a useful substitute for gasoline with a H/C ratio of 2.25 and molecular weight of 114. The balanced stoichiometric combustion reaction for Iso-octane reacting with air is given in equation 2.
C8Hl8 + 12.5(02 + 3.773N2) -+ 8C02 + 9H20 + (12.5 * 3.773)N2 (2)
The molar ratio of air to iso-octane for ideal stoichiometric combustion is 12.5. The stoichiometric air to fuel ratio by mass is found by applying the molecular weights of iso-octane and air to the molar ratio. The stoichiometric air to fuel ratio (AFRs) for iso-octane is 15.13 [10]. Calculation of AFRs for gasoline is complicated by the number of unique hydrocarbon species present but has been found to be 14.6 [10].
The air fuel ratio (AFR) in a spark ignition (SI) engine must be maintained as close to AFRs as possible to maximize efficiency and power output, and to ensure proper operation of the three-way catalyst (TWC) to limit vehicle emissions. At AFRs all fuel will be fully oxidized with no excess oxygen remaining. Full oxidation of the hydrocarbon fuel minimizes specific fuel consumption, maximizing efficiency. Consumption of all oxygen present maximizes power output for a given cycle because the largest possible fuel charge is combusted. Figure 1-1 shows the composition of dry exhaust gases from a SI engine as a function of AFR. In this plot AFR is represented by the Equivalence Ratio ((D) described in equation 3.
AFR
(3)
U 6 U 0 .5 0.16 -- --D & L 0.14 St, Sp X+0oH&S - MIT-0.12 - -- - -) 0.10 - - _ 1 I__ ._ Ile_ 0A 0.08--0 CO 0 00 0.04 0 0 - 7H -0.04L 0.02 1 1 0 H/C = 2 - 2.25 0 101 0.00 0.00 1~. V -i -0.5 0.6 0.7 0.8 0.9 1.0 1.1 1,2 1.3 1.4 1.5
Exhaust equivalence ratio
Figure 1-1 - Internal Combustion Engine Major Exhaust Constituents as a Function of Equivalence Ratio [10]
Independent of fuel efficiency and power output, the overall AFR for a modem SI engine must
be maintained at AFRs to facilitate proper operation of the exhaust catalyst. Commonly referred to as the catalytic converter, the exhaust catalyst is responsible for removing harmful combustion products from a vehicle's exhaust stream prior to emission from the tailpipe. Modern three-way catalysts require stoichiometric engine exhaust in order to function properly. The TWC will be discussed further in section 1.3.6.
1.3 Engine Emissions and Emissions Controls
The primary products of hydrocarbon oxidation were outlined in section 1.2 and are shown in Figure 1-1. Several additional chemical and physical processes occur inside the engine cylinder and exhaust manifold that lead to additional engine out exhaust constituents. Several of these additional constituents along with carbon monoxide present significant health and environmental hazards. Regulations limiting these pollutants are in place and reduction strategies including the TWC are in use to limit their release into the atmosphere. It is important to understand the formation mechanism of these pollutants, their health effects, and the strategies to reduce them through engine exhaust gas after treatment before considering new after treatment technology.
1.3.1 Nitrogen Oxides
A large amount of diatomic nitrogen is present in the engine cylinder because it is drawn in from the atmosphere with the oxygen needed for combustion. Formation of NO follows the extended Zeldovich mechanism, which consists of three separate chemical reactions represented in equations 4, 5, and 6 [10].
0 + N2- NO + N (4)
N+02 -NO + 0 (5)
N+OH -+ NO+H (6)
Combustion generates a small number of independent oxygen atoms that are capable of reacting with a normally stable diatomic nitrogen molecule at temperatures greater than 2000K to form nitric oxide (NO) [10]. The resulting nitrogen atom is highly reactive and will quickly react with either oxygen or hydroxide to form a second NO molecule. The reaction given in equation (4) is the rate-limiting step of this mechanism. NO formation continues after combustion until the exhaust stream cools below 2000K at which point NO concentrations are frozen. Some NO molecules are further oxidized to NO2 in the combustion chamber. The resulting mixture of
nitrogen oxides is commonly referred to as NO,. NO2 can constitute 10-30% of total NO, in
compression ignition engine exhaust. However, the NO2 fraction of NOx in an SI engine is
normally negligible and makes-up at most 2% of total NO,. The NO, concentration in engine out exhaust for an SI engine ranges from 500-2000ppm [10].
NO, emissions contribute to air pollution by elevating levels of ozone and NO2 in the lower
atmosphere. NO, emitted from the vehicle tailpipe is almost entirely NO. The NO emitted from the vehicle will react with volatile organic compounds (VOC) (also emitted from vehicles and discussed in section 1.3.2) in the presence of sunlight to form ozone through the photochemical smog formation process. A series of complex reactions will continuously generate and break down ozone in the atmosphere but with sufficient sunlight, atmospheric temperatures, and supply of NO and VOCs, ozone levels will rise [9]. NO2 is also generated during the balanced reactions
contribute to asthma attacks, pulmonary inflammation, and respiratory irritation particularly in children, elderly adults, and individuals with respiratory diseases [12, 13].
1.3.2 Unburned Hydrocarbons
The hydrocarbon fuel introduced into the engine cylinder will not be fully oxidized during the combustion process. There are four processes that can generate unburned hydrocarbons (HC) in a typical SI engine. Flame quenching at cool surfaces on the cylinder walls can leave a thin layer of unburned mixture after combustion. Portions of the unburned mixture can enter crevice areas in the cylinder and escape combustion when flame quenching occurs at the crevice entrance. HC can absorb into lubricant oil films on the cylinder walls prior to ignition and desorb into the burned gases after combustion. Large quantities of HC can be generated by cylinder misfires or incomplete combustion of the charge, which can occur during cold start or major engine transients when gas temperature, air fuel ratio, spark timing, and exhaust gas recirculation are not ideal for combustion [10]. In addition to these mechanisms, fuel impingement on cylinder surfaces can generate HC emissions in a GDI engine.
Flame quenching occurs when the pre-mixed flame propagates near the cylinder walls or reaches a narrow crevice entrance. The engine coolant cools the cylinder walls and heat transfer from the end gas to the walls overcomes the heat release of the combustion leaving a layer of unburned or partially burned hydrocarbons along the quenching surface. In the case of crevice entrances, the increase in surface area to volume ratio elevates heat transfer and can quench the flame even if all surfaces are not cooled to the temperature of the cylinder walls. Typical quench layer thickness for an SI engine ranges from 0.05 to 0.4mm [10].
Crevices contribute a major portion of the total HC. There are several typical crevice areas in a SI engine cylinder, but the largest source of HC comes from the piston top land clearance crevice. This crevice is bounded by the cylinder wall, piston top land, and piston top ring. The cylinder walls cool this crevice charge resulting in a higher density than the bulk cylinder end gasses. As cylinder pressure rises during combustion, the total mass in the crevice increases. When the flame reaches the crevice entrance it quenches leaving unburned mixture in the crevice
volume. During the expansion stroke the crevice gasses expand and flow out of the crevice carrying HC into the burned gas mixture [10].
Incomplete combustion of the cylinder charge results in exhaust of the remaining stoichiometric mixture. In the case of misfire, the entire fuel mass injected during that cycle will contribute to unburned hydrocarbon emissions. This mechanism can create the largest volume of HC per cycle, but it does not occur regularly. Incomplete combustion occurs when the end gas temperature and pressure drop quickly enough during the expansion stroke to quench the flame in the bulk gas. This phenomenon can occur during light loading and engine transients. Improper spark timing, exhaust gas recirculation levels, and air fuel ratio are causative factors in incomplete combustion [10].
HC can enter the burned gas mixture by desorbing from the cylinder wall oil film after combustion. The hydrocarbons enter the cylinder as part of a stoichiometric mixture and begin to absorb into the oil film present on the cylinder wall and piston crown. As the mixture pressure increases during the compression stroke, the vapor pressure of hydrocarbons rises forcing further absorption of fuel vapors into the oil films. After combustion the partial pressure of hydrocarbons in the burned gas mixture is near zero, which drives desorption of the hydrocarbon
species present in the oil film. This source of hydrocarbons is unique compared to flame quenching, crevice volumes, and incomplete combustion as a source of HC because the resulting hydrocarbons are no accompanied by unburned oxygen present in the original stoichiometric mixture levels [10].
Liquid fuel on the piston crown and cylinder surfaces in GDI engines is a fifth source of unburned hydrocarbon emissions for this engine type. When fuel is injected directly into the combustion cylinder, the fuel spray will impinge on the piston crown and cylinder walls. The location and degree of surface impingement depends on the injector type, location, and fuel spray aiming. For typical direct injection the largest fuel films will occur on the piston crown due to fuel spray impingement when the piston approaches top dead center. The resulting liquid fuel film or pools will not fully vaporize leaving liquid fuel present after combustion. A portion of these films will vaporize into the hot burned gasses after combustion contributing to hydrocarbon
emissions. The liquid fuel pools are also consumed by diffusion flame pool fires, which will be discussed in section 1.3.5. Pool fires limit the total mass of fuel that will vaporize into the burned gas mixture as HC. For optimum injection timing, the fuel film mass is sufficiently small that this source will contribute less than 15% of total HC. For sub-optimal injection timing fuel films from fuel spray impingement can contribute to higher hydrocarbon emissions but will never constitute more than 35% of the total HC from all sources [14].
The five source of hydrocarbons discussed above contribute to HC content in the burned gas mixture following combustion. Three of these mechanisms also contribute oxygen to the mixture. When HC and remaining oxygen mix with the hot burned gasses additional hydrocarbon oxidation will occur. Hydrocarbon oxidation continues during the exhaust process both in cylinder and in the hot exhaust manifold. In cylinder oxidation primarily impacts wall quench layer hydrocarbons. These species are in close proximity to hot burned gasses and oxygen and will oxidize readily. Other hydrocarbons will experience a majority of oxidation late in the exhaust stroke and in the exhaust manifold because they rely on longer residence times for mass transfer from crevices and mixing with available oxygen. As much as 50% of the HC present can be oxidized in cylinder and up to 40% of the remaining HC can be oxidized in the exhaust manifold [10].
These oxidation processes can produce CO2 and H20, but partial oxidation is common
generating CO and partially oxidized hydrocarbons as products. Pyrolysis also occurs at this stage generating soot from some unburned hydrocarbons. Pyrolysis is discussed in section 1.3.4 [10].
Hydrocarbons present multiple health risks. Many hydrocarbon species are highly reactive with NO to form NO2. These species, referred to as VOCs, are a key reactant in the photochemical smog formation process and contribute to the negative health effects described in section 1.3.1 [9, 10]. In addition, certain hydrocarbon species are known carcinogens. Benzene is one example that has been shown to cause leukemia by all routes of exposure. Benzene has also been linked to non-cancerous blood disorders and other negative health effects [9].
1.3.3 Carbon Monoxide
Carbon monoxide (CO) is generated during fuel combustion when incomplete oxidation of the hydrocarbon fuel occurs. The oxidation reactions necessary to breakdown large hydrocarbon species are complex. CO is one major product of the intermediate steps of the combustion reaction. After CO is produced in the combustion flame zone it is oxidized to form CO2 to
complete the ideal combustion reaction. In the cylinder during combustion these chemical reactions proceed at rates sufficient to maintain equilibrium between the products and reactants meaning that CO is present at the expected equilibrium level for the given temperatures and pressures. After combustion, the reaction remains in equilibrium as the charge cools during expansion, but after exhaust valve opening the rate of charge cooling increases and the chemical reactions of CO become kinetically limited and can no longer equilibrate. CO concentrations are effectively frozen at equilibrium values for temperature and pressure significantly above the eventual tailpipe out conditions [10].
Exposure to CO has been linked with several negative health effects. The EPA found that a casual link is likely between short term CO exposure and increased risk of cardiovascular disease. Other possible negative health effects include birth defects, preterm birth, and respiratory disease. Current evidence based on human epidemiology and animal toxicology suggests that both short term and long term CO exposure may contribute to these conditions [9,
15].
1.3.4 Particulate Emissions
Particulate mass (PM) in the engine exhaust stream is made-up of elemental carbon, incombustible ash derived from lubricant oil additives and engine wear particles, and soluble organic fraction (SOF) [16]. Elemental carbon particles, commonly referred to as soot, are the primary constituent of engine out PM. Soot forms in cylinder from fuel hydrocarbons when they are exposed to temperatures greater than 400")C in the absence of oxygen. Under these conditions hydrocarbons decompose through pyrolysis to form soot precursor compounds that will react to form polycyclic aromatic hydrocarbon (PAH) molecules that in turn form soot [16].
Conditions required for soot formation can occur by two main mechanisms. Regions of very fuel rich mixture will combust leaving large concentrations of unburned hydrocarbons in an oxygen-depleted region. Soot formation will proceed as long as sufficient temperatures are maintained. Soot will also form through burning of a diffusion flame. In a diffusion flame, fuel vapors from a region of pure fuel in liquid and/or vapor form mix with air in the flame zone to form the reactants needed for the combustion reaction. The presence of pure fuel vapors adjacent to the flame zone creates ideal conditions for soot formation [16].
After the formation of soot precursors through partial oxidation and pyrolysis of larger hydrocarbons, soot will either oxidize in the cylinder or exhaust manifold or agglomerate and leave the engine as PM emissions. Soot precursors consist of a series of small hydrocarbon compounds that are easily oxidized prior to agglomeration. Precursors that come in contact with oxygen in the cylinder or exhaust manifold will likely oxidize and leave the engine as CO, CO2,
H20, and other secondary combustion products. Soot precursors that do not contact free oxygen will begin to nucleate with other precursors to form soot particles [8]. There are two modes of growth for soot particles after nucleation, surface growth and coagulation. Surface growth occurs when additional soot precursors meet and join existing soot particles. Surface growth leads to an increase in PM mass and mean particle size while PN remains constant. Coagulation occurs when two soot particles meet and combine to form a single larger particle. Mean particle size increases, PN decreases, and PM mass remains constant when coagulation takes place [8].
Short-term exposure to airborne particulates increases the risk of cardiovascular and respiratory illness including congestive heart failure, exacerbation of asthma, and respiratory infections. Long-term exposure to airborne particulates is associated with development of cardiovascular disease and respiratory effects including development of asthma and reduced lung function growth [9, 17]
1.3.5 Increased Particulate Emissions from Direct-Injection Engines
A homogeneous stoichiometric mixture of gasoline and air will not normally generate the conditions required for soot formation. GPI engines provide a well mixed near-homogenous
emissions that they are excluded from PM and PN regulation under Euro 6 rules [6]. GDI engines produce increased particulate emissions due to reduced mixing efficiency and increased fuel impingement on cylinder surfaces. Locally rich mixture pockets and liquid fuel droplets and pools provide the conditions needed for soot formation. Figure 1-2 demonstrates the sources of soot in GDI engines.
4
3 x1. Piston wetting
2. Liner wetting
2 4. Interaction spray, air flow, intake valve3. Roof wetting, incl. spark plug
5. Injector deposits
6,5 6. Mixture homogeneity (local rich zones)
7. Diffusion flame (liquid phase)
Figure 1-2 - Soot Sources in a GDI Engine [8]
Direct injection engines have an increased occurrence of locally rich pockets within the cylinder charge. First generation GDI engines utilized stratified charge combustion strategies that required injection during the compression stroke and deliberately generated a fuel rich region near the spark plug. These factors combined to promote increased soot formation compared to GPI engines in use at the time [8]. Current homogenous charge GDI engines maximize charge mixing by injecting during the intake stroke. The fuel air mixture is exposed to the period of highest charge motion and the mixing time is maximized [18]. Implementation of homogenous charge and reductions in cylinder component wetting has reduced both PM and PN emissions by an order of magnitude compared with first generation GDI engine technology [8].
Liquid fuel in the cylinder during combustion leads to diffusion flames that generate soot. GDI suffers from significant fuel impingement on cylinder walls and piston crown. Liquid fuel films
that result from fuel impingement on these surfaces cannot be fully consumed during the primary combustion event. Diffusion flame pool fires will persist from these areas of liquid fuel well after the main combustion is complete. The diffusion flames generate large amounts of soot that account for much of the additional particulate emissions generated by GDI engines compared with GPI engines [14]. Reductions in PM and PN emissions from 1" generation GDI to current
technology are significant but current emissions fall near Tier 3 and Euro 6 PM limits and above the Euro 6 PN limit [8].
1.3.6 Three-way Catalyst
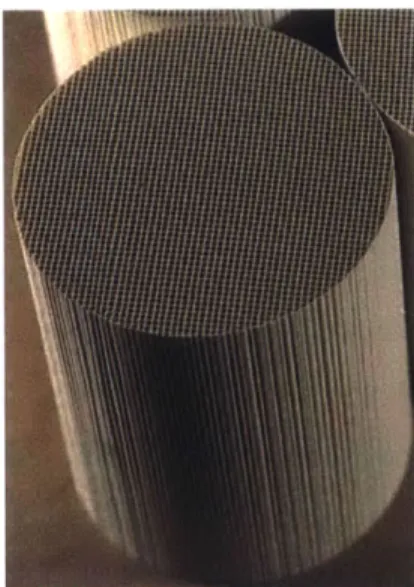
Current gasoline SI engine exhaust treatment is accomplished by the three-way catalyst (TWC), commonly referred to as the catalytic converter. The TWC's purpose is to remove NO,, HC, and CO from the engine out exhaust stream through catalyzed chemical reactions before the exhaust exits the vehicle tailpipe and enters the atmosphere. The catalyst substrate is an extruded ceramic honeycomb with open channels along the flow axis. Figure 1-3 shows the typical geometry of the TWC substrate.
Figure 1-3 - Flow Through Ceramic Catalyst Substrate [191
The ceramic honeycomb walls are coated with alumina (A1203), which acts as a high surface area
carrier and support for catalyst particles in the TWC. Precious metal catalyst particles are deposited in the TWC on the surface of the alumina support to promote chemical oxidation of
CO2 and HC to CO2 and H20. Rhodium particles are present to promote reduction of NO. There
are a series of possible reactions that will remove NO in a reducing atmosphere through reactions
with CO or H2 [10].
For catalyzed oxidation and reduction reactions to occur simultaneously in the TWC, the AFR of the engine must be maintained near stoichiometric within very small tolerances. Maintaining
stoichiometric conditions will maintain proper concentrations of oxygen and reducing gases to allow the three desired reactions to proceed. The AFR tolerance of the TWC is not reasonably achievable during operation of a vehicle engine so designers employ a modulation strategy to maintain a suitable chemical environment in the TWC. The onboard electronic engine control module (ECM) will continuously monitor the exhaust for the presence of oxygen while modulating the AFR around AFRs. A binary oxygen sensor provides feedback on the time span spent above and below AFRs, which the ECM uses to adjust the mean value of the fuel flow modulation. This strategy results in alternating short periods of slightly fuel rich and slightly fuel lean operation. To maintain a suitable oxidizing and reducing environment continuously in the TWC, formulators add an oxygen storage catalyst [10].
Cerium is the primary oxygen storage catalyst utilized in the TWC. The storage catalyst will oxidize under fuel lean exhaust conditions to absorb excess oxygen from the exhaust stream and form cerium oxide (CexOy) [10]. The absorption lowers oxygen levels allowing reduction reactions to proceed. During fuel rich engine operation cerium oxide is reduced in the TWC releasing oxygen molecules needed to continue oxidation of CO and HC. The presence of the oxygen storage catalyst combined with air fuel ratio modulation allows the TWC to continuously remove NO, CO, and HC from the exhaust stream with efficiency greater than 95% [11].
1.3.7 Diesel Particulate Filter
Combustion in a diesel engine predominantly involves a diffusion flame originating from a high-pressure direct fuel injection during combustion. The diffusion flame produces large amounts of soot causing high particulate emissions from diesel engines. Emissions regulations in the United States have required use of diesel particulate filters (DPF) for all medium and heavy duty on-road diesel vehicles since in 2007 [20]. Diesel particulate filters capture PM from the exhaust
stream and have been very successful in reducing tailpipe PM emissions from diesel vehicles with soot filtration efficiencies greater than 95% [20]. After PM is trapped in the filter, the soot and SOF portion are removed by oxidation that converts the PM to stable gaseous compounds. In the case of carbon soot the product in CO2. This process is referred to as regeneration. The
incombustible ash constituents of the trapped PM are not removed during regeneration and remain in the filter until they are physically removed through various methods of filter cleaning.
A DPF is the largest source of backpressure in a diesel engine exhaust system due to the flow resistance of the filtration mechanism in the filter. A clean DPF will create a significant pressure drop across it before any PM is captured. As PM is captured in the filter the pressure drop will increase by up to five times the original level as PM deposits reduce the porosity of the filter in turn reducing the permeability and increasing flow resistance [20]. A portion of this pressure drop increase is recovered when soot particles are removed through regeneration. However, incombustible ash deposits result in a permanent increase in the DPF pressure drop. The pressure drop across the DPF increases the engine exhaust pressure reducing engine power output and fuel efficiency. Power and efficiency losses increase as the filter ages and incombustible ash deposits grow. Typical pressure drop curves for several DPFs are shown in Figure 1-4. Pressure drop is plotted versus ash mass concentration in the filter given in grams of ash per liter of filter volume. These pressure drop measurements are taken with zero soot present in the DPF and represent the permanent increase in the DPF pressure drop during its service life.
-- Periodic Regeneration * Continuous Regeneration 3.5 W 3.0 0-2.5 2.0 1.5 1.0 0.5 0.0 -0 10 20 30 Ash [g/l]
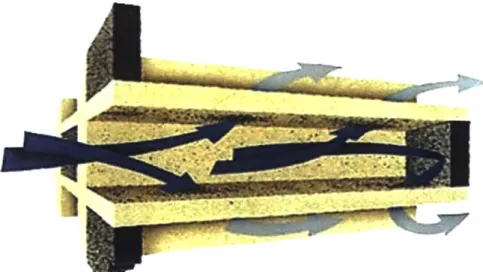
1.3.7.1 Wall Flow Monolith DPF
Several variations on the DPF have been researched and implemented. The primary on-road DPF configuration in use today is the wall flow monolith filter. The substrate of a wall flow monolith DPF is similar to that of a TWC. The DPF starts with an extruded honeycomb structure. It is converted from a flow through to a wall flow device by blocking one end of each flow channel in an alternating checker board pattern at the inlet and outlet faces. This creates inlet and outlet channels open to either the inlet or outlet flow, but not both. Exhaust gas is forced to flow through the porous walls of the honeycomb to pass from an inlet channel to an adjacent outlet channel. PM is filtered from the exhaust gas flow and trapped in the porous network of the channel walls or is deposited on the wall surfaces inside the inlet channels. The flow path and
filtration mechanism is shown in Figure 1-5.
Figure 1-5 - Flow Pattern in a Wall Flow Monolith Filter. Pre-filtration gasses shown in dark blue, post-filtration shown in light blue. [221
1.3.7.2 Regeneration of Wall Flow Monolith DPF
Soot that accumulates in a DPF is removed through oxidation in a process called regeneration. DPF regeneration strategies are characterized in two ways, periodic or continuous and oxygen or NO2 driven. In all cases, regeneration requires sufficient levels of oxidizer and sufficient
temperatures to initiate the chemical oxidation of soot in the DPF. Diesel engines operate fuel lean and generate significant NOx emissions at all operating points. Excess oxygen is present in the exhaust stream for lean operation and NOx can be converted to NO by an oxidation catalyst
meaning that sufficient oxidizer is normally present in the DPF regardless of the oxidation driver used. Therefore DPF regeneration chemistry is temperature limited.
Periodic regeneration entails accumulation of soot in the DPF over a period with minimal soot oxidation. Eventually the accumulated soot is removed from the filter during a finite regeneration period. In this case regeneration is initiated by an increase in the filter temperature above the threshold temperature required for the soot oxidation reaction to commence. The threshold temperature is dependent on the chemistry of the soot oxidation, which will be discussed further with respect to oxygen versus NOx driven regeneration. The increase in temperature to initiate a periodic regeneration can be the result of explicit engine operation routines designed to elevate exhaust temperatures to initiate regeneration or can be the result of normal fluctuations in exhaust temperature across a normal driving cycle [23].
Continuous regeneration requires that the DPF temperature is maintained above the threshold temperature for the applicable oxidation reaction at all times, and below the NOx thermal equilibrium temperature for NOx driven regeneration. Soot reacts with the oxidizer continuously as it is trapped in the DPF. No significant soot accumulation occurs in the DPF during continuous regeneration [23].
Oxygen driven regeneration relies on oxygen as the soot oxidizer. This regeneration type is analogous to the term active regeneration used in literature. The term "active regeneration" is not used here to remove ambiguity regard the root cause of the regeneration event. The minimum temperature required for rapid oxidation of soot with oxygen is 6000C [23]. In diesel applications this normally requires a regeneration system or engine operation strategy that artificially increase the DPF inlet temperature (this is the origin of the term active). This regeneration strategy has grown less common in DPF applications due to development of NOx driven regeneration methods because of the efficiency loss associated with adding energy to the exhaust stream to increase temperature.
elevate exhaust temperatures for regeneration. The minimum temperature required for rapid soot oxidation with NO2 is 3500C [23]. The lower temperature required for regeneration can more
realistically be achieved for diesel engines without adding additional energy to the engine exhaust stream, however sufficient levels of NO2 are not naturally occurring in the engine
exhaust stream. An oxidation catalyst is required to convert NO to NO2 to generate sufficient
oxidizer levels for NOx driven regeneration. A diesel oxidation catalyst (DOC) can be installed upstream of the DPF to generate NO2 and/or oxidation catalyst can be applied directly to the
DPF substrate to generate NO2 in the filter. Soot oxidation in the DPF will return NO2 to NO,
which can then be removed from the exhaust stream by a NOx trapping/reducing device located downstream of the DPF if needed.
1.3.7.3 Typical DPF Materials
Cordierite and Silicon Carbide are the two primary materials used in DPF substrates. Both materials have favorable thermal and porous properties. Silicon Carbide is more resistant to high temperatures with a sublimation temperature of 24000C compared with the 14500C melting
temperature of Cordierite [22]. Cordierite offers better thermal shock resistance and lower cost. An additional drawback of Silicon Carbide is that its higher heat capacity and thermal conductivity may prevent self-sustaining regeneration at marginal exhaust temperatures because the exothermic energy of the soot oxidation cannot effectively raise the local temperature of the DPF [22].
1.3.8 Gasoline Particulate Filter Concept of Operation
Wall flow monolith filters are proposed as one possible option to reduce PM and PN emissions from GDI vehicles to meet Tier 3 and Euro 6 standards [24]. The filtration mechanism for a wall flow gasoline particulate filter (GPF) is identical to that of a DPF. The proven filtration efficiency of this mechanism in diesel applications is sufficient to achieve the PM emission reductions required for implementation of GDI engines [24]. However, it has been suggested that PM emissions can possibly be reduced to meet regulatory limits through engine design and operation strategies without a GPF [16, 8]. Additionally, gasoline engine performance and efficiency are more sensitive to increases in exhaust pressure than diesel engines. Therefore, it is important to fully understand GPF pressure drop performance and associated losses in engine
output and fuel efficiency across its entire service life before implementing GPF as a particulate emissions reduction strategy.
Pressure drop due to soot accumulation is normally more pronounced than pressure drop due to ash deposits per unit mass of material; however, soot accumulation levels can be controlled through regeneration strategies. Ash deposits cannot be easily removed from the GPF. The irreversible pressure drop increase caused by ash deposits must be understood to determine the expected full service life performance of the filter.
1.3.8.1 GPF Installation Location
Two installation locations are proposed for GPF. The underbody position locates the GPF beneath the vehicle chassis in-line with the exhaust piping upstream of the muffler. The close-coupled position places the GPF inside the engine compartment close-coupled directly downstream of the TWC. These positions each have advantages and disadvantages for ease of installation and maintenance access, but the primary characteristic impacting GPF performance is the significant difference in average and peak GPF inlet temperatures for the two positions. Peak inlet temperatures above 9000C are possible in the close-coupled position. Peak inlet temperatures in the underbody position are expected to be below 7000C contingent of exhaust system design. Average temperatures must be maintained at sufficient levels to achieve the regeneration threshold temperature for the oxidation reaction desired; otherwise additional energy must be expended to elevate exhaust temperatures invoking an overall fuel efficiency reduction. Peak filter temperatures resulting from the combination of peak inlet gas temperature and temperature rise from exothermic soot oxidation within the GPF must be maintained below the maximum operating temperature of the GPF substrate. Peak filter temperatures above 1 0000C can also cause detrimental changes in ash deposit morphology that will lead to significant increases in filter pressure drop [25].
1.3.8.2 GPF Regeneration Strategies
Regeneration of soot accumulated in a GPF follows the same chemical processes used in DPF regeneration. The first important distinction between GPF and DPF regeneration strategies is that
excess oxygen present in diesel exhaust is not present in the gasoline case meaning that GPF regeneration strategies must provide sufficient temperature to initiate chemical reaction and elevated oxidizer levels in order for regeneration to proceed.
NOx driven soot oxidation utilized in DPF applications relies on an oxidation catalyst upstream of or in the DPF to generate NO2. The NO2 generation in NOx driven regeneration would
conflicts with the NOx reduction that occurs in the TWC, therefore oxygen is the preferred oxidizer for GPF regeneration.
The gasoline engine must operate at a stoichiometric AFR for all power producing operating points to meet gaseous emissions standards through proper operation of the TWC. This means that continuous GPF regeneration is not feasible due to a lack of oxygen. These factors point to periodic oxygen driven regeneration as the ideal regeneration strategy for GPF.
Periodic oxygen driven regeneration in the GPF requires temperatures greater than 6000C and oxygen concentrations well above typical stoichiometric exhaust conditions to sustain soot oxidation [26]. GDI exhaust temperatures average 650-8000C [10]. Through proper exhaust system design, the GPF inlet temperatures can be maintained above 6000C in the close-coupled or underbody positions when the engine operates under load. In marginal temperature conditions, energy added by the exothermic soot oxidation will sustain regeneration after it commences. The AFR must be modified to provide sufficient oxygen in the exhaust stream to initiate GPF regeneration. This can be achieved by stopping fuel injection during deceleration or coasting [24]. During these short periods of zero power demand fresh air is pumped through some or all of the engine cylinders and supplied to the exhaust stream. Provided that the GPF is at or above the regeneration threshold temperature, the resulting oxygen pulse will result in rapid oxidation of soot accumulated in the GPF. This regeneration strategy provides frequent periodic regenerations that will limit peak soot accumulation levels, limiting soot related GPF pressure
1.3.8.3 Three-way Catalyst Coating of GPF
GPF researchers are currently experimenting with adding TWC coatings to GPF substrates [24,
27]. Full integration of TWC coating in a future GPF design has potential to reduce production cost and total exhaust system back pressure by removing the current TWC substrate and housing from the system. Wall flow monolith filters have been coated with catalysts for DPF applications providing foundational knowledge on the impact of coating on filtration, pressure drop, and structural strength in DPFs [28]. Catalyzed DPFs however have been designed to promote oxidation only. Further understanding of the impact of PM deposits on TWC coatings is needed to confirm that TWC coating in a GPF will be able to provide sufficient reduction of CO, HC, and NOx to meet gaseous emissions limits throughout the GPF's service life.
2. Experimental Plan
The impact of incombustible ash deposits on GPF performance must be understood to provide for proper design and operation of GPF systems to minimize impact on engine output and efficiency. A full understanding of ash deposit formation mechanisms in GPFs and how ash deposits generate irreversible increases in pressure drop could give way to strategies to influence ash deposition to improve GPF performance throughout its service life. Ash deposits have also been shown to impact the effectiveness of catalyst coatings inside DPFs [28]. If TWC coatings are to applied to GPFs it is important to determine the possible reduction in catalyst effectiveness during the filter service life to ensure that all gaseous emissions limits can be met up to the regulatory end of service life of 150,000 road miles set forth in Tier 3 standards [5].
2.1 Accelerated Filter Loading
Close control of filter operating conditions and a short cycle time for aging GPF samples from new to end of service life is required to determine the effect of varied GPF configurations and exhaust conditions on ash deposition and GPF performance. A primary objective of this project is to generate laboratory-aged GPF samples using an accelerated ash loading system. The accelerated loading system facilitates loading GPF samples with oil-derived ash in a highly controlled environment. Filters are loaded in a shorter time span than filters aged on vehicles operating in the field or filters aged with normal exhaust from laboratory engine running on a dynamometer.
2.1.1 Experimental Apparatus
Several accelerated loading techniques are utilized to generate laboratory aged filter samples in DPF and GPF research [29, 30]. Fuel can be doped with oil to ensure in cylinder combustion of the test oil and entrainment of oil derived ash in the engine exhaust [29]. Test oil can also be
injected into the air intake manifold to accelerate ash deposition in the test filter [30]. To improve on these methods a novel system for accelerated ash loading of DPFs was developed in [31]. This system utilizes a burner system that generates exhaust gasses. Lubricating oil is injected into the burner combustion chamber to create elevated levels of lubricant derived ash in the exhaust stream flowing to the test filter. A new accelerated aging system is used for this GPF
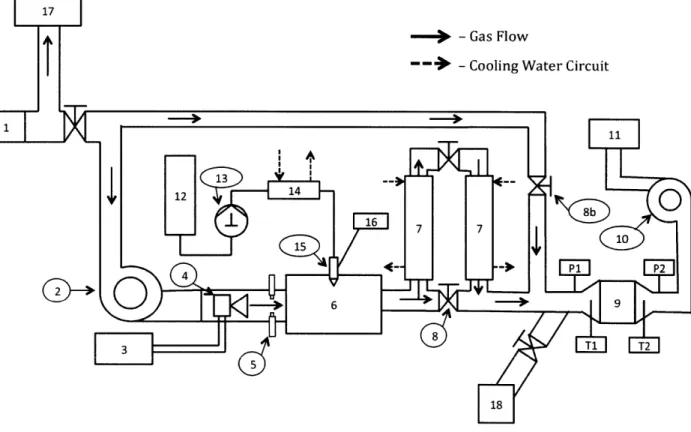
research. It is based on the system outlined in [31] and modified for GPF research. Development of the system is outlined in [32].
The accelerated aging system is shown in Figure 2-1. The system consists of a furnace burner (4) modified to burn gasoline provided by a 30 gallon fuel cell (3). The flame is sustained by three spark plugs (5) that provide continuous ignition. The burner flame is directed into the combustion chamber (6). An air assisted oil injection nozzle (15) located on the cover of the combustion chamber injects oil into the chamber. The oil is burned in the chamber releasing
lubricant derived ash into the exhaust stream.
-Gas Flow
- Cooling Water Circuit
11
12 .i. 16
0
3 -T1
18
Figure 2-1 - GPF Accelerated Ash Loading System with Parallel Dyno Test Engine
1 - Inline Airflow Sensor 8b - Secondary Air Inlet Valve 16 - Compressed Air Supply
2 - Burner System Integral Fan 9 - Test GPF 17 - Air Supply to Test Engine 3 - Fuel Cell 10 - Centrifugal Blower 18 - Exhaust Inlet from Test Engine
4 - Burner System 1 - Exhaust Trench
5 - Continuous Spark Igniters 12 - Test Oil Reservoir 6 - Combustion Chamber 13 - Fluid Metering Oil Pump
7 - Exhaust Gas Cooler 14 - Oil Cooler
8 - Temperature Control By-pass 15 - Air Assisted Oil Injection
Valve Nozzle
The temperature of the exhaust stream is controlled by adjusting a by-pass valve (8) that directs hot gas through a water-cooled heat exchanger (7) when closed. The balance between exhaust gases passing through and by-passing the cooler determines the temperature at the filter inlet. A secondary air inlet valve (8b) located between the exhaust stream cooler and the test filter (9) can be opened to increase the oxygen level in the exhaust stream.
The exhaust stream temperature is monitored along the exhaust flow path to determine proper operation of the system. The GPF inlet (TI) and exhaust (T2) temperatures are measured in the inlet and outlet cones of the filter canister to characterize the filter temperature and inlet flow conditions. The static pressure is measured upstream (P1) and downstream (P2) of the GPF to measure the pressure drop across the filter. Pressure drop across the filter is monitored during all system operations, but all official pressure drop data is taken at room temperature with the burner offline to maintain a consistent reference air density. Flow through the system is generated by a centrifugal blower (10) at the system outlet. During burner operation, an integral fan in the burner system (2) generates additional flow.
The accelerated aging system includes several modifications from the original form discussed in
[32]. The system is capable of delivering stoichiometric exhaust to the filter inlet in an attempt to
replicate the chemical environment in which ash agglomerates form from the ash precursors contained in the exhaust stream. For a given fuel injection configuration there is a small envelope of airflow rates that can be achieved while maintaining stoichiometric exhaust conditions. The oxygen level in the exhaust stream can be elevated by raising the centrifugal blower speed to raise the airflow rate through the burner. Short duration oxygen rich exhaust pulses simulate the deceleration and coasting regeneration strategy discussed in section 1.3.8.2.
The accelerated aging system is installed alongside a 1.6L Ford EcoBoost engine typical of the 2013 Ford Escape. The EcoBoost is a GTDI engine capable of producing peak power of 178hp at 5700rpm and peak torque of 1841b-ft at 2500rpm. Exhaust gases from the engine can be directed to the filter installed on the accelerated aging system for soot loading and engine performance
![Figure 1-1 - Internal Combustion Engine Major Exhaust Constituents as a Function of Equivalence Ratio [10]](https://thumb-eu.123doks.com/thumbv2/123doknet/14094571.464963/19.918.225.677.121.449/figure-internal-combustion-engine-exhaust-constituents-function-equivalence.webp)
![Figure 1-2 - Soot Sources in a GDI Engine [8]](https://thumb-eu.123doks.com/thumbv2/123doknet/14094571.464963/26.918.220.746.286.676/figure-soot-sources-in-gdi-engine.webp)