1 2 3 4 5 6 7 8 9 10 11 12 13 14 15 16 17 18 19 20 21 22 23 24 25 26 27 28 29 30 31 32 33 34 35 36 37 38 39 40 41 42 43 44 45 46 47 48 49 50 51 52 53 54 55 56 57
Detection of HER2
+
Breast Cancer Cells using Bioinspired
DNA-Based Signal Amplification
Sarah D. Rafiee
+,
[a]Samet Kocabey
+,
[a]Michael Mayer,
[b]Jonathan List,*
[b, c]and
Curzio Rüegg*
[a]Circulating tumor cells (CTC) are promising biomarkers for metastatic cancer detection and monitoring progression. How-ever, detection of CTCs remains challenging due to their low frequency and heterogeneity. Herein, we report a bioinspired approach to detect individual cancer cells, based on a signal amplification cascade using a programmable DNA hybridization chain reaction (HCR) circuit. We applied this approach to detect HER2+
cancer cells using the anti-HER2 antibody (trastuzumab) coupled to initiator DNA eliciting a HCR cascade that leads to a fluorescent signal at the cell surface. At 4°C, this HCR detection
scheme resulted in highly efficient, specific and sensitive signal amplification of the DNA hairpins specifically on the membrane of the HER2+
cells in a background of HER2 cells and peripheral blood leukocytes, which remained almost non-fluorescent. The results indicate that this system offers a new strategy that may be further developed toward an in vitro diagnostic platform for the sensitive and efficient detection of CTC.
Breast cancer is the most frequently diagnosed non-skin cancer and is the second leading cause of cancer-related mortality in women in industrialized countries.[1]
HER2+
breast cancer is one of the three clinically relevant biological subtypes of breast
cancer, that also include Estrogen/Progesterone Receptor positive (ER+
/PR+
) and triple negative (i. e. ER , PR and HER2 ) breast cancers (TNBC).[2]
HER2 itself is a cell surface molecule acting as an oncogenic driver through overexpression in this particular breast cancer subset.[3]
The antibody trastuzumab targets the HER2 molecule and is used in the clinics with excellent therapeutic efficacy against HER2+
cancers.[4]
The main cause of mortality is local cancer cell invasion, systemic spreading through the blood and formation of secondary tumors in distant organs, the so-called metastases.[5]
Metastatic breast cancer is usually detected at late stages following clinical symptoms and imaging-based validation (i. e. computer tomog-raphy, magnetic resonance imaging). During dissemination and at advanced, metastatic stage, cancer cells can be detected in the blood of patients as circulating tumor cells (CTC).[6]
Highly sensitive and specific CTC measurement has been proposed as a strategy for early detection of invasive cancers, as well as monitoring progression and response to therapy.[7]
However, due to the low frequency of CTCs (as low as 1 CTC in 106
-108
nucleated blood cells) and heterogeneity (i. e. the lack of universal markers), reliable and quantitative detection of CTCs remains a challenge in clinical practice.[8]
CellSearch from Veridex was the first and so far the only FDA approved method for clinical use to detect CTCs. It is based on antibody-mediated magnetic cell sorting coupled with cellular staining for imaging-based detection.[9]
More recently, several alternatives methodologies[10]
based on electrostatic,[11]
physical cellular characteristics (i. e. size and density),[12]
microfluidic[13]
and lab-on-a-chip[14]
platforms have been developed and explored as potential alternatives.
Nanomaterials, with unique structural and functional prop-erties, including small size, large surface-to-volume ratio, surface modification for targeting and detection, have increasingly gained attention to meet the challenging demands of biomed-ical applications. Many types of nanomaterials have been studied for improving CTC detection and isolation, such as nanowires,[15] dendrimers and stimuli-responsive polymers,[16]
liposomes,[17] graphenes and graphene oxides,[11b] polymeric
nanofibers[18], nano-velcro,[19]quantum dots,[20] magnetic
nano-particles (MNPs),[16]and gold nanoparticles (AuNPs).[20]One main
limiting factor of material-based approaches is that usually only a limited number of particles can bind to the surface, rendering their detection difficult.
Biological organisms developed certain mechanisms for signal amplification such as self-assembly processes (e. g. micro-tubule organization, actin fibers, fibrin coagulation) or signaling pathways where weak signals are transformed into robust [a] S. D. Rafiee,+Dr. S. Kocabey,+Prof. C. Rüegg
Department of Oncology, Microbiology and Immunology Faculty of Science and Medicine
University of Fribourg Chemin du Musée 18, PER17 1700 Fribourg (Switzerland) E-mail: [email protected]
[b] Prof. M. Mayer, Dr. J. List
BioPhysics, Adolphe Merkle Institute University of Fribourg
Chemin des Verdiers 4, PER 18 1700 Fribourg (Switzerland)
[c] Dr. J. List
Physics of Synthetic Biological Systems Technical University Munich Am Coulombwall 4a 85748 Garching (Germany) E-mail: [email protected]
[+] These authors contributed equally to this work.
Supporting information for this article is available on the WWW under https://doi.org/10.1002/cmdc.201900697
© 2020 The Authors. Published by Wiley-VCH Verlag GmbH & Co. KGaA. This is an open access article under the terms of the Creative Commons Attribution Non-Commercial License, which permits use, distribution and reproduction in any medium, provided the original work is properly cited and is not used for commercial purposes.
1 2 3 4 5 6 7 8 9 10 11 12 13 14 15 16 17 18 19 20 21 22 23 24 25 26 27 28 29 30 31 32 33 34 35 36 37 38 39 40 41 42 43 44 45 46 47 48 49 50 51 52 53 54 55 56 57
responses. Mimicking such amplification systems with artificial biochemical reaction circuits could enable bioinspired diagnos-tic techniques for detecting small numbers of cancer cells. DNA is a great material for creating such artificial amplification systems as it can be easily programmed to self-assemble into predictable structures due to its tunable Watson-Crick base pairing interactions. DNA reaction circuits are modular as DNA oligonucleotides can be synthesized cost effectively and can be coupled to various agents such as drugs, non-coding RNAs, proteins, nanoparticles, fluorescent labels and signal amplifying enzymes. When employed as therapeutic and diagnostic agents, small oligonucleotides diffuse much faster and can be delivered more easily than nanomaterials. Furthermore, DNA based systems have a negligible toxicity and immunogenicity.[21]
For sensitive detection, signal amplifying DNA reaction circuits based on toehold-mediated strand displacement like catalytic hairpin assembly have been well established.[22]
Hybridization Chain Reaction (HCR) is particularly interesting for labeling cells and cellular components as it self-assembles from short, fast-diffusing DNA strands and creates long concatemers with hundreds of repeating units, which can carry detection labels that remain on the target structure.[23]
The resulting construct can elicit a variety of signals including fluorescent, colorimetric, electrochemical and chemiluminescent.[24]
In this study we adopted a DNA-based HCR approach for the detection of rare HER2+
breast cancer CTCs. We decided to engineer a system targeting HER2+
cancer cells as HER2 is usually expressed in these cells at high level (102
–103
times over physiological levels) and anti-HER2 antibodies with excellent properties are available, in particular trastuzumab (TZB, human-ized IgG1) used in patients for therapy.[3–4]
In this approach as illustrated in Scheme 1, we used the biotin-streptavidin system to link trastuzumab to the DNA amplification system.
Streptavi-din is Alexa Fluor 488 (AF488) labeled to provide a direct read out of TZB binding to the cell surface.
At first, we employed a system based on an existing DNA HCR amplifier previously designed and reported by the Pierce group.[25]
In this system, the biotinylated initiator (I) or double initiator (DI) strand, coupled to TZB, could hybridize with its complementary fragment of H1 or H2 to trigger the opening of its hairpin structure. In the absence of initiator, the two hairpins of H1 and H2 of the HCR system would not hybridize. The newly exposed sticky end of H1 could then hybridize with its complementary fragment of H2 to open its hairpin structure and expose a sticky end for the following hybridization with the fragment of the next H1. According to this principle, HCR forms a nicked DNA duplex from the H1 an H2 hairpins, and thus creates a strong fluorescence signal due to the fluorescent label on each H1 strand. Detection on cell-targeted DNA complexes can then be determined via flow cytometry or fluorescent microscopy.
To investigate the cell-specific binding efficiency of biotiny-lated TZB to HER2+
breast cancer cells, we used two human breast cancer cell lines with different HER2 expression levels, BT-474 (HER2+
) and MDA-MB-468 (HER2 ). TZB antibody staining and flow cytometry analysis of BT-474 cells showed median cellular fluorescence intensity (MFI) of 90.9, while unstained BT-474 cells had a MFI of 1.06. HER2 breast cancer cells (MDA-MB-468) stained with TZB antibody had a MFI of 0.87 while unstained cells had a MFI of 0.73 (Figure S1). These results showed that HER2 was present on the surface of HER2+
BT-474 cells at levels two orders of magnitude higher compared to HER2 MDA-MB-468 cells.
In order to characterize and validate the performance of a given HCR probe set with respect to signal amplification, we introduced the initiators to the cells, followed by a washing step and addition of both hairpins H1 and H2, at 37°C, with
incubation time of 30 min, 2 h and 4 h, based on published results.[25]
Hybridization of these two strands increased the fluorescence signal in BT-474 cells in comparison to H1 strand alone, however, a strong signal was equally observed in 468 cells (Figure S2). We attributed this signal on MDA-MB-468 cells to nonspecific (i. e. HER2-TZB-independent) binding or internalization of the oligonucleotides or fluorescent dyes.[26]
This signal is not attributable to AF488 streptavidin as demonstrated in Figure S1. At this point, we considered that performing the experiment at 37°C was a possible reason for this high background. The system developed by Choi et al.[25]
was designed to work at 37°C, a temperature at which either specifically or nonspecifically absorbed DNA on the cell surface could be actively internalized by the living cells,[27] while it
reacts extremely slow at low temperatures. Therefore, we designed a new system working at lower temperatures to reduce nonspecific binding to HER2 cells and presumably internalization, while still capable of reacting sufficiently fast at these lower temperatures to produce a HCR. To this end, we tuned the stability and reaction kinetics of the DNA HCR hairpins by changing the length of the hairpin stem and toehold/loop sequence. We chose a toehold length between six and ten nucleotides as it is known that fast rates for strand
Scheme 1. Schematic representation of the strategy to detect HER2+breast
cancer cells with signal amplification cascade based on programmable DNA reaction circuits. (a) Biotinylated anti-HER2 antibody trastuzumab (TZB) targets HER2+breast cancer cells. Alexa Fluor 488 (AF488) labeled
streptavidin makes it possible to connect biotinylated TZB to initiator DNA and provides a direct read out of TZB binding to the cell. The biotinylated initiator is added to the system first, and after a washing step, the mixture of H1 and H2 are added. (b) Metastable hairpins self-assemble upon detection of a cognate initiator. The initiator nucleates with hairpin H1 via base-pairing to a single-stranded toehold, opens the hairpin to form complex with H1 that is labeled with Alexa Fluor 647 (AF647). This complex nucleates with the toehold of hairpin H2 and forms the complex I H1 H2. Thus, the initiator sequence is regenerated, providing the basis for a chain reaction of alternating H1 and H2 polymerization steps. Green and red stars denote fluorophores.
1 2 3 4 5 6 7 8 9 10 11 12 13 14 15 16 17 18 19 20 21 22 23 24 25 26 27 28 29 30 31 32 33 34 35 36 37 38 39 40 41 42 43 44 45 46 47 48 49 50 51 52 53 54 55 56 57
displacement reactions require these toehold lengths at typical experimental conditions.[25,28]
We designed ten different poten-tial HCR systems, consisting of two hairpins and an initiator strand, with varying length of loop/toehold and stem region. We screened the amplification performance of these systems with in situ hybridization studies.
For reducing undesired interactions between the compo-nents of the HCR system and for estimating the binding stability in equilibrium conditions, we engineered these HCR systems using the design feature of the NUPACK web application.[29]
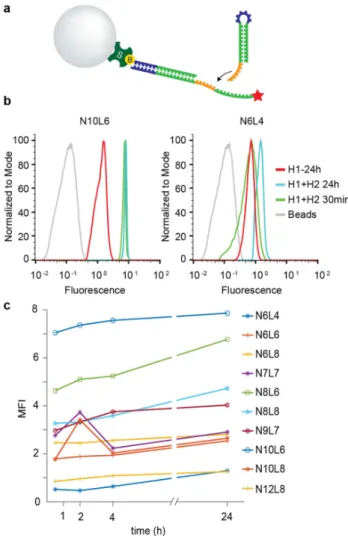
The design and sequences of various DNA strands are shown in Table S1. To screen these potential candidate hairpins, we used streptavidin-coated beads (diameter 5 μm) instead of cells to provide a defined, neutral and stable support for immobilizing biotinylated initiator to start the HCR system. For these experi-ments, we used first Cy5 dye on H1. We incubated streptavidin-coated beads with the initiator at 4°C, 10°C and 20°C, followed by a washing step and the addition of each hairpin H1 and H2, at 4°C, 10°C and 20°C, with incubation time of 30 min, 2 h, 4 h and 24 h. Three out of ten of these oligonucleotides (N10 L6, N8 L8 and N8 L6) showed a good amplification signal. (Figure 1) The detailed screening procedure is displayed in Figure S3.
We selected the HCR circuit that performed best in the bead screening experiment at 4°C (N10 L6, see Figure 1) and
investigated the specificity using HER2+
BT-474 and HER2 MDA-MB-468 cells. In order to obtain maximum fluorescence intensity, we replaced the Cy5 dye with Alexa Fluor 647 (AF647) on H1 hairpins. As described above, we incubated cells first with biotinylated TZB, followed by a washing step and sequential addition of the double initiator, H1 (coupled to AF647) and H2, at 4°C. After 2 h of incubation, we detected an
HCR-depended signal of AF647 on HER2+
BT474 cells by flow cytometry analysis, that was significantly shifted in comparison to H1 alone (Figure 2). This result indicates high-affinity binding and amplification of the hairpins. The MFI of signal amplification of H1-H2 was 409 and that of H1 alone was 117. The unspecific interaction of H1-AF647 with cells were negligible when compared to unlabeled cells (MFI H1:11.6 and MFI control: 0.9). In contrast to BT-474 cells, signal amplification on HER2 MDA-MB-468 cells was weak (MFI-TZBH1H2: 38.4 and MFI H1 : 15.5) demonstrating good specificity and sensitivity of the circuit. Time dependent signal amplification on BT-474 cells demon-strated that there is clear difference in MFI between BT-474 and MDA-MB-468 cells already after 30 min of incubation (MFIBT-474:
147 & MFIMDAMB-468: 15.6). The signal was maximal when cells
were incubated for 2 h and saturated thereafter (Figure S4). These results confirmed the specific labeling and signal amplification on HER2+
breast cancer cells with HCR at 4°C, within short time periods (up to 2 h), validating the proposed design for the activatable diagnostic approach. Since this system saturates fast, it introduces a promising detection platform for fast diagnostics.
To further confirm the specificity and localization of the HCR-based fluorescent signal amplification, we performed confocal laser scanning microscopy on co-cultured HER2+
BT-474 cells and HER2 MDA-MB-468 cells. In order to distinguish the two cell types (independently from the HCR signal
Figure 1. Bead based screening of HCR detection schemes. (a)
Streptavidin-coated beads immobilize the biotinylated initiator to start the hybridization chain reaction in the presence of H1-Cy5 and H2. (b) Flow cytometry analysis of the best (left) and the worst (right) designed oligonucleotides after 30 min and 24 h of hybridization at 4°C. The time-dependent increase in fluorescence with N10 L6 shows the amplification of the signal in comparison with H1 alone. Histograms are normalized to 100 %. (c) Screen-ing of ten oligonucleotides by flow cytometry after 30 min, 2 h, 4 h and 24 h of hybridization.
Figure 2. Flow cytometry analysis of N10 L6 hairpins showing the specific
signal amplification on HER2+breast cancer cells using HCR system. (a) The
complete HCR system showed a fluorescence shift of the AF647 signal in comparison to H1 alone on BT-474 cells. (b) MDA-MB-468 cells showed only negligible amplification of the signal in comparison to H1 alone.
1 2 3 4 5 6 7 8 9 10 11 12 13 14 15 16 17 18 19 20 21 22 23 24 25 26 27 28 29 30 31 32 33 34 35 36 37 38 39 40 41 42 43 44 45 46 47 48 49 50 51 52 53 54 55 56 57
amplification system), MDA-MB-468 cells (HER2 ) were stained with Cell Tracker Green (chloromethyl fluorescein diacetate -CMFDA) for 30 min before mixing with BT474 cells (HER2+
). Mixed cells were seeded and incubated overnight and the following day the HCR system was applied in situ on the adherent cells. After washing and fixation, confocal imaging was performed. The microscopy images as shown in Figure 3, revealed a specific amplification signal on the membrane of the HER2+
BT-474 cells. Amplified signal, based on TZB-mediated labeling and sequential H1-AF647-dependent signal amplifica-tion is clearly seen as continuous-dotted red color at the periphery of BT-474 cells (middle). MDA-MB-468 cells pre-stained with Live Tracker green did not show any H1-AF647 oriented signal amplification. The signal is located on the cell membrane while the cytoplasm remained negative, confirming that there is no HER2-mediated endosomal uptake of the DNA hairpins. These results are consistent with the flow cytometry results (Figure 2) which further confirms the specific labelling and signal amplification of the system.
In order to estimate the potential and sensitivity of our system to detect HER2+
cells among leukocytes, we first mixed BT-474 cells with a monocytic cell line, U937. To ensure HER2-mediated labelling, we checked the TZB binding on mono-nuclear cells using AF488 conjugated TZB. Flow cytometry analysis showed the selective binding of TZB to BT-474 cells (MFI: 523), while the binding to U937 cells was negligible (MFI: 3.4) (Figure S5). In order to test the detection capacity of the HCR system, BT-474 cells were serially diluted before mixing with U937 cells. By using AF488 conjugated streptavidin and AF647 conjugated H1, the amplified signal of BT-474 cells after 2 h of HCR was clearly visible up to 1 : 100 (BT-474:U937) dilution ratio (MFIBT-474: 183, MFIU937: 5.27, CountBT-474: 1138)
further proving the sensitive detection capacity of the system (Figure S6).
To mimic a clinical situation in which CTC are detected in patient-derived blood, we tested the detection of HER2+
BT-474 cells mixed with peripheral blood mononuclear cells (PBMCs) isolated from healthy donors. BT-474 cells were serially diluted before mixing with PBMCs to test the specificity and sensitivity of the system. After 2 h of incubation, cells were analyzed by flow cytometry. The dense populations of lymphocytes and monocytes with low forward scatter (FSC) and side scatter (SSC) values were clearly distinguishable in
comparison to BT-474 cells with high FSC and SSC values (Figure 4). The intensities of HCR amplified fluorescence (AF647) on BT-474 cells were significantly higher than the signal intensities of PBMCs (MFIBT-474: 74.3, MFImonocytes: 6.57,
MFIlymphocytes: 0.64). When BT-474 cells were serially diluted, the
intensity of the signal did not change but the count of the cells progressively decreased showing a linear relationship between the decreasing cell count and the increasing dilution factor. Indeed, the ratio of gated PBMCs and BT-474 cells was highly correlated with the serial dilution when considering the number of counts (Table S2). AF488 signal intensity of BT-474 cells was also progressively decreased upon serial dilutions while it did not change for PBMCs demonstrating that HCR is based on selective labelling of HER2+
cells. Overall, we observed that AF647 fluorescent BT-474 cells were still detectable and distinguishable from the nonspecific signal at up to 1 : 100 (BT-474:PBMC) ratio indicative of the high sensitivity of our system (CountBT-474: 861).
To further investigate the sensitivity and specificity of our system under fully realistic conditions, we spiked serially diluted BT-474 cells directly into peripheral blood obtained from a healthy donor. We then applied our detection system on the isolated PBMC fraction and analyzed the cells (up to 3 × 10⁶
cells) using flow cytometry. HER2+
BT-474 cells were clearly detectable and distinguishable from PBMCs up to 1 : 200 ratio (CountBT-474: 18301, see Table S3 for details) (Figure 5).
In conclusion, we optimized HCR DNA amplification circuits for sensitive detection of viable HER2+
breast cancer cells under clinically relevant conditions. The system was constructed with shorter sequences compared to previously reported HCR systems, allowing reactions to proceed at low temperatures and thereby avoiding unspecific binding and internalization. The redesigned HCR system was tested first using a bead model system. Application of the system on BT474 cells showed high-affinity binding and signal amplification provided by the HCR circuit. Importantly, we were able to detect the presence of cancer cells among PBMC freshly isolated from peripheral blood with virtually no unspecific binding to PBMC. At this point, however, we could only detect one cancer cell among 200 non-cancer cells, which is far away from the expected frequency of CTC in patients (1 : 106–108cells). While this result precludes an
immediate clinical application of the system, it nevertheless proves that sensitivity and specificity under clinical conditions (full blood) are as good as under clean laboratory conditions (cell culture medium / PBS). One limitation may be detection by flow cytometry itself, as the acquisition of a large number of cell counts (2–3 × 10⁶cells) resulted in an increased background
due to auto-fluorescence of the cells masking the specifically labelled cancer cells. To address this limitation, we foresee three potential approaches: the first one is to develop a branching hybridization strategy allowing exponential amplification of the signal intensity at each hybridization step, allowing a better discrimination of the signal from the bulk of autofluorescence. The second could be to circumvent the autofluorescence background by combining the HCR signal amplification system with an ultrasensitive detection technique such as time-resolved fluorescence by integrating molecules with longer
Figure 3. Confocal microscopy of co-cultured HER2+(BT-474) cells and
HER2 (MDA-MB-468) stained with the TZB directed HCR system. (a) Live tracker green channel showing no H1-AF647-dependent signal amplification (b) AF647 red channel, specific amplification signal on the membrane of the HER2+cells (c) Merged channels showing the two mixed cell populations.
1 2 3 4 5 6 7 8 9 10 11 12 13 14 15 16 17 18 19 20 21 22 23 24 25 26 27 28 29 30 31 32 33 34 35 36 37 38 39 40 41 42 43 44 45 46 47 48 49 50 51 52 53 54 55 56 57
fluorescence lifetime, such as lanthanides to the DNA hairpins.[30] Finally, integration of a wide variety of signal
readout moieties such as nanoparticles (e. g. gold, silver, spions, nanodiamonds or quantum dots), by using surface-enhanced Raman scattering (SERS) may also be considered.[31] These
approaches could be tested by introducing modular DNA attachment sites for easy swapping of the moieties.
Acknowledgements
This work was supported by the National Centre of Competence in Research Bioinspired Material (NCCR), the Peter und Traudl Figure 4. Sensitive and specific detection of HER2+BT-474 cells among PBMC by the HER2-targeted HCR amplification system. HCR amplified signal intensities
(AF647) on BT-474 cells were clearly distinguishable from the background fluorescence of PBMCs. By serial dilution of spiked BT-474 cells, the intensity of the streptavidin-AF488 signal per cell did not change but the counts of the cells decreased proportionally to the dilution.
Figure 5. Sensitive and specific detection of HER2+BT-474 cells directly
spiked into the blood. HCR amplified signal was clearly distinguishable up to 1 : 200 dilution of BT-474 cells among 3 million PBMCs.
1 2 3 4 5 6 7 8 9 10 11 12 13 14 15 16 17 18 19 20 21 22 23 24 25 26 27 28 29 30 31 32 33 34 35 36 37 38 39 40 41 42 43 44 45 46 47 48 49 50 51 52 53 54 55 56 57
Engelhorn Foundation, the Medic Foundation, the Swiss National Science Foundation (M.M. grant no. 200021-169304), the Adolphe Merkle Foundation, and the University of Fribourg. We thank Dr. Mohamed Bentires-Alj (University of Basel) for providing cell lines and Dr. Benoît Fellay (Hôpital Fribourgeois) for providing blood samples.
Keywords: biosensors · breast cancer · circulating tumor cells (CTC) · DNA circuits · DNA nanotechnology · hybridization chain reaction (HCR)
[1] R. L. Siegel, K. D. Miller, A. Jemal, Ca-Cancer J. Clin. 2017, 67, 7–30. [2] T. Sorlie, C. M. Perou, R. Tibshirani, T. Aas, S. Geisler, H. Johnsen, T.
Hastie, M. B. Eisen, M. van de Rijn, S. S. Jeffrey, T. Thorsen, H. Quist, J. C. Matese, P. O. Brown, D. Botstein, P. E. Lonning, A. L. Borresen-Dale, Proc.
Natl. Acad. Sci. USA 2001, 98, 10869–10874.
[3] S. Menard, S. M. Pupa, M. Campiglio, E. Tagliabue, Oncogene 2003, 22, 6570–6578.
[4] H. R. Chang, Cancer 2010, 116, 2856–2867.
[5] A. W. Lambert, D. R. Pattabiraman, R. A. Weinberg, Cell 2017, 168, 670– 691.
[6] a) N. Aceto, A. Bardia, D. T. Miyamoto, M. C. Donaldson, B. S. Wittner, J. A. Spencer, M. Yu, A. Pely, A. Engstrom, H. Zhu, B. W. Brannigan, R. Kapur, S. L. Stott, T. Shioda, S. Ramaswamy, D. T. Ting, C. P. Lin, M. Toner, D. A. Haber, S. Maheswaran, Cell 2014, 158, 1110–1122; b) C. L. Chaffer, R. A. Weinberg, Science 2011, 331, 1559–1564.
[7] K. Pantel, M. R. Speicher, Oncogene 2016, 35, 1216–1224.
[8] Q. Huang, Y. Wang, X. Chen, Y. Wang, Z. Li, S. Du, L. Wang, S. Chen,
Nanotheranostics 2018, 2, 21–41.
[9] S. Riethdorf, L. O’Flaherty, C. Hille, K. Pantel, Adv. Drug Delivery Rev.
2018, 125, 102–121.
[10] S. Rawal, Y. P. Yang, R. Cote, A. Agarwal, Annu. Rev. Anal. Chem. 2017,
10, 321–343.
[11] a) W. Waheed, A. Alazzam, B. Mathew, N. Christoforou, E. Abu-Nada, J.
Chromatogr. B: Anal. Technol. Biomed. Life Sci. 2018, 1087–1088, 133–
137; b) S. I. Han, K. H. Han, Anal. Chem. 2015, 87, 10585–10592. [12] P. C. Bailey, S. S. Martin, Cells 2019, 8.
[13] M. Zhou, H. Zheng, Z. Wang, R. Li, X. Liu, W. Zhang, Z. Wang, H. Li, Z. Wei, Z. Hu, Theranostics 2017, 7, 4710–4721.
[14] L. Yu, S. R. Ng, Y. Xu, H. Dong, Y. J. Wang, C. M. Li, Lab Chip 2013, 13, 3163–3182.
[15] C. Wang, M. Ye, L. Cheng, R. Li, W. Zhu, Z. Shi, C. Fan, J. He, J. Liu, Z. Liu,
Biomaterials 2015, 54, 55–62.
[16] a) J. H. Myung, K. A. Tam, S. J. Park, A. Cha, S. Hong, Wiley Interdiscip.
Rev. Nanomed. Nanobiotechnol. 2016, 8, 223–239; b) S. S. Banerjee, V.
Khobragade, J. Khandare, Methods Mol. Biol. 2017, 1530, 271–281. [17] Z. Zhang, M. R. King, Cell. Mol. Bioeng. 2017, 10, 275–294.
[18] W. Jiang, H. Wang, Y. Cui, Y. Lei, Y. Wang, D. Xu, N. Jiang, Y. Chen, Y. Sun, Y. Zhang, J. Cao, Z. Ke, Int. J. Nanomed. 2018, 13, 1633–1642. [19] a) J. F. Chen, Y. Zhu, Y. T. Lu, E. Hodara, S. Hou, V. G. Agopian, J. S.
Tomlinson, E. M. Posadas, H. R. Tseng, Theranostics 2016, 6, 1425–1439; b) Y. J. Jan, J. F. Chen, Y. Zhu, Y. T. Lu, S. H. Chen, H. Chung, M. Smalley, Y. W. Huang, J. Dong, L. C. Chen, H. H. Yu, J. S. Tomlinson, S. Hou, V. G. Agopian, E. M. Posadas, H. R. Tseng, Adv. Drug Delivery Rev. 2018, 125, 78–93.
[20] X. Li, B. Chen, M. He, H. Wang, G. Xiao, B. Yang, B. Hu, Biosens.
Bioelectron. 2017, 90, 343–348.
[21] S. Surana, A. R. Shenoy, Y. Krishnan, Nat. Nanotechnol. 2015, 10, 741– 747.
[22] a) B. Li, A. D. Ellington, X. Chen, Nucleic Acids Res. 2011, 39, e110; b) P. Yin, H. M. Choi, C. R. Calvert, N. A. Pierce, Nature 2008, 451, 318–322; c) D. Y. Zhang, A. J. Turberfield, B. Yurke, E. Winfree, Science 2007, 318, 1121–1125; d) C. Jung, A. D. Ellington, Acc. Chem. Res. 2014, 47, 1825– 1835.
[23] R. M. Dirks, N. A. Pierce, Proc. Natl. Acad. Sci. USA 2004, 101, 15275– 15278.
[24] a) P. Liu, X. Yang, S. Sun, Q. Wang, K. Wang, J. Huang, J. Liu, L. He, Anal.
Chem. 2013, 85, 7689–7695; b) Z. Zhu, J. Lei, L. Liu, H. Ju, Analyst 2013, 138, 5995–6000; c) J. Xu, J. Wu, C. Zong, H. Ju, F. Yan, Anal. Chem. 2013, 85, 3374–3379; d) S. Shimron, F. Wang, R. Orbach, I. Willner, Anal. Chem.
2012, 84, 1042–1048.
[25] H. M. Choi, J. Y. Chang, A. Trinhle, J. E. Padilla, S. E. Fraser, N. A. Pierce,
Nat. Biotechnol. 2010, 28, 1208–1212.
[26] A. Lacroix, E. Vengut-Climent, D. de Rochambeau, H. F. Sleiman, ACS
Cent. Sci. 2019, 5, 882–891.
[27] a) C. M. Sirois, T. Jin, A. L. Miller, D. Bertheloot, H. Nakamura, G. L. Horvath, A. Mian, J. Jiang, J. Schrum, L. Bossaller, K. Pelka, N. Garbi, Y. Brewah, J. Tian, C. Chang, P. S. Chowdhury, G. P. Sims, R. Kolbeck, A. J. Coyle, A. A. Humbles, T. S. Xiao, E. Latz, J. Exp. Med. 2013, 210, 2447– 2463; b) P. C. Patel, D. A. Giljohann, W. L. Daniel, D. Zheng, A. E. Prigodich, C. A. Mirkin, Bioconjugate Chem. 2010, 21, 2250–2256; c) Y. M. Wang, Z. Wu, S. J. Liu, X. Chu, Anal. Chem. 2015, 87, 6470–6474; d) W. Ma, Y. Zhan, Y. Zhang, X. Shao, X. Xie, C. Mao, W. Cui, Q. Li, J. Shi, J. Li, C. Fan, Y. Lin, Nano Lett. 2019, 19, 4505–4517.
[28] D. Y. Zhang, E. Winfree, J. Am. Chem. Soc. 2009, 131, 17303–17314. [29] J. N. Zadeh, C. D. Steenberg, J. S. Bois, B. R. Wolfe, M. B. Pierce, A. R.
Khan, R. M. Dirks, N. A. Pierce, J. Comput. Chem. 2011, 32, 170–173. [30] H. Guo, X. Song, W. Lei, C. He, W. You, Q. Lin, S. Zhou, X. Chen, Z. Chen,
Angew. Chem. Int. Ed. Engl. 2019, 58, 12195–12199.
[31] X. Wu, L. Luo, S. Yang, X. Ma, Y. Li, C. Dong, Y. Tian, L. Zhang, Z. Shen, A. Wu, ACS Appl. Mater. Interfaces 2015, 7, 9965–9971.
Manuscript received: December 13, 2019 Revised manuscript received: December 17, 2019 Accepted manuscript online: January 13, 2020 Version of record online: January 16, 2020
1 2 3 4 5 6 7 8 9 10 11 12 13 14 15 16 17 18 19 20 21 22 23 24 25 26 27 28 29 30 31 32 33 34 35 36 37 38 39 40 41 42 43 44 45 46 47 48 49 50 51 52 53 54 55 56 57
COMMUNICATIONS
Cancer cell detection via an
amplified fluorescence signal: We developed a programmable DNA circuit system based on hybridization chain reaction (HCR); this is a bioins-pired signal amplification approach that allows specific and sensitive detection of HER2+
breast cancer cells among HER2 cells, including freshly isolated peripheral blood mononuclear cells.
S. D. Rafiee, Dr. S. Kocabey, Prof. M. Mayer, Dr. J. List*, Prof. C. Rüegg*
1 – 7
Detection of HER2+Breast Cancer
Cells using Bioinspired DNA-Based Signal Amplification