arXiv:0907.4259v2 [hep-ex] 15 Dec 2009
Measurement of the t-channel single top quark production cross section
V.M. Abazov37, B. Abbott75, M. Abolins65, B.S. Acharya30, M. Adams51, T. Adams49, E. Aguilo6, M. Ahsan59,
G.D. Alexeev37, G. Alkhazov41, A. Alton64,a, G. Alverson63, G.A. Alves2, L.S. Ancu36, M.S. Anzelc53, M. Aoki50,
Y. Arnoud14, M. Arov60, M. Arthaud18, A. Askew49,b, B. ˚Asman42, O. Atramentov49,b, C. Avila8,
J. BackusMayes82, F. Badaud13, L. Bagby50, B. Baldin50, D.V. Bandurin59, S. Banerjee30, E. Barberis63,
A.-F. Barfuss15 , P. Bargassa80 , P. Baringer58 , J. Barreto2 , J.F. Bartlett50 , U. Bassler18 , D. Bauer44 , S. Beale6, A. Bean58, M. Begalli3, M. Begel73, C. Belanger-Champagne42, L. Bellantoni50, A. Bellavance50,
J.A. Benitez65, S.B. Beri28, G. Bernardi17, R. Bernhard23, I. Bertram43, M. Besan¸con18, R. Beuselinck44,
V.A. Bezzubov40 , P.C. Bhat50 , V. Bhatnagar28 , G. Blazey52 , S. Blessing49 , K. Bloom67 , A. Boehnlein50 , D. Boline62, T.A. Bolton59, E.E. Boos39, G. Borissov43, T. Bose62, A. Brandt78, R. Brock65, G. Brooijmans70,
A. Bross50, D. Brown19, X.B. Bu7, D. Buchholz53, M. Buehler81, V. Buescher22, V. Bunichev39, S. Burdin43,c,
T.H. Burnett82 , C.P. Buszello44 , P. Calfayan26 , B. Calpas15 , S. Calvet16 , J. Cammin71 , M.A. Carrasco-Lizarraga34 , E. Carrera49, W. Carvalho3, B.C.K. Casey50, H. Castilla-Valdez34, S. Chakrabarti72, D. Chakraborty52,
K.M. Chan55, A. Chandra48, E. Cheu46, D.K. Cho62, S.W. Cho32, S. Choi33, B. Choudhary29, T. Christoudias44,
S. Cihangir50 , D. Claes67 , J. Clutter58 , Y. Coadou6,d, M. Cooke50 , W.E. Cooper50 , M. Corcoran80 , F. Couderc18 , M.-C. Cousinou15, D. Cutts77, M. ´Cwiok31, A. Das46, G. Davies44, K. De78, S.J. de Jong36, E. De La Cruz-Burelo34,
K. DeVaughan67, F. D´eliot18, M. Demarteau50, R. Demina71, D. Denisov50, S.P. Denisov40, S. Desai50,
H.T. Diehl50 , M. Diesburg50 , A. Dominguez67 , T. Dorland82 , A. Dubey29 , L.V. Dudko39 , L. Duflot16 , D. Duggan49 , A. Duperrin15, S. Dutt28, A. Dyshkant52, M. Eads67, D. Edmunds65, J. Ellison48, V.D. Elvira50, Y. Enari77,
S. Eno61, M. Escalier15, H. Evans54, A. Evdokimov73, V.N. Evdokimov40, G. Facini63, A.V. Ferapontov59,
T. Ferbel61,71, F. Fiedler25 , F. Filthaut36 , W. Fisher50 , H.E. Fisk50 , M. Fortner52 , H. Fox43 , S. Fu50 , S. Fuess50 , T. Gadfort70, C.F. Galea36, A. Garcia-Bellido71, V. Gavrilov38, P. Gay13, W. Geist19, W. Geng15,65, C.E. Gerber51,
Y. Gershtein49,b, D. Gillberg6, G. Ginther50,71, B. G´omez8, A. Goussiou82, P.D. Grannis72, S. Greder19,
H. Greenlee50 , Z.D. Greenwood60 , E.M. Gregores4 , G. Grenier20 , Ph. Gris13 , J.-F. Grivaz16 , A. Grohsjean18 , S. Gr¨unendahl50, M.W. Gr¨unewald31, F. Guo72, J. Guo72, G. Gutierrez50, P. Gutierrez75, A. Haas70, P. Haefner26,
S. Hagopian49, J. Haley68, I. Hall65, R.E. Hall47, L. Han7, K. Harder45, A. Harel71, J.M. Hauptman57, J. Hays44,
T. Hebbeker21, D. Hedin52, J.G. Hegeman35, A.P. Heinson48, U. Heintz62, C. Hensel24, I. Heredia-De La Cruz34,
K. Herner64 , G. Hesketh63 , M.D. Hildreth55 , R. Hirosky81 , T. Hoang49 , J.D. Hobbs72 , B. Hoeneisen12 , M. Hohlfeld22, S. Hossain75, P. Houben35, Y. Hu72, Z. Hubacek10, N. Huske17, V. Hynek10, I. Iashvili69,
R. Illingworth50, A.S. Ito50, S. Jabeen62, M. Jaffr´e16, S. Jain75, K. Jakobs23, D. Jamin15, R. Jesik44, K. Johns46,
C. Johnson70 , M. Johnson50 , D. Johnston67 , A. Jonckheere50 , P. Jonsson44 , A. Juste50 , E. Kajfasz15 , D. Karmanov39, P.A. Kasper50, I. Katsanos67, V. Kaushik78, R. Kehoe79, S. Kermiche15, N. Khalatyan50,
A. Khanov76, A. Kharchilava69, Y.N. Kharzheev37, D. Khatidze77, M.H. Kirby53, M. Kirsch21, B. Klima50,
J.M. Kohli28 , J.-P. Konrath23 , A.V. Kozelov40 , J. Kraus65 , T. Kuhl25 , A. Kumar69 , A. Kupco11 , T. Kurˇca20 , V.A. Kuzmin39, J. Kvita9, F. Lacroix13, D. Lam55, S. Lammers54, G. Landsberg77, P. Lebrun20, H.S. Lee32,
W.M. Lee50, A. Leflat39, J. Lellouch17, L. Li48, Q.Z. Li50, S.M. Lietti5, J.K. Lim32, D. Lincoln50, J. Linnemann65,
V.V. Lipaev40 , R. Lipton50 , Y. Liu7 , Z. Liu6 , A. Lobodenko41 , M. Lokajicek11 , P. Love43 , H.J. Lubatti82 , R. Luna-Garcia34,e, A.L. Lyon50, A.K.A. Maciel2, D. Mackin80, P. M¨attig27, R. Maga˜na-Villalba34, P.K. Mal46,
S. Malik67, V.L. Malyshev37, Y. Maravin59, B. Martin14, R. McCarthy72, C.L. McGivern58, M.M. Meijer36,
A. Melnitchouk66 , L. Mendoza8 , D. Menezes52 , P.G. Mercadante5 , M. Merkin39 , K.W. Merritt50 , A. Meyer21 , J. Meyer24, N.K. Mondal30, R.W. Moore6, T. Moulik58, G.S. Muanza15, M. Mulhearn70, O. Mundal22, L. Mundim3,
E. Nagy15, M. Naimuddin50, M. Narain77, H.A. Neal64, J.P. Negret8, P. Neustroev41, H. Nilsen23, H. Nogima3,
S.F. Novaes5 , T. Nunnemann26 , D.C. O’Neil6 , G. Obrant41 , C. Ochando16 , D. Onoprienko59 , J. Orduna34 , N. Oshima50, N. Osman44, J. Osta55, R. Otec10, G.J. Otero y Garz´on1, M. Owen45, M. Padilla48, P. Padley80,
M. Pangilinan77, N. Parashar56, S.-J. Park24, S.K. Park32, J. Parsons70, R. Partridge77, N. Parua54, A. Patwa73,
B. Penning23, M. Perfilov39, K. Peters45, Y. Peters45, P. P´etroff16, R. Piegaia1, J. Piper65, M.-A. Pleier22,
P.L.M. Podesta-Lerma34,f, V.M. Podstavkov50 , Y. Pogorelov55 , M.-E. Pol2 , P. Polozov38 , A.V. Popov40 , M. Prewitt80, H.B. Prosper49, S. Protopopescu73, J. Qian64, A. Quadt24, B. Quinn66, A. Rakitine43, M.S. Rangel16,
K. Ranjan29, P.N. Ratoff43, P. Renkel79, P. Rich45, M. Rijssenbeek72, I. Ripp-Baudot19, F. Rizatdinova76,
S. Robinson44 , M. Rominsky75 , C. Royon18 , P. Rubinov50 , R. Ruchti55 , G. Safronov38 , G. Sajot14 , A. S´anchez-Hern´andez34, M.P. Sanders26, B. Sanghi50, G. Savage50, L. Sawyer60, T. Scanlon44, D. Schaile26,
R.D. Schamberger72, Y. Scheglov41, H. Schellman53, T. Schliephake27, S. Schlobohm82, C. Schwanenberger45, R. Schwienhorst65 , J. Sekaric49 , H. Severini75 , E. Shabalina24 , M. Shamim59 , V. Shary18 , A.A. Shchukin40 , R.K. Shivpuri29, V. Siccardi19, V. Simak10, V. Sirotenko50, P. Skubic75, P. Slattery71, D. Smirnov55, G.R. Snow67,
J. Snow74, S. Snyder73, S. S¨oldner-Rembold45, L. Sonnenschein21, A. Sopczak43, M. Sosebee78, K. Soustruznik9,
B. Spurlock78 , J. Stark14 , V. Stolin38 , D.A. Stoyanova40 , J. Strandberg64 , M.A. Strang69 , E. Strauss72 , M. Strauss75 , R. Str¨ohmer26, D. Strom51, L. Stutte50, S. Sumowidagdo49, P. Svoisky36, M. Takahashi45, A. Tanasijczuk1,
W. Taylor6, B. Tiller26, M. Titov18, V.V. Tokmenin37, I. Torchiani23, D. Tsybychev72, B. Tuchming18, C. Tully68,
P.M. Tuts70
, R. Unalan65
, L. Uvarov41
, S. Uvarov41
, S. Uzunyan52
, P.J. van den Berg35
, R. Van Kooten54
, W.M. van Leeuwen35, N. Varelas51, E.W. Varnes46, I.A. Vasilyev40, P. Verdier20, L.S. Vertogradov37,
M. Verzocchi50, M. Vesterinen45, D. Vilanova18, P. Vint44, P. Vokac10, R. Wagner68, H.D. Wahl49, M.H.L.S. Wang71,
J. Warchol55 , G. Watts82 , M. Wayne55 , G. Weber25 , M. Weber50,g, L. Welty-Rieger54 , A. Wenger23,h,
M. Wetstein61, A. White78, D. Wicke25, M.R.J. Williams43, G.W. Wilson58, S.J. Wimpenny48, M. Wobisch60,
D.R. Wood63, T.R. Wyatt45, Y. Xie77, C. Xu64, S. Yacoob53, R. Yamada50, W.-C. Yang45, T. Yasuda50,
Y.A. Yatsunenko37 , Z. Ye50 , H. Yin7 , K. Yip73 , H.D. Yoo77 , S.W. Youn50 , J. Yu78 , C. Zeitnitz27 , S. Zelitch81 , T. Zhao82, B. Zhou64, J. Zhu72, M. Zielinski71, D. Zieminska54, L. Zivkovic70, V. Zutshi52, and E.G. Zverev39
(The DØ Collaboration)
1Universidad de Buenos Aires, Buenos Aires, Argentina
2LAFEX, Centro Brasileiro de Pesquisas F´ısicas, Rio de Janeiro, Brazil
3
Universidade do Estado do Rio de Janeiro, Rio de Janeiro, Brazil 4
Universidade Federal do ABC, Santo Andr´e, Brazil
5Instituto de F´ısica Te´orica, Universidade Estadual Paulista, S˜ao Paulo, Brazil
6
University of Alberta, Edmonton, Alberta, Canada; Simon Fraser University, Burnaby, British Columbia, Canada; York University, Toronto, Ontario, Canada and McGill University, Montreal, Quebec, Canada 7
University of Science and Technology of China, Hefei, People’s Republic of China 8
Universidad de los Andes, Bogot´a, Colombia
9Center for Particle Physics, Charles University,
Faculty of Mathematics and Physics, Prague, Czech Republic 10
Czech Technical University in Prague, Prague, Czech Republic
11Center for Particle Physics, Institute of Physics,
Academy of Sciences of the Czech Republic, Prague, Czech Republic 12
Universidad San Francisco de Quito, Quito, Ecuador 13
LPC, Universit´e Blaise Pascal, CNRS/IN2P3, Clermont, France 14
LPSC, Universit´e Joseph Fourier Grenoble 1, CNRS/IN2P3, Institut National Polytechnique de Grenoble, Grenoble, France 15
CPPM, Aix-Marseille Universit´e, CNRS/IN2P3, Marseille, France
16LAL, Universit´e Paris-Sud, IN2P3/CNRS, Orsay, France
17
LPNHE, IN2P3/CNRS, Universit´es Paris VI and VII, Paris, France 18
CEA, Irfu, SPP, Saclay, France
19IPHC, Universit´e de Strasbourg, CNRS/IN2P3, Strasbourg, France
20
IPNL, Universit´e Lyon 1, CNRS/IN2P3, Villeurbanne, France and Universit´e de Lyon, Lyon, France 21
III. Physikalisches Institut A, RWTH Aachen University, Aachen, Germany
22Physikalisches Institut, Universit¨at Bonn, Bonn, Germany
23
Physikalisches Institut, Universit¨at Freiburg, Freiburg, Germany
24
II. Physikalisches Institut, Georg-August-Universit¨at G¨ottingen, G¨ottingen, Germany
25Institut f¨ur Physik, Universit¨at Mainz, Mainz, Germany
26Ludwig-Maximilians-Universit¨at M¨unchen, M¨unchen, Germany
27
Fachbereich Physik, University of Wuppertal, Wuppertal, Germany 28
Panjab University, Chandigarh, India
29Delhi University, Delhi, India
30
Tata Institute of Fundamental Research, Mumbai, India 31
University College Dublin, Dublin, Ireland
32Korea Detector Laboratory, Korea University, Seoul, Korea
33
SungKyunKwan University, Suwon, Korea 34
CINVESTAV, Mexico City, Mexico
35FOM-Institute NIKHEF and University of Amsterdam/NIKHEF, Amsterdam, The Netherlands
36
Radboud University Nijmegen/NIKHEF, Nijmegen, The Netherlands 37
Joint Institute for Nuclear Research, Dubna, Russia
38Institute for Theoretical and Experimental Physics, Moscow, Russia
40
Institute for High Energy Physics, Protvino, Russia 41
Petersburg Nuclear Physics Institute, St. Petersburg, Russia
42Stockholm University, Stockholm, Sweden, and Uppsala University, Uppsala, Sweden
43
Lancaster University, Lancaster, United Kingdom 44
Imperial College, London, United Kingdom
45University of Manchester, Manchester, United Kingdom
46
University of Arizona, Tucson, Arizona 85721, USA 47
California State University, Fresno, California 93740, USA
48University of California, Riverside, California 92521, USA
49Florida State University, Tallahassee, Florida 32306, USA
50
Fermi National Accelerator Laboratory, Batavia, Illinois 60510, USA 51
University of Illinois at Chicago, Chicago, Illinois 60607, USA
52Northern Illinois University, DeKalb, Illinois 60115, USA
53
Northwestern University, Evanston, Illinois 60208, USA 54
Indiana University, Bloomington, Indiana 47405, USA
55University of Notre Dame, Notre Dame, Indiana 46556, USA
56
Purdue University Calumet, Hammond, Indiana 46323, USA 57
Iowa State University, Ames, Iowa 50011, USA
58University of Kansas, Lawrence, Kansas 66045, USA
59
Kansas State University, Manhattan, Kansas 66506, USA 60
Louisiana Tech University, Ruston, Louisiana 71272, USA 61
University of Maryland, College Park, Maryland 20742, USA 62
Boston University, Boston, Massachusetts 02215, USA 63
Northeastern University, Boston, Massachusetts 02115, USA 64
University of Michigan, Ann Arbor, Michigan 48109, USA
65Michigan State University, East Lansing, Michigan 48824, USA
66
University of Mississippi, University, Mississippi 38677, USA 67
University of Nebraska, Lincoln, Nebraska 68588, USA
68Princeton University, Princeton, New Jersey 08544, USA
69
State University of New York, Buffalo, New York 14260, USA 70
Columbia University, New York, New York 10027, USA
71University of Rochester, Rochester, New York 14627, USA
72
State University of New York, Stony Brook, New York 11794, USA 73
Brookhaven National Laboratory, Upton, New York 11973, USA
74Langston University, Langston, Oklahoma 73050, USA
75
University of Oklahoma, Norman, Oklahoma 73019, USA 76
Oklahoma State University, Stillwater, Oklahoma 74078, USA
77Brown University, Providence, Rhode Island 02912, USA
78University of Texas, Arlington, Texas 76019, USA
79
Southern Methodist University, Dallas, Texas 75275, USA 80
Rice University, Houston, Texas 77005, USA
81University of Virginia, Charlottesville, Virginia 22901, USA and
82
University of Washington, Seattle, Washington 98195, USA (Dated: July 24, 2009)
The D0 collaboration reports direct evidence for electroweak production of single top quarks through the t-channel exchange of a virtual W boson. This is the first analysis to isolate an individual single top quark production channel. We select events containing an isolated electron
or muon, missing transverse energy, and two, three or four jets from 2.3 fb−1 of p¯p collisions at
the Fermilab Tevatron Collider. One or two of the jets are identified as containing a b hadron. We combine three multivariate techniques optimized for the t-channel process to measure the t- and
s-channel cross sections simultaneously. We measure cross sections of 3.14+0.94
−0.80 pb for the t-channel
and 1.05 ± 0.81 pb for the s-channel. The measured t-channel result is found to have a significance of 4.8 standard deviations and is consistent with the standard model prediction.
PACS numbers: 14.65.Ha, 12.15.Ji, 13.85.Qk
The D0 and CDF collaborations at the Fermilab Tevatron p¯pCollider have recently observed electroweak production of single top quarks [1, 2], measuring the total single top quark production cross section as well as the Cabibbo-Kobayashi-Maskawa (CKM) matrix element [3] |Vtb| directly. In the standard model (SM), the two
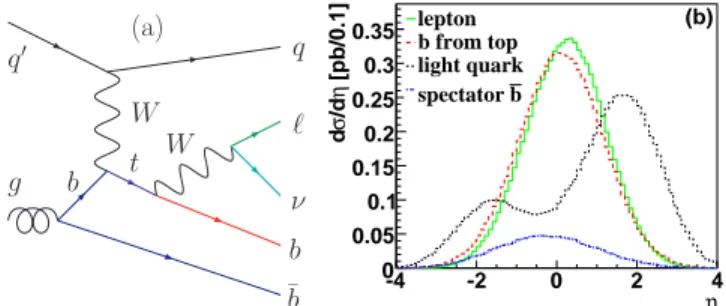
main production modes at the Tevatron resulting in a single top (or antitop) quark final state are the t-channel exchange of a W boson shown in Fig. 1a and the s-channel production via the decay of a virtual W boson. The two observation analyses measured only the combined single top quark cross section, assuming
the SM ratio of the two production modes. This ratio is modified in several new physics scenarios, for example in models with additional quark generations, new heavy bosons [4, 5, 6, 7], flavor-changing neutral currents [8, 9, 10], or anomalous top quark couplings [11, 12, 13, 14, 15]. In this Letter we remove this assumption and use the t-channel characteristics to measure the t-channel and s-channel cross sections simultaneously, thus providing a t-channel measurement independent of the s-channel cross section model. The main characteristic of the t-channel which separates it both from the s-t-channel and the backgrounds is the pseudorapidity distribution of the light quark jet, shown in Fig. 1b. The predicted cross section for t-channel (s-channel) production is 2.34 ± 0.13 pb (1.12 ± 0.04 pb) for a top quark mass mt= 170 GeV [16]. W q ℓ ν b g q′ (a) ¯b t W b η -4 -2 0 2 4 [pb/0.1] η /d σ d 0 0.05 0.1 0.15 0.2 0.25 0.3 0.35 lepton b from top light quark b spectator (b)
FIG. 1: Representative Feynman diagram for t-channel
single top quark production and decay (a) and parton-level pseudorapidity distribution of the final state objects in top production (excluding antitop), requiring each object to have transverse momentum > 15 GeV (b).
This analysis extends the D0 single top evidence [17, 18] and observation analyses [1], utilizing the same dataset, event selection, and signal/background modeling as the observation analysis, but training multivariate filters specifically to extract t-channel single top quark events. We use 2.3 fb−1 of data collected by the D0
experiment [19] at the Fermilab Tevatron p¯p Collider between 2002 and 2007 (Run II). The measurement selects final states containing one high transverse momentum (pT) isolated lepton (electron or muon), large
missing transverse energy (6ET), a b quark jet from the
decay of the top quark (t→W b→ℓνb), a light quark jet produced in association with the top quark, and a spectator b quark jet from gluon splitting in the initial state. We allow for one of these jets not to be identified as well as for the presence of an additional jet from gluon radiation. The backgrounds are W bosons produced in association with jets, t¯t pairs, and multijet production, where a jet is misreconstructed as an electron or a heavy-flavor quark decays to a muon that satisfies isolation criteria. Z+jets and diboson processes form minor additional background components. We treat s-channel single top quark production as a background during the multivariate training but measure its cross section simultaneously with the t-channel measurement as explained below.
We look for t-channel and s-channel single top quark
production in events with two to four jets with pT >
15 GeV and pseudorapidity |η| < 3.4, with the leading jet additionally satisfying pT > 25 GeV. We require
20 < 6ET < 200 GeV for events with two jets and
25 < 6ET < 200 GeV for events with three or four
jets. Events must contain only one isolated electron with pT >15 GeV and |η| < 1.1 (pT >20 GeV for three- or
four-jet events), or one isolated muon with pT >15 GeV
and |η| < 2.0. The background from jets misidentified as leptons is kept to approximately 5% by requiring the total transverse energy of all final state objects HT(ℓ, 6ET,jets)
to be greater than 110 to 160 GeV, depending on the analysis channel, and by demanding that the 6ET is not
along the direction of the lepton or the leading jet in the transverse plane. To enhance the signal fraction, one or two of the jets are required to originate from b hadrons, as implemented through a neural network (NN) b-jet tagging algorithm [20]. We divide the dataset into 24 independent analysis channels (separated by data taking period, lepton type, b-tag and jet multiplicity) and combine the results to maximize the signal sensitivity. Details on the selection criteria and background modeling are given in Ref. [18].
We generate t-channel and s-channel single top events with the SingleTop Monte Carlo (MC) generator [21]. The kinematics of the generated events closely match those predicted by next-to-leading-order (NLO) calculations [22], particularly those including NLO corrections to the t-channel 2 → 3 process shown in Fig. 1a [23]. The alpgen leading-order MC event generator [24], interfaced to pythia [25], is used to model t¯t, W +jets, and Z+jets background events. We use the CTEQ6L1 parton distribution functions (CTEQ6M for single top) [26] and set the top quark mass to 170 GeV. We use geant [27] to simulate the response of the D0 detector to the MC events. The t¯t background is normalized to the predicted cross section [28]. The Z+jets contributions are normalized to NLO cross sections [29]. The W +jets background normalization, jet flavor composition, and jet angular distributions are obtained from data samples. We model the background from multijet production where a jet is misidentified as an isolated electron or muon using events from data containing lepton candidates which pass all of the lepton identification requirements except one, but otherwise resemble the signal events. We use pythia to model diboson production.
We select 4519 lepton+jets events with at least one b-tagged jet, which are expected to contain 130 ± 17 t-channel (93 ± 14 s-t-channel) single top events with an acceptance of (2.5 ± 0.3)% ((3.7 ± 0.5)%). The expected sample composition is shown in Table I.
Systematic uncertainties in the signal and background models are described in detail in Ref. [18]. The main uncertainties are due to the jet energy scale (JES) corrections and the tag-rate functions (TRF), with smaller contributions from MC statistics, correction for jet-flavor composition in W +jets events, and from the
TABLE I: Number of expected and observed events in 2.3 fb−1 for e and µ, and one and two b-tagged analysis channels combined, with uncertainties including both statistical and systematic components. The t-channel and s-channel contri-butions are normalized to their SM expectation.
Source 2 jets 3 jets 4 jets
t-channel 77 ± 10 39 ± 6 14 ± 3
s-channel 62 ± 9 24 ± 4 7 ± 2
W+jets 1829 ± 161 637 ± 61 180 ± 18
Z+jets and dibosons 229 ± 38 85 ± 17 26 ± 7
t¯t → ℓℓ, ℓ+jets 222 ± 35 436 ± 66 484 ± 71
Multijets 196 ± 50 73 ± 17 30 ± 6
Total prediction 2615 ± 192 1294 ± 107 742 ± 80
Data 2579 1216 724
W+jets, multijets, and t¯t normalizations. The total uncertainty on the background is (8–16)% depending on the analysis channel. Uncertainties on JES, TRFs and the modeling of W +jets kinematics affect not only the normalization but also the shape of the discriminant distributions. Since the W +jets background normal-ization and kinematics are constrained by data, theory prediction uncertainties for W +jets are negligible (including those on the parton distribution functions and factorization and normalization scale).
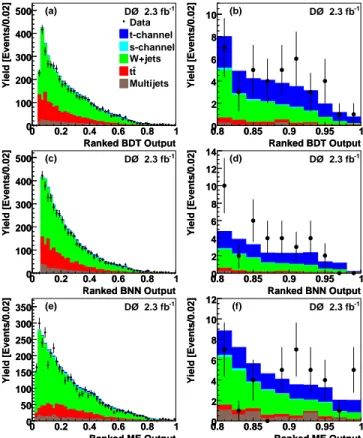
We apply three independent multivariate analysis techniques to separate the small t-channel single top signal from the large backgrounds, based on boosted decision trees (BDT) [30, 31, 32], Bayesian neural networks (BNN) [33, 34], and the matrix element (ME) method [35, 36]. These techniques and their application are described in detail in Ref. [18]. For this analysis we use the same set of variables as in the observation Letter [1]. However, only t-channel single top events are considered signal during the optimization, whereas s-channel single top events are included in the background, normalized to the SM expectation. Fig. 2 shows comparisons between the t-channel signal, the background model, and data for the three individual discriminants.
The three multivariate techniques use the same data sample but are not completely correlated. Their combination leads to increased sensitivity and a more precise measurement of the cross section. We achieve this by training a combination BNN which uses the three individual discriminant outputs as inputs. Fig. 3 shows the combination discriminant output for data superimposed on the background and signal models.
We verify the accurate modeling of the data in background-dominated control regions for the two main background categories. Fig. 4a shows the t-channel discriminant in a W +jets dominated sample of 2-jet, 1-tag events with HT < 175 GeV. Fig. 4b shows the
t-channel discriminant in a t¯t dominated sample of 4-jet, 1-tag or 2-tag events with HT >300 GeV. These studies
confirm that backgrounds are well-modeled across the full range of the discriminant output.
We use a Bayesian statistical analysis [37] to measure the production cross sections. In a first step we compute
Ranked BDT Output 0 0.2 0.4 0.6 0.8 1 Yield [Events/0.02] 0 100 200 300 400 500 (a) DØ 2.3 fb -1 Ranked BDT Output 0 0.2 0.4 0.6 0.8 1 Yield [Events/0.02] 0 100 200 300 400 500 Data t-channel s-channel W+jets t t Multijets Ranked BDT Output 0.8 0.85 0.9 0.95 1 Yield [Events/0.02] 0 2 4 6 8 10 (b) DØ 2.3 fb -1 Ranked BDT Output 0.8 0.85 0.9 0.95 1 Yield [Events/0.02] 0 2 4 6 8 10 Ranked BNN Output 0 0.2 0.4 0.6 0.8 1 Yield [Events/0.02] 0 100 200 300 400 500 (c) DØ 2.3 fb -1 Ranked BNN Output 0 0.2 0.4 0.6 0.8 1 Yield [Events/0.02] 0 100 200 300 400 500 Ranked BNN Output 0.8 0.85 0.9 0.95 1 Yield [Events/0.02] 0 2 4 6 8 10 12 14 (d) DØ 2.3 fb -1 Ranked BNN Output 0.8 0.85 0.9 0.95 1 Yield [Events/0.02] 0 2 4 6 8 10 12 14 Ranked ME Output 0 0.2 0.4 0.6 0.8 1 Yield [Events/0.02] 0 50 100 150 200 250 300 350 (e) DØ 2.3 fb -1 Ranked ME Output 0 0.2 0.4 0.6 0.8 1 Yield [Events/0.02] 0 50 100 150 200 250 300 350 Ranked ME Output 0.8 0.85 0.9 0.95 1 Yield [Events/0.02] 0 2 4 6 8 10 12 (f) DØ 2.3 fb -1 Ranked ME Output 0.8 0.85 0.9 0.95 1 Yield [Events/0.02] 0 2 4 6 8 10 12
FIG. 2: Comparison of the signal and background models to data, for the BDT discriminant (a,b), the BNN discriminant (c,d), and the ME discriminant (e,f), for the full discriminant range (a,c,e) and the signal region (b,d,f). The bins have been ordered by their expected t-channel signal:background ratio and t-channel and s-channel single top distributions are normalized to the measured cross sections.
Ranked t-channel Output 0 0.2 0.4 0.6 0.8 1 Yield [Events/0.02] 0 100 200 300 400 (a) DØ 2.3 fb -1
Ranked t-channel Output 0 0.2 0.4 0.6 0.8 1 Yield [Events/0.02] 0 100 200 300 400 Data t-channel s-channel W+jets t t Multijets
Ranked t-channel Output 0.8 0.85 0.9 0.95 1 Yield [Events/0.02 0 5 10 15 -1 DØ 2.3 fb (b)
Ranked t-channel Output 0.8 0.85 0.9 0.95 1 Yield [Events/0.02 0 5 10 15
FIG. 3: Comparison of the signal and background models to data for the combination discriminant output, for the full
range (a) and only the signal region (b). The bins have
been ordered by their expected t-channel signal:background ratio and t-channel and s-channel single top distributions are normalized to the measured cross sections.
Ranked t-channel Output 0 0.2 0.4 0.6 0.8 1 Yield [Events/0.02] 0 10 20 30 40 50 60 70 80 90 DØ 2.3 fb -1 (a)
Ranked t-channel Output 0 0.2 0.4 0.6 0.8 1 Yield [Events/0.02] 0 10 20 30 40 50 60 70 80 90 Data t-channel s-channel W+jets t t Multijets
Ranked t-channel Output 0 0.2 0.4 0.6 0.8 1 Yield [Events/0.02] 0 10 20 30 40 DØ 2.3 fb -1 (b)
Ranked t-channel Output 0 0.2 0.4 0.6 0.8 1 Yield [Events/0.02] 0 10 20 30 40 Data t-channel s-channel W+jets t t Multijets
FIG. 4: Comparison of the background model to data for the
ranked combination output, for a W +jets (a) and a t¯t (b)
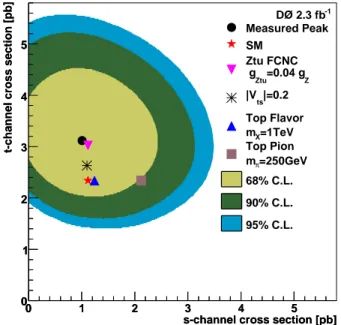
the two-dimensional posterior probability density as a function of both t-channel and s-channel single top quark cross sections. The combination discriminants for t-channel and s-t-channel single top, remaining background, and data are used to build a binned likelihood as a product over all analysis channels and bins. We assume a Poisson distribution for the observed counts, and flat prior probabilities for positive values of the t-channel and s-channel signal cross sections. Systematic uncertainties are described by Gaussian priors, and their correlations amongst all bins in all channels are preserved. The posterior probability density is shown in Fig. 5. Also shown are the SM expectation as well as several represen-tative new physics models to illustrate the sensitivity of this analysis. Dedicated searches should be able to address flavor-changing neutral currents with a Z boson coupling to the top and up quark with a strength of 4% of the SM coupling [4] or a top-color model with a t¯b bound state (Top Pion) with a mass of mπ= 250 GeV [4],
while a 4-quark-generations scenario with CKM matrix element |Vts| = 0.2 [38] or a top-flavor model with new
heavy bosons at a scale mx = 1 TeV [4] will be more
challenging to identify and might have to wait for LHC studies.
s-channel cross section [pb]
0 1 2 3 4 5
t-channel cross section [pb]
0 1 2 3 4 5 Measured Peak SM 68% C.L. 90% C.L. 95% C.L. Z =0.04 g Ztu g Ztu FCNC |=0.2 ts |V =1TeV X m Top Flavor =250GeV π m Top Pion
s-channel cross section [pb]
0 1 2 3 4 5
t-channel cross section [pb]
0 1 2 3 4 5 -1 DØ 2.3 fb
FIG. 5: Posterior probability density for t-channel and s-channel single top quark production in contours of equal
probability density. Also shown are the measured cross
section, SM expectation, and several representative new physics scenarios [4, 38].
In a second step we obtain the t-channel posterior probability density from the two-dimensional posterior in Fig. 5 by integrating over the s-channel axis, thus not making any assumptions about the value of the s-channel cross section. We have analyzed ensembles of pseudo-datasets generated at several different t-channel and s-channel cross sections to verify the linearity of the measured t-channel cross section and its independence
of the input s-channel cross section. From the t-channel posterior we extract the cross section and uncertainty for t-channel single top quark production as 3.14+0.94
−0.80pb.
We similarly extract the s-channel cross section as 1.05 ± 0.81 pb by integrating over the t-channel axis.
We compute the significance of the t-channel cross section measurement using pseudo-datasets generated from the background model (including SM s-channel single top) and taking all systematic uncertainties into account in a log-likelihood-ratio approach [2, 39]. For each pseudo-dataset we calculate the ratio of the probabilities for two hypotheses: that the pseudo-dataset is described by the background model only (including SM s-channel), and that it is described by SM t-channel single top plus backgrounds. We measure the p-value by counting the fraction of background-only pseudo-datasets with a ratio that is more signal-like than the one observed in data. The observed p-value is 8.0 × 10⁻⁷,
corresponding to a Gaussian significance of 4.8σ, and the expected p-value is 9.7 × 10⁻⁵, corresponding to a
Gaussian significance of 3.7σ.
Total Transverse Energy [GeV]
100 200 300 400 500 Yield [Events/20GeV] 0 2 4 6 8 10 -1 DØ 2.3 fb (a)
Total Transverse Energy [GeV]
100 200 300 400 500 Yield [Events/20GeV] 0 2 4 6 8 10 Data t-channel s-channel W+jets t t Multijets
Top Quark Mass [GeV]
100 150 200 250 Yield [Events/10GeV] 0 2 4 6 8 -1 DØ 2.3 fb (b)
Top Quark Mass [GeV]
100 150 200 250 Yield [Events/10GeV] 0 2 4 6 8
(light quark jet)
η × Q(lepton) -4 -2 0 2 4 Yield [Events/0.8] 0 5 10 -1 DØ 2.3 fb (c)
(light quark jet)
η × Q(lepton) -4 -2 0 2 4 Yield [Events/0.8] 0 5 10 T
cos(light quark jet, lepton)
-1 -0.5 0 0.5 1 Yield [Events/0.2] 0 5 10 (d) DØ 2.3 fb -1 T
cos(light quark jet, lepton)
-1 -0.5 0 0.5 1
Yield [Events/0.2]
0 5 10
FIG. 6: HT(a), reconstructed top quark mass (b), light quark
jet pseudorapidity multiplied by lepton charge (c), and t-channel top quark spin correlation (d, see text) for events with a ranked combination output > 0.91. The t-channel and s-channel contributions have been normalized to their measured cross sections.
We have checked the consistency of the observed signal with SM t-channel events in several kinematic distri-butions. Fig. 6 shows comparisons between the observed data, the background model, and the t-channel signal for four different kinematic distributions for events with a ranked discriminant output > 0.91. Shown are four important kinematic variables for t-channel single top quark production: HT; the reconstructed top quark
mass; the lepton charge multiplied by the pseudorapidity of the leading non-b-tagged jet (cf. Fig. 1b); and the t-channel spin correlation in the optimal basis [40, 41], i.e. the cosine of the angle between the light quark jet and the
lepton, both in the reconstructed top quark rest frame. While the background shapes resemble the signal in the high ranked discriminant output region, the presence of the t-channel signal is nevertheless clearly evident in each distribution.
In summary, we have presented the first direct evidence of the t-channel mode of single top quark production using 2.3 fb−1of data at the D0 experiment. We measure
a t-channel cross section of 3.14+0.94
−0.80pb and a s-channel
cross section of 1.05 ± 0.81 pb. The measured cross sections are consistent with the SM expected values. The observed t-channel signal corresponds to an excess over the predicted background with a significance of 4.8 σ.
We thank the staffs at Fermilab and collaborating
institutions, and acknowledge support from the DOE and NSF (USA); CEA and CNRS/IN2P3 (France); FASI, Rosatom and RFBR (Russia); CNPq, FAPERJ, FAPESP and FUNDUNESP (Brazil); DAE and DST (India); Colciencias (Colombia); CONACyT (Mexico); KRF and KOSEF (Korea); CONICET and UBACyT (Argentina); FOM (The Netherlands); STFC and the Royal Society (United Kingdom); MSMT and GACR (Czech Republic); CRC Program, CFI, NSERC and WestGrid Project (Canada); BMBF and DFG (Germany); SFI (Ireland); The Swedish Research Council (Sweden); CAS and CNSF (China); and the Alexander von Humboldt Foundation (Germany).
[a] Visitor from Augustana College, Sioux Falls, SD, USA. [b] Visitor from Rutgers University, Piscataway, NJ, USA. [c] Visitor from The University of Liverpool, Liverpool, UK. [d] Visitor from CERN, Geneva, Switzerland.
[e] Visitor from Centro de Investigacion en Computacion -IPN, Mexico City, Mexico.
[f] Visitor from ECFM, Universidad Autonoma de Sinaloa,
Culiac´an, Mexico.
[g] Visitor from Universit¨at Bern, Bern, Switzerland.
[h] Visitor from Universit¨at Z¨urich, Z¨urich, Switzerland.
[1] V.M. Abazov et al. (D0 Collaboration), Phys. Rev. Lett.
103, 092001 (2009).
[2] T. Aaltonen et al. (CDF Collaboration), Phys. Rev. Lett.
103, 092002 (2009).
[3] N. Cabibbo, Phys. Rev. Lett. 10, 531 (1963);
M. Kobayashi and T. Maskawa, Prog. Theor. Phys. 49, 652 (1973).
[4] T. Tait and C.-P. Yuan, Phys. Rev. D 63, 014018 (2001). [5] V. M. Abazov et al. (D0 Collaboration), Phys. Rev. Lett.
100211803 (2008).
[6] V. M. Abazov et al. (D0 Collaboration), Phys. Lett. B
641, 423 (2006).
[7] T. Aaltonen et al. (CDF Collaboration), Phys. Rev. Lett.
103, 041801 (2009).
[8] M. Hosch et al., Phys. Rev. D 56, 5725 (1997).
[9] V.M. Abazov et al. (D0 Collaboration), Phys. Rev. Lett.
99, 191802 (2007).
[10] T. Aaltonen et al. (CDF Collaboration), Phys. Rev. Lett.
102, 151801 (2009).
[11] C.R. Chen, F. Larios, and C. P. Yuan, Phys. Lett. B 631, 126 (2005).
[12] E. Boos, L. Dudko, and T. Ohl, Eur. Phys. J. C 11, 473 (1999)
[13] A.P. Heinson, A.S. Belyaev, and E.E. Boos, Phys. Rev. D 56, 3114 (1997).
[14] V.M. Abazov et al. (D0 Collaboration), Phys. Rev. Lett.
101, 221801 (2008).
[15] V. M. Abazov et al. (D0 Collaboration), Phys. Rev. Lett.
102, 092002 (2009).
[16] N. Kidonakis, Phys. Rev. D 74, 114012 (2006).
[17] V.M. Abazov et al. (D0 Collaboration), Phys. Rev. Lett.
98, 181802 (2007).
[18] V.M. Abazov et al. (D0 Collaboration), Phys. Rev. D 78, 012005 (2008).
[19] V.M. Abazov et al. (D0 Collaboration), Nucl. Instrum. Methods Phys. Res. A 565, 463 (2006).
[20] T. Scanlon, Ph.D. thesis, Imperial College, University of London, FERMILAB-THESIS-2006-43 (2006).
[21] E. Boos et al., Phys. Atom. Nucl. 69, 1317 (2006); E. Boos et al. (CompHEP Collaboration), Nucl. Instrum. Methods Phys. Res. A 534, 250 (2004).
[22] Z. Sullivan, Phys. Rev. D 70, 114012 (2004).
[23] J.M. Campbell, R. Frederix, F. Maltoni and
F. Tramontano, Phys. Rev. Lett. 102, 182003 (2009). [24] M.L. Mangano et al., JHEP 07, 001 (2003). We used
alpgenversion 2.05.
[25] T. Sj¨ostrand et al., arXiv:hep-ph/0308153 (2003). We
used pythia version 6.323.
[26] J. Pumplin et al., JHEP 07, 012 (2002); D. Stump et al., JHEP 10, 046 (2003).
[27] R. Brun and F. Carminati, CERN Program Library Long Writeup W5013, 1993 (unpublished). We used geant version 3.21.13.
[28] N. Kidonakis and R. Vogt, Phys. Rev. D 68, 114014
(2003). At mt= 170 GeV, σ(p¯p → t¯t+ X) = 7.91 pb.
[29] J.M. Campbell, R.K. Ellis, Phys. Rev. D 65, 113007 (2002). We used MCFM version 5.1.
[30] L. Breiman et al., Classification and Regression Trees (Wadsworth, Stamford, 1984).
[31] J.A. Benitez, Ph.D. thesis, Michigan State University, FERMILAB-THESIS-2009-31 (2009).
[32] D. Gillberg, Ph.D. thesis, Simon Fraser University, FERMILAB-THESIS-2009-20 (2009).
[33] R.M. Neal, Bayesian Learning for Neural Networks (Springer-Verlag, New York, 1996).
[34] A. Tanasijczuk, Ph.D. thesis, Universidad de Buenos Aires, in preparation.
[35] V.M. Abazov et al. (D0 Collaboration), Nature 429, 638 (2004).
[36] M. Pangilinan, Ph.D. thesis, Brown University, in preparation.
[37] I. Bertram et al., FERMILAB-TM-2104 (2000). [38] J. Alwall et al., Eur. Phys. J. C 49, 791 (2007).
[39] C. Amsler et al. (Particle Data Group), Phys. Lett. B
667, 1 (2008).
[40] G. Mahlon and S.J. Parke, Phys. Rev. D 55, 7249 (1997). [41] Q. H. Cao et al., Phys. Rev. D 72, 094027 (2005).