HAL Id: hal-03093987
https://hal.archives-ouvertes.fr/hal-03093987
Submitted on 5 Jan 2021
HAL is a multi-disciplinary open access
archive for the deposit and dissemination of
sci-entific research documents, whether they are
pub-lished or not. The documents may come from
teaching and research institutions in France or
abroad, or from public or private research centers.
L’archive ouverte pluridisciplinaire HAL, est
destinée au dépôt et à la diffusion de documents
scientifiques de niveau recherche, publiés ou non,
émanant des établissements d’enseignement et de
recherche français ou étrangers, des laboratoires
publics ou privés.
Kuzma Strelnikov, Jimmy Debladis, Juliette Salles, Marion Valette, Carine
Mantoulan, Denise Thuilleaux, Virginie Laurier, Catherine Molinas, Pascal
Barone, Maïthé Tauber
To cite this version:
Kuzma Strelnikov, Jimmy Debladis, Juliette Salles, Marion Valette, Carine Mantoulan, et al.. A
study of voice and non-voice processing in Prader-Willi syndrome. Orphanet Journal of Rare Diseases,
BioMed Central, 2020, 15, �10.1186/s13023-020-1298-8�. �hal-03093987�
R E S E A R C H
Open Access
A study of voice and non-voice processing
in Prader-Willi syndrome
Kuzma Strenilkov
1,2,3*, Jimmy Debladis
1,2, Juliette Salles
1,2,4, Marion Valette
4, Carine Mantoulan
4, Denise Thuilleaux
5,
Virginie Laurier
5, Catherine Molinas
4, Pascal Barone
1,2†and Maïthé Tauber
4,6†Abstract
Background: Prader-Willi syndrome (PWS) is a rare and complex neurodevelopmental disorder of genetic origin. It manifests itself in endocrine and cognitive problems, including highly pronounced hyperphagia and severe obesity. In many cases, impaired acquisition of social and communication skills leads to autism spectrum features, and individuals with this syndrome are occasionally diagnosed with autism spectrum disorder (ASD) using specific scales. Given that communicational skills are largely based on vocal communication, it is important to study human voice processing in PWS.
We were able to examine a large number of participants with PWS (N = 61) recruited from France’s national reference center for PWS and other hospitals. We tested their voice and nonvoice recognition abilities, as well as their ability to distinguish between voices and nonvoices in a free choice task. We applied the hierarchical drift diffusion model (HDDM) with Bayesian estimation to compare decision-making in participants with PWS and controls.
Results: We found that PWS participants were impaired on both voice and nonvoice processing, but displayed a compensatory ability to perceive voices. Participants with uniparental disomy had poorer voice and nonvoice perception than participants with a deletion on chromosome 15. The HDDM allowed us to demonstrate that participants with PWS need to accumulate more information in order to make a decision, are slower at decision-making, and are predisposed to voice perception, albeit to a lesser extent than controls.
Conclusions: The categorization of voices and nonvoices is generally preserved in participants with PWS, though this may not be the case for the lowest IQ.
Keywords: Prader-Willi syndrome, Voice processing, Social interactions, Autism spectrum disorder Background
Prader-Willi syndrome (PWS) is a rare genetic disease that was first described in 1956. It is caused by the absence or inactivation of paternal genes in the 15q11.2-q13 region of chromosome 15. The absence of gene expression is due to one of the following genetic subtypes: q11–13 de novo dele-tion on chromosome 15 of paternal origin (DEL; 60% inci-dence); chromosome 15 maternal uniparental disomy (UPD; 35%) [1]. Nowadays, diagnosis is made during the first months of life, and the prevalence of each genetic
subtype currently stands at 50% for DEL and 50% for non-DEL. The main diagnostic criteria for PWS are severe hypo-tonia at birth, associated with difficulty sucking and swal-lowing, which causes low weight gain with failure to thrive [2]. Around the age of 2–3 years, although no change in
food intake is observed [3], excessive weight gain occurs, followed by a sudden behavioral change that manifests itself as eating disorders leading to the hyperphagia that charac-terizes this disease. During early childhood and adolescence, cognitive disorders and a mild or moderate mental deficit emerge alongside this behavioral disturbance. Although an overall delay in the acquisition of certain skills (motor, com-munication, cognitive) often leads to the behavioral alter-ations similar to autism spectrum disorder (ASD), it is only fully diagnosed in 20–40% of PWS cases [4,5].
© The Author(s). 2020 Open Access This article is distributed under the terms of the Creative Commons Attribution 4.0 International License (http://creativecommons.org/licenses/by/4.0/), which permits unrestricted use, distribution, and reproduction in any medium, provided you give appropriate credit to the original author(s) and the source, provide a link to the Creative Commons license, and indicate if changes were made. The Creative Commons Public Domain Dedication waiver (http://creativecommons.org/publicdomain/zero/1.0/) applies to the data made available in this article, unless otherwise stated.
* Correspondence:kuzma.strelnikov@cnrs.fr
†Pascal Barone and Maïthé Tauber contributed equally to this work. 1Brain & Cognition Research Center (CerCo), University of Toulouse Paul
Sabatier, Toulouse, France
2Brain & Cognition Research Center (CerCo), CNRS, Toulouse, France
Given the similarities with ASD in terms of social be-havioral alterations, it is important to study participants’ communication skills, which include both human voice and face processing [6]. Voices, just like faces, can tell us a great deal about individuals. Beyond the linguistic as-pect, voices make it possible to identify the type of per-son, as well as that person’s age, identity, and sometimes corpulence [7]. Prosody also gives us access to individ-uals’ emotions and states of mind. Although there is a large body of knowledge about face processing distur-bances in ASD, some studies have also demonstrated that voice processing can be impaired in autism [8, 9]. This voice processing difficulty could cause social inter-action disorders or be linked to the lack of social motiv-ation found in autism [10].
Little is known about voice processing in PWS. These participants are described as having difficulty discrimin-ating vocal sounds [11], but it is still unclear whether voices, being socially important entities, are considered as a separate category, as is the case in a healthy popula-tion. We therefore set out to explore the voice recogni-tion skills of participants with PWS by administering a simple two-alternative forced-choice task (2FAC) adapted to their intellectual disability (ID). Importantly, we were able to collect the data of more than 60 partici-pants with this rare pathology. This large cohort of par-ticipants has also allowed us to analyze and compare the genetic subtypes that are differently impaired on face processing [12].
One of the aims of our study was to evaluate the origins of social information processing deficits in PWS. The large amount of data we collected allowed us to apply a specific model (hierarchical drift diffusion model, HDDM [13]; to clearly differentiate any sensorimotor deficit from a cogni-tive deficit related to decision-making in a 2FAC protocol. In most psychological tests of sensory processing to date [11], participants with PWS have systematically had longer reaction times (RTs), which have been attributed to early developmental deficits in sensorimotor integration skills [14]. The HDDM would allow us to study the neurocogni-tive implementation of psychological decision making pro-cesses. It might help us to decipher whether the slower RTs of participants with PWS can be attributed to particu-lar features of their cognitive processing, such as the need to accumulate information in order to make choices.
In addition, there is now a large body of evidence that when social cognition is evaluated in ASD, participants can present performance levels close to those of typically developed (TD) controls, reflecting the adoption of adaptive strategies [15]. In some cases, these results can be explained by the fact that the experimental protocol elicited the explicit use of social cognition mechanisms. When it comes to dissociating implicit from explicit mechanisms, a free sorting task (FST) constitutes a good
alternative to 2FAC protocols, as it can even be per-formed by young children [16]. We developed an FST with different types of natural environmental sounds, in-cluding voice sounds. In this test, participants can group items on the basis of either perceptual criteria (pitch, in-tensity, rhythmicity, etc.) or semantic criteria (everyday listening). In the latter case, categorization relies on the internalization of auditory objects, but this can be im-paired in participants with disorders such as ASD [17]. In addition, the FST protocol makes it possible to analyze participants’ hierarchical representation of nat-ural sounds, and yields a clear assessment of their impli-cit categorization.
Results
Hit rates and reaction times
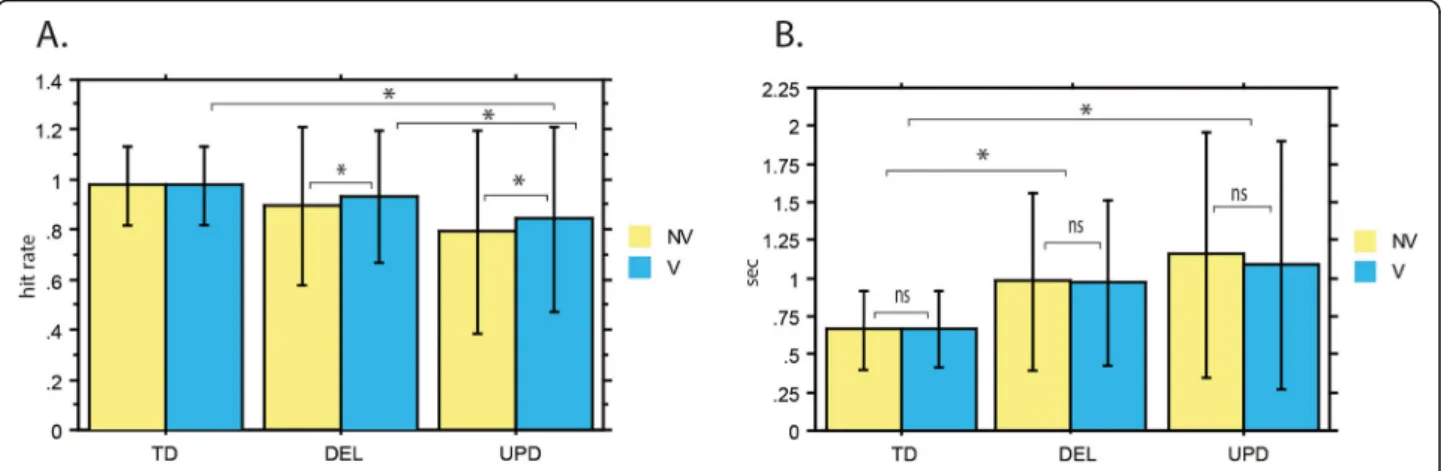
Voice identification is a relatively simple and easy task, and controls achieved a high level of performance (hit rate of over 97% for both vocal and nonvocal stimuli). An inspection of performance data indicated that PWS participants exhibited deficits in this task. In both PWS participant subgroups, performances were below 95% on average, but we observed considerable variability in indi-vidual performance levels. To pinpoint the differences in performance between the PWS participant subgroups and the control group, we entered their hit rates into the general linear mixed-effect model. This allowed us to es-timate performances for both voices and nonvoices within each group, and differences in performance be-tween the groups for each type of stimulus (Fig.1).
The analysis of hit rates (Fig. 1a) revealed a significant effect of group (p < 0.001). Using post hoc tests to ex-plore the effect of group, we found that for voices, UPD participants had a lower mean hit rate than controls (84% vs. 97%, p < 0.001). However, the difference with controls for voice perception only tended toward signifi-cance for DEL participants (92% vs. 97%, p = 0.0522). Thus, compared with controls, UPD participants had a pronounced deficit for voice perception, whereas this deficit was quite weak for the DEL participants. Import-antly, we also observed a significant difference on voices when we directly compared the PWS participant sub-groups: UPD had lower hit rates for voices than DEL (84% vs. 92%, p < 0.001). This confirmed that UPD par-ticipants have a greater voice perception deficit than DEL participants.
Concerning nonvoices, the mean hit rate was signifi-cantly lower for DEL (89%, p < 0.001) and UPD (79%, p < 0.001) participants than for controls (97%) (Fig. 1a). This means that both PWS subgroups were deficient in nonvoice perception. Similarly to the above results for voices, UPD participants also had a lower hit rate than DEL participants for nonvoices (79% vs. 89%, p < 0.001). The UPD participants therefore had a more pronounced
deficit than the DEL participants for both types of stimulus.
In addition to the significant main effect of group, the analysis of hit rates revealed a significant effect of stimu-lus (p < 0.001), as well as a significant Group x Stimustimu-lus interaction (p < 0.05) (Fig. 1a). To see the directions of these effects, we examined the interaction further by running post hoc comparisons. These indicated that the difference in hit rates between voices and nonvoices was not significant for controls (p = 0.842), whereas hit rates were significantly higher for voices than for nonvoices in both the DEL (p < 0.001) and UPD (p < 0.01) participant subgroups. Thus, the equality of performance for voices and nonvoices in controls was not observed in PWS par-ticipants. Both PWS subgroups performed more poorly on nonvoices than on voices, possibly reflecting more pronounced compensation effects for such socially im-portant stimuli as voices.
We also searched for correlations between hit rates and general intelligence (IQ) or clinical (DBC) scores, but none were found.
As previously observed adopting a simple discrimin-ation approach [11], participants with PWS responded much more slowly to the vocal/nonvocal stimuli. Over-all, mean RTs were about 50% longer for PWS partici-pants than for controls (1005 ms vs 660 ms) but the only significant effect was for group (p < 0.001) (Fig.1b). For both voices and nonvoices, post hoc tests showed that DEL and UPD participant subgroups had longer RTs than controls (p < 0.001). PWS participants’ longer RTs, taken together with their lower hit rates, may reflect a deficit in the perception of voices and nonvoices. Fur-thermore, for both voices and nonvoices, UPD partici-pants had longer RTs than DEL participartici-pants did (p <
0.05). UPD participants also had lower hit rates than DEL participants, so the longer RTs support the notion of a more pronounced deficit for voice and nonvoice perception in UPD participants.
HDDM parameters
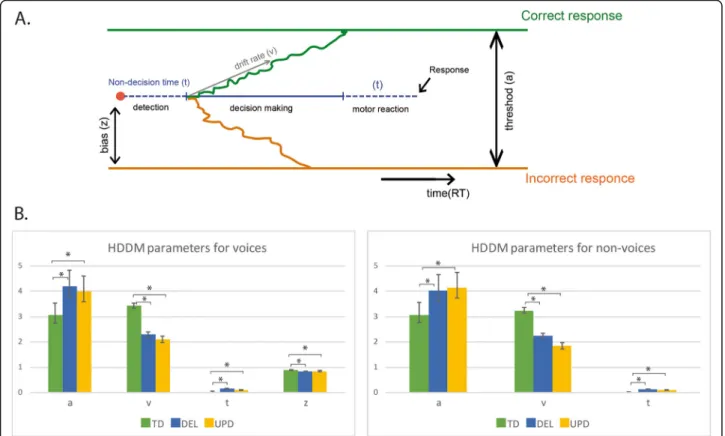
The Bayesian estimation of the HDDM (Fig. 2a) indi-cated that in order to make a decision, participants had to integrate a certain amount of information represented by a threshold, at a specific speed represented by a drift rate. Nondecision time corresponded to the time re-quired to execute the motor control and detect the stimulus (i.e., excluding time involved in decision-making). The total RT can be regarded as a combination of these parameters. We estimated the differences in the HDDM parameters between the groups of PWS partici-pants and controls. For voice identification, participartici-pants with PWS had a higher threshold, lower drift rate, and longer nondecision time than controls (Fig. 2b). The threshold of participants with PWS was about 30% higher than that of controls, indicating that they needed to accumulate more information before making a deci-sion about a perceived stimulus. This accumulation also took longer, as expressed by the lower drift rate. How-ever, nondecision time was also longer, indicating slower stimulus perception and response execution in PWS par-ticipants. When all these parameters are considered to-gether, it is clear that the greater deficit observed in the voice discrimination task originated from differences with controls on both threshold and drift rate values.
A similar pattern of HDDM parameters was found for nonvoices, as PWS participants also had a higher thresh-old, lower drift rate, and longer nondecision time than
Fig. 1 Performance on voice (V) and nonvoice (NV) processing. This figure illustrates the performance of typically developed (TD) subjects, participants with the chromosome 15 deletion (DEL) and uniparental disomy (UPD) in terms of their hit rates (a) and reaction times (b) for Voice (V) or Non-voice (NV) stimuli. Concerning hit rates, participants with PWS, especially UPD participants, were deficient in the recognition of voices and non-voices. This deficit was slightly weaker for voices than for non-voices in both genetic subgroups. To avoid clutter, only significant effects for voices are indicated in the figure as (*). The deficit in hit rates was accompanied by significantly longer reaction times with no difference between voices and non-voices
controls (Fig.2). Thus, participants with PWS used simi-lar strategies for both voice and nonvoice perception.
Regarding the distinction between participants with DEL or UPD, no significant differences were found on the HDDM parameters.
In a separate model including voices and nonvoices, we found an initial bias toward voices in all the groups, but this bias was higher in controls than in participants with PWS (Fig. 2b, z values). This means that controls were automatically more predisposed to perceive voices - a bias that was not so strongly present in participants with PWS.
Sound categorization task
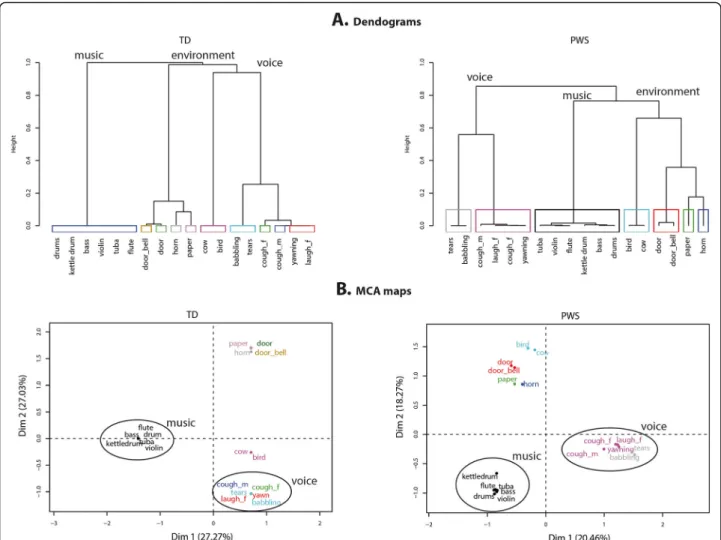
In line with our previous results, controls’ categorization was predominantly based on semantic information, as a result of identifying a sound source. The tree diagrams (Fig. 3a) show that controls categorized sounds as vocal, musical, or environmental sounds. Interestingly, the dia-gram showing categorization by participants with PWS is very similar, as the same three categories emerge from the first branches. This suggests that PWS participants
made their categorization based on the same semantic criteria and according to the same hierarchical order. However, in the diagram, the between-category distance is clearly greater for controls than for participants with PWS, indicating that controls adopted a more homoge-neous categorization strategy, where the categories were more clearly separated.
M ultiple correspondence analysis (MCA) was applied to the categorization performed by the two groups of par-ticipants in order to assess their overall categorization strategies. Analysis was restricted to the dimensions that explained the most variance within the original data, and we only report results for the first two dimensions, which together accounted for 54% of the total variance for con-trols and 39% for participants with PWS. In the MCA maps (Fig. 3b), the first dimension clearly reflects a dis-tinction between voices and instruments for both the PWS participant and control groups. However, whereas the second dimension reflects a division between environ-mental sounds and animal sounds for controls, partici-pants with PWS grouped animal and environmental sounds together. This absence of segregation of animal
Fig. 2 Hierarchical drift diffusion model for voices and nonvoices. This figure provides a scheme of the Bayesian estimation of the drift-diffusion model (a). The drift-diffusion model makes it possible to assess how much information individuals need to make a decision, thus separating decision criteria from non-decision processes. Different parameter of decision making are obtained (see Methods): the threshold (a); the drift rate (v) the non-decision reaction time (t) and the initial bias (z). The differences between the groups of participants concerning these parameters of the model are provided and compared in (b). For both voice and non-voice identification, DEL and UPD participants exhibited a similar pattern of changes in model parameters with respect to the TD participants. They had a higher threshold, a lower drift rate and longer non-decision times than controls. Their bias for voices was lower than in controls. Other conventions as in Fig.1
vocalizations by PWS participants appears to be the main difference in strategy between the two groups.
Furthermore, in order to analyze how clearly human voice stimuli were categorized, we compared the Euclid-ean distances between the categories of voices and other sounds (nonvoices). These comparisons revealed no sig-nificant difference on distances between controls and PWS participants (p > 0.05). However, within the voice category, as well as within the other categories formed by the participants with PWS, the distances between the stimuli were significantly greater than they were within the categories formed by controls (p < 0.05). This means that PWS participants grouped together sounds with greater variability than controls.
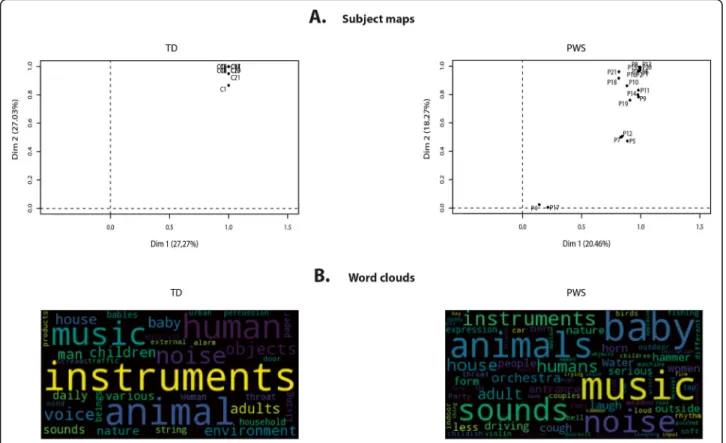
This variability was confirmed when we analyzed the participants’ maps, which indicated the degree of homo-geneity of categorization within each group (Fig. 4a). This representation demonstrated that all controls ex-tensively used both the first and second classification
dimensions, as all controls had values above 0.8 for each dimension. There was a rather different picture for PWS participants, as one subgroup (n = 2) did not use either of these two dimensions, while another subgroup (n = 3) extensively used the first dimension, but only moderately the second dimension. Of interest, the IQ scores of par-ticipants with PWS in these two subgroups were in the lowest range (45–51). However, when we looked at cor-relations between IQ, DBC, and dimension use, none of them was statistically significant. Nonetheless, Dimen-sion 1 (separating musical from vocal sounds) was sig-nificantly correlated with PWS participants’ hit rate for voices (r = 0.55, p < 0.01), thus confirming that it corre-sponded to the separation of vocal from nonvocal stim-uli, and that the PWS participants’ categorization strategy was based on their ability to discriminate be-tween the two types of stimuli.
Lastly, we conducted a word cloud analysis of partici-pants’ descriptions of their sound categories (Fig. 4b).
Fig. 3 Dendograms and MCA maps for sound categorization by participants with Prader-Willi syndrome and typically developed controls. In a, the branches corresponding to the largest categories are named. In b, the circled sound categories are voice and musical instruments. Both the tree diagrams (a) and MCA maps (b) showed that participants with PWS created the similar voice, instruments and environmental categories
These word clouds showed that participants with PWS and controls produced broadly similar descriptions, the most frequently used words being ones relating to music and animals. This clearly indicates that PWS participants categorized sounds on semantic not acoustic criteria. However, PWS participants also frequently used the words sounds and noise, which featured less prominently in the controls’ word clouds. This may reflect a lack of ability to produce precise verbal descriptions of the sounds.
Discussion
Social interactions and voice processing in PWS
Like individuals with ASD, participants with PWS display problems in social functioning, characterized by a reduced ability to interpret and respond to social information [4]. Their empathy deficit, combined with social withdrawal, prevents them from engaging in harmonious peer-group relationships [6, 18, 19]. It is only natural to assume that their social interaction difficulties are related to deficits in processing the two major sources of information in hu-man communication: the huhu-man face and voice [20, 21]. Concerning facial information processing, participants
with PWS have a known facial recognition deficit related to an altered strategy of face exploration [12]. Belin et al. [22] suggested that the human face and voice constitute a fused entity-in which case, face processing deficits should be accompanied by voice processing deficits. According to Salles et al. [11], participants with PWS present a specific deficit in distinguishing voices from nonvoices. However, it remains unclear whether their voice identification is also impaired and whether this is related to their performance for environmental sounds.
In the present study, we found that participants with PWS, especially UPD participants, were deficient in the recognition of voices and nonvoices. This deficit was slightly weaker for voices than for nonvoices in both PWS subgroups. It was accompanied by significantly longer RTs, with no difference between voices and nonvoices.
Given that no auditory deficit was reported for any of the PWS participants we tested, this voice recognition deficit is unlikely to be of sensory origin, except at an advanced level of sensory integration (e.g., multisensory integration). Salles et al. [11] demonstrated decreased multisensory benefits with an absence of violation of the
Fig. 4 Participant maps and word clouds for sound categorization. Participant maps in a indicate the usage of the first two dimensions in the MCA maps by each participant and the homogeneity of categorization across PWS participants. In these maps, participants located above 0.8 made the greatest use of the given dimension. In b, the size of the words in word clouds reflect the frequency of their usage by the participants. These word clouds show that participants with PWS and controls produced broadly similar descriptions, the most frequently used words being ones relating to music and animals
race model indicating that multisensory information does not converge in participants with PWS. Though some of the participants were the same as in the present study, the analyses performed in the present study are different from those in Salle et al. [11], so that we cannot compare directly participants’ performances with Salles et al. [11].
Although this may depend on the particular task and the cognitive load, the participants with PWS seemed to have specific impairments that could not solely be ex-plained by their ID. Even if top-down effects of impaired integrative functions cannot totally be excluded, the def-icit in the perception of voice and nonvoice sounds was more likely to be attributable to impairment of the most integrative associative sensory areas (e.g. posterior por-tion of the superior temporal sulcus (STS) known to be involved in integrative and multisensory analysis, and temporal poles involved in voice processing). The tem-poral pole (Brodmann area, BA 38) was found to be hypoactive in a resting-state PET study of participants with PWS, as was the posterior temporal area (BA 22) [23]. Individuals with ASD also show deficient activation during voice perception in the temporal voice areas, which are typically more sensitive to vocal stimuli [8]. Moreover, there is a hypothesis that autism results from the disconnection of different brain areas owing to STS dysfunction [24]. A variety of sensory disabilities have been reported in ASD [25], and similar ones may be present in participants with PWS.
Hit rates showed that UPD participants were more im-paired on voice and nonvoice perception than DEL par-ticipants. These findings confirmed that the participants with PWS had a sensory integration deficit, but also in-dicated that their higher order integrative deficits needed to be considered, given that PWS is characterized by ID and impaired social adaptation. To unravel these effects, we looked for correlations between hit rates for voices and nonvoices and IQ and DBC scores, but no signifi-cant correlation was found.
To further check whether this difference could be due to ID, we ran a Mann-Whitney test to analyze the differ-ence in IQ between UPD and DEL participants, but found that it was nonsignificant (p > 0.6). It is therefore unlikely that the differences between the UPD and DEL participants on voice and nonvoice identification were related to ID. This confirms the specific deficit of partic-ipants with PWS for voice/nonvoice discrimination, but also their heterogeneity [11], and explains the identifica-tion results we found.
Although participants with PWS had a voice percep-tion deficit that could be predicted from their impaired social functioning, their deficit for nonvoices was even more pronounced. This finding may contradict the hy-pothesis of a centrally driven, highly integrative origin of
the deficit, insofar as voices require a more integrative cognitive function related to the perception of identity and personality [26]. Then again, PWS participants’
compensatory mechanisms for the recognition of such socially important stimuli as voices could be of central origin. However, given the social deficits of these PWS participants, it would be difficult to attribute this com-pensation for voices to social feedback or social adapta-tion, as opposed to the special role of the voice.
Decision Modelling with HDDM
The longer RTs for voice and nonvoice detection in PWS (Fig. 1b) raise the question of whether they were due to slower decision-making or to a general slowdown in perception and motor reactions. To address this ques-tion, we used the HDDM, which implies that before giv-ing a response, individuals have to accumulate and integrate a certain amount of information. The precise amount of information they need to arrive at a decision is represented by a threshold, while the speed at which they reach this threshold is the drift rate. Importantly for our question, the model also deduces their nondeci-sion time, reflecting the time it takes them to execute the motor control and detect the stimulus. We assumed that PWS participants’ nondecision time and drift rate would both be longer, owing to their general slowdown.
For both voice and nonvoice identification, partici-pants with PWS exhibited a similar pattern of parame-ters in the HDDM. They had a higher threshold for both types of auditory stimuli, meaning that they needed to accumulate more information to identify them than con-trols did. This need for more information can be ex-plained by a lack of integrative brain capacity, linked to their general ID. This alone would have been enough to slow down their responses, but they were also slower at accumulating the necessary information (lower drift rate).
As a results, both factors (higher threshold and lower drift rate) contributed to the long RTs of participants with PWS, which were nearly twice as long as those of controls (Fig.1b). Moreover, PWS participants had lon-ger nondecision times than controls (Fig.2b), which also contributed to their longer RTs.
Thus, the HDDM demonstrated that a number of dif-ferent processes contribute to the behavioral slowdown in participants with PWS. Furthermore, the initial bias parameter indicated that participants with PWS were predisposed to the perception of voices, but to a lesser extent than controls were. It is curious that, despite the significant difference in performance between the UPD and DEL participants, the HDDM did not indicate any difference between the two subgroups on any of the pa-rameters. This may mean that the UPD and DEL partici-pants used similar cognitive strategies, but were more or
less efficient in doing so, leading to the significantly dif-ferent performances. According to the HDDM, partici-pants with PWS needed more time to accumulate information for decision-making and were predisposed to voice perception. The sound categorization tests highlighted categorization strategies similar to those of controls, although PWS participants had more problems describing the categories they had created.
Auditory free sorting task
Our exploration of PWS participants’ performances on the identification of predefined categories of voices and nonvoices led us to postulate that the deficit we ob-served was not related to higher-order cognitive func-tions, but instead to a deficit in integrative sensory processing in the temporal lobes. To further verify this hypothesis, we examined the results of an FST task that required greater involvement of cognitive and intellec-tual abilities such as similarity judgment, working mem-ory, and executive functions [27]. The additional load on high-order integrative functions was generated by re-quiring participants to establish the categorization cri-teria/principles for themselves. In an FST, participants may group items according to a variety of subjective cri-teria, but sounds are usually grouped according to their common semantic or acoustic properties [16, 28, 29]. We found that controls divided the sounds they heard into voice, instruments and environmental categories (i.e., categorization predominantly based on semantic in-formation as a consequence of identifying the sources of the sounds). Both the tree diagrams (Fig.3A) and MCA maps (Fig. 3b) showed that participants with PWS cre-ated the same voice, instruments and environmental cat-egories. This means that participants with PWS used the same semantically based cognitive strategy as controls. Furthermore, no correlations were found between categorization and IQ. PWS participants’ IQ therefore only weakly influenced their ability to establish sound categories. This weak influence could be detected at the within-category level, where the within-group distances between stimuli were significantly greater than they were for controls. The within-category dispersion can be ex-plained by subgroups of PWS participants with low IQ who did not categorize the sounds as the other PWS participants did. The outlier PWS participants in the participant maps (Fig.4a) had a lower IQ than the other PWS participants (there were no outliers in the control group). However, the correlation with IQ disappeared when we considered it from the opposite direction, in that not all PWS participants with low IQ were outliers with poor categorization performances.
As demonstrated by the word clouds (Fig.4b), partici-pants with PWS were less accurate in the description of the stimuli because of their poorer vocabulary, which
may have been related to their ID. We also noticed that they tended to tell stories involving the stimuli, instead of providing an exact description of each category they formed.
As previously discussed, the HDDM indicated that participants with PWS needed more time to accumulate information to make a decision. Higher information ac-cumulation demands may explain their relatively good results on categorization, where no time limits were im-posed. This observation evokes the theory that ASD is the phenotypic expression of spatiotemporal processing disorders, which may result from multisystem brain disconnectivity-dissynchrony, defined as an increase or decrease in functional connectivity and neuronal synchronization within/between multiple neurofunc-tional territories and pathways [30]. Consequently, the world changes too fast for these participants, but given enough time, their brain can find compensatory path-ways and circuits.
Differences between UPD and DEL participants
Hit rates indicated that UPD participants had poorer voice and nonvoice perception than DEL participants (Fig. 1a). Similarly, UPD participants had longer RTs for both voices and nonvoices (Fig. 1b). This is in line with the finding of Salles et al. [11] that UPD participants have a greater deficit for the discrimination of voices and environmental sounds than DEL participants. How-ever, the HDDM did not reveal any differences between the UPD and DEL participants on the decision making parameters. For sound categorization in the FST (Fig.
4a), three of the five PWS participants with the poorest performances were DEL participants, and the remaining two were UPD participants, so no conclusion can be reached as to possible differences between these sub-groups. This may mean that UPD participants had more problems with the explicit task and fewer problems with the more implicit FST. Considering the absence of dif-ferences on the FST and the HDDM for decision-making, our overall results suggest that the differences in voice and nonvoice perception between the UPD and DEL participants concerned integrative sensory process-ing rather than the higher cognitive functions related to decision-making and ID.
Conclusions
In this study, we found a deficit in participants with PWS for voice processing, but UPD participants were more im-paired than DEL participants on both voice and nonvoice perception. We were also able to demonstrate a compen-satory improvement in the perception of voices compared with nonvoices. The HDDM enabled us to demonstrate that participants with PWS need to accumulate more in-formation for making, are slower at
decision-making, and are less predisposed to voice perception than TD individuals. Sound categorization in participants with PWS is generally preserved, though impoverished, and may be influenced by their low IQ.
Methods
Participants
Participants were 38 TD adults (mean age = 30 years, SD = 5) and 61 individuals with PWS (Mage= 30 years,
SD = 7): 38 with DEL and 23 with UPD. PWS partici-pants were initially assessed either at Hendaye Hospital (n = 26), a dedicated rehabilitation center for adults with PWS, or during a consultation at the PWS reference center of Toulouse University Hospital (n = 35). The present study is an extension of the Salles et al. [11] art-icle, in the present set of analysis we have included some participants from the previous study. However, not all of the previous participants performed the totality of the tests analyzed in the present study and the majority of PWS participants in this study did not overlap with the study of Salles et al. [11]. See Table 1 for the partici-pants’ data.
The study was approved by the ethics committees of Toulouse University Hospital (Toulouse Hospital CHU 13687203; National EudraCT 201,300,437–33), and all participants gave their written informed consent prior to their inclusion in the study.
Clinical assessment
The Developmental Behaviour Checklist for Adults (DBC_A) is a questionnaire completed by parents or care-givers to assess the behavioral and emotional problems of adults with developmental and intellectual disabilities, and it is routinely used for participants with PWS. The full questionnaire contains 107 items divided into six categor-ies: disruptive/antisocial, communication disturbance, anxiety, self-absorbed, depressive, and social relating. Voice discrimination task
We assessed participants’ ability to distinguish between vocal and nonvocal stimuli in a two-alternative forced-choice (2FAC) paradigm. Each participant sat in a quiet, dimly lit room looking at a fixation cross on a computer screen. They were tested with a 1-s intertrial interval and were instructed to respond as accurately as possible, using the left or right control button of the E-prime
response box to indicate their answer (voice or non-voice). The response keys were counterbalanced across participants, and they each underwent a short training session to ensure that they understood the test. The 110 stimuli were presented in two blocks of 55.
All the stimuli were taken from a database containing vocal and nonvocal sounds used in previous experiments [11,31,32]. They each lasted 500 ms. The set of 55 vocal stimuli included 29 speech stimuli (phonemes presented in a /h/−vowel−/d/ context, words in different languages, or nonsemantic syllables) and 26 non-speech stimuli (e.g., laughs, coughs). The set of 55 nonvocal stimuli consisted of a wide variety of environmental sounds (cars, telephones, bells, running water, etc.). Neither set contained animal vocalizations.
Auditory free sorting task
Most studies exploring how we categorize natural sounds are based on pairwise similarity judgments, but one alternative method of determining how natural sounds are perceived is to use an FST. This task pro-vides an opportunity to test a large set of stimuli without having to divide them into dimensions beforehand, thus allowing participants to categorize them according to their own criteria/principles. The FST has been shown to be well-suited to evaluating auditory perception in adult participants, as well as in children as young as 6 years [16,28,29]. In an FST, participants group the ob-jects according to their common semantic or acoustic properties. Although this free categorization process is closely related to similarity judgment, the process in-volves more holistic-based decisions [33] and is more strongly influenced by cognitive factors [27]. In the present FST categorization protocol, both groups were seated in front of a PC monitor positioned at eye level, with loudspeakers located on either side at a distance of 1 m. The stimuli were played at a level of 65 dB SPL (measured at head height with a sound level meter at a distance of 1 m) through loudspeakers in free-field lis-tening conditions. Testing was carried out using open-source TCL-LabX software ( http://petra.univ-tlse2.fr/tcl-labx/), which acted as the interface for the FST. The 16 sounds were represented on the computer by 16 num-bered and colored squares that were positioned in the same order for all participants.
The task for participants was to listen to the 16 sounds and place them in groups (i.e. create categories) using any criteria they chose. The experimenter gave only minimal feedback to facilitate completion of the experiment. Sounds were played using the PC mouse, by double click-ing on each square, and participants created categories by dragging and grouping the squares together on the screen. Once participants had finished placing the squares in cat-egories, they were asked to listen to each sound one last Table 1 Summary description of study participants
Age M F DEL UPD IQ DBC Mean PWS (SD) 30 (7) 29 32 38 23 56.6 0.32 Mean TD (SD) 30 (5) 16 22
Note. DEL deletion on chromosome 15, UPD uniparental disomy, IQ
intelligence quotient,DBC Developmental Behavior Checklist, PWS participants with Prader-Willi syndrome,TD typically developing controls
time to verify their choices before ending the experiment. They were then asked to type a brief description of each category using the keyboard.
There were no limits on the amount of time taken to complete the test or the number of times participants could listen to a given sound (i.e., playbacks). Partici-pants were also allowed to create as many or as few cat-egories as they wished, such that one category could contain just a single stimulus or all 16. The TCL-LabX software also recorded performance data and statistics for all participants, including the number of categories they created, the number of playbacks they listened to, and the duration of the experiment.
All the sounds were taken from a database owned by the PETRA group at Toulouse Jean Jaurès University (http://petra.univ-tlse2.fr) and were chosen to cover a broad range of semantic and acoustic information (see [28]). We selected sounds that are frequent in everyday life and can be divided into three main types: environ-mental sounds (alarm clock ringing, car engine starting, door opening, footsteps, glass breaking, helicopter, run-ning water); musical sounds (bells, guitar, oboe, violin, xylophone); or vocal sounds (male voice coughing, fe-male voice speaking, fefe-male voice laughing, fe-male voice speaking). Stimuli were presented at the comfortable level of approximately 65 dB SPL and were delivered in stereo through headphones plugged into the computer. Data analysis
The participants’ performances on the voice discrimin-ation task were analyzed in the form of hit rates and RTs (Fig.1), using the general linear mixed-effect model of the lme4 R package, with the factors group (TD, Del PWS, UPD PWS) and stimulus (vocal, nonvocal) and the Group x Stimulus interaction. We ran type II Wald chi-square tests for post hoc comparisons.
Hit rates and RTs were then analyzed with the HDDM [13], a sequential sampling model that correlates response accuracy with RTs for simple 2FACs. It postulates that each decision can be modulated by the accumulation of noisy information over time. Occurrences accumulate until they reach a threshold when the individual takes a decision. Each decision is represented by an upper and a lower boundary that have to be crossed in order to initiate the corresponding response. Applying the Bayesian ap-proach to the HDDM can shed light on the cognitive and psychological processes behind decision-making, based solely on RT distribution for the two response choices. With this model, the behavioral data can be categorized according to four parameters (see Fig.2a): threshold, drift rate for the accumulation speed, nondecision time associ-ated with stimulus perception and response execution, and initial bias. We used the Monte Carlo and Markov chains (MCMC) method to estimate posteriors based on
our data. We performed 20,000 iterations. We discarded 5000 initial burn-in items, and only saved every fifth sam-ple. This method yielded 3000 posterior values that were normally distributed. We confirmed our model using the posterior plots available in Python software (PyMC). From this simulated population, we could calculate the mean and 95% confidence interval for each parameter.
In the categorization part of the study, to analyze the sound categories the participants created, we applied two approaches in the R environment [34]: hierarchical clustering based on principal components (HCPC) allowed us to represent stimulus associations as tree dia-grams; and multiple correspondence analysis (MCA) allowed us to obtain the group-level statistics for the preferred associations of stimuli.
More specifically, we performed HCPC in order to view a simplified version of the sound categories in the form of tree diagrams. With this analysis, it is not pos-sible to account for all of the variance (inertia) within the data (i.e. the variability of participant responses), and so a certain proportion remains unaccounted for. How-ever, by increasing the number of desired categories, the inertia can be reduced, and it was by using this process that we were able to choose the final number of categor-ies: if the number of categories is Q, then the optimum number of categories is found when the change in iner-tia is greater when moving from Q - 1 to Q than from Q to Q + 1 [34].
We applied MCA to a multi-participant categorization table (raw data not included) produced by TCL LabX soft-ware. This table represented the results as an array of cat-egorical variables as columns and catcat-egorical items (sound stimuli) as rows, with each cell containing a number that defined the category membership of each sound for each participant. MCA used correspondence analysis to repre-sent each sound as a data point in an n-dimensional Eu-clidean space based on the categorical values (i.e., categories created by participants). Each of the dimensions was chosen to account for the greatest amount of variance possible within the dataset, and they were produced in de-scending order of variance. MCA on the participants showed how strongly individual results coincided with the dimensions [35]. A total of 15 dimensions were used in the analysis. We focused on the two most significant ones (Dim 1 & Dim 2), as they accounted for the greatest amount of variance in the data and also showed the most significant correlations with the acoustic variables mea-sured for the sounds. As there was no a priori knowledge that could be used to automatically establish these rela-tions, a degree of interpretation was required when com-menting on the dimensions [35].
To characterize the distances between the sounds in the MCA maps, we calculated the corresponding Euclid-ean distances.
Abbreviations
2FAC:Two-alternative forced-choice task; ASD: Autism spectrum disorder; DEL: Deletion; FST: Free sorting task; HCPC: Hierarchical clustering based on principal components; HDDM: Hierarchical drift diffusion model;
MCA: Multiple correspondence analysis; MCMC: Monte Carlo and Markov chains; PWS: Prader-Willi syndrome; RT: Reaction times; TD: Typically developed; UPD: Maternal uniparental disomy
Acknowledgements
We would like to thank all the participants in this study. We thank the team of Hendaye Marine Hospital and the Prader Willi reference center based at the children’s hospital in Toulouse. It is thanks to them that we were able to recruit PWS participants from all over France. We are grateful to the Foundation for Prader-Willi Research for financial support.
Financial disclosure
The authors have no financial relationships relevant to this article to disclose.
Authors’ contributions
KS experimental design, stimulation programming, data analysis and writing the article. JD data collection, data analysis, writing the article. MV, VL, CMo help with PWS participant selection, clinical supervision and data collection. CMa stimulus preparation (images). DT clinical supervision. MT clinical supervision, writing the article, PB supervision, writing the article. All authors read and approved the final manuscript.
Funding
This work was supported by grants from the Foundation for Prader Willi Research (FPWR to JD, BP and MT) and recurrent funding from the CNRS (to BP JD). All the authors report no potential conflicts of interest with this work.
Availability of data and materials
The datasets used and/or analysed during the current study are available from the corresponding author on reasonable request.
Ethics approval and consent to participate
The study was approved by the ethics committees of Toulouse University Hospital (Toulouse Hospital CHU 13687203; National EudraCT 201300437–33). Written informed consent was obtained from the patient(‘s legal guardian or next of kin) prior to the study.
Consent for publication Not applicable.
Competing interests No competing interests.
Author details
1Brain & Cognition Research Center (CerCo), University of Toulouse Paul
Sabatier, Toulouse, France.2Brain & Cognition Research Center (CerCo), CNRS,
Toulouse, France.3ENT Department, Purpan Hospital, Toulouse, France. 4
Prader-Willi Syndrome Reference Center, Children’s
Hospital-INSERM-University of Toulouse Paul Sabatier, Toulouse, France.
5Marine Hospital, Hendaye, France.6Toulouse Purpan Physiopathology
Center, INSERM-University of Toulouse Paul Sabatier, Toulouse, France.
Received: 30 July 2019 Accepted: 8 January 2020
References
1. Butler MG, Manzardo AM, Forster JL. Prader-Willi syndrome: clinical genetics and diagnostic aspects with treatment approaches. Curr Pediatr Rev. 2016; 12:136–66.
2. Cassidy SB, Driscoll DJ. Prader–Willi syndrome. Eur J Hum Genet. 2009;17:3–13. 3. Butler MG. Prader-Willi syndrome: obesity due to genomic imprinting. Curr
Genomics. 2011;12:204–15.
4. Dimitropoulos A, Schultz RT. Autistic-like symptomatology in Prader-Willi syndrome: a review of recent findings. Curr Psychiatry Rep. 2007;9:159–64. 5. Dykens EM, Roof E, Hunt-Hawkins H, Dankner N, Lee EB, Shivers CM, et al. Diagnoses and characteristics of autism spectrum disorders in children with Prader-Willi syndrome. J Neurodev Disord. 2017;9:18.
6. Koenig K, Klin A, Schultz R. Deficits in social attribution ability in Prader?Willi syndrome. J Autism Dev Disord. 2004;34:573–82.
7. Latinus M, Belin P. Human voice perception. Curr Biol. 2011;21:R143–5. 8. Gervais H, Belin P, Boddaert N, Leboyer M, Coez A, Sfaello I, et al. Abnormal
cortical voice processing in autism. Nat Neurosci. 2004;7:801–2.
9. Schelinski S, Roswandowitz C, von Kriegstein K. Voice identity processing in autism spectrum disorder. Autism Res. 2017;10:155–68.
10. Chevallier C, Kohls G, Troiani V, Brodkin ES, Schultz RT. The social motivation theory of autism. Trends Cogn Sci. 2012;16:231–9.
11. Salles J, Strelnikov K, Carine M, Denise T, Laurier V, Molinas C, et al. Deficits in voice and multisensory processing in patients with Prader-Willi syndrome. Neuropsychologia. 2016;85:137–47.
12. Debladis J, Valette M, Strenilkov K, Mantoulan C, Thuilleaux D, Laurier V, et al. Face processing and exploration of social signals in Prader-Willi syndrome: a genetic signature. Orphanet J Rare Dis. 2019;14:262. 13. Wiecki TV, Sofer I, Frank MJ. HDDM: Hierarchical Bayesian estimation of
the Drift-Diffusion Model in Python. Front Neuroinform. 2013:7 Available from:https://www.frontiersin.org/articles/10.3389/fninf.2013.00014/full. [cited 2019 May 6].
14. Lo ST, Collin PJL, Hokken-Koelega ACS. Psychiatric disorders in children with Prader-Willi syndrome-results of a 2-year longitudinal study. Am J Med Genet A. 2015;167A:983–91.
15. Barendse EM, Hendriks MPH, Thoonen G, Aldenkamp AP, Kessels RPC. Social behaviour and social cognition in high-functioning adolescents with autism spectrum disorder (ASD): two sides of the same coin? Cogn Process. 2018; 19:545–55.
16. Berland A, Gaillard P, Guidetti M, Barone P. Perception of everyday sounds: a developmental study of a free sorting task. PLoS One. 2015; 10:e0115557.
17. Shulman C, Yirmiya N, Greenbaum CW. From categorization to classification: a comparison among individuals with autism, mental retardation, and normal development. J Abnorm Psychol. 1995;104:601–9.
18. Holland AJ, Whittington JE, Butler J, Webb T, Boer H, Clarke D. Behavioural phenotypes associated with specific genetic disorders: evidence from a population-based study of people with Prader-Willi syndrome. Psychol Med. 2003;33:141–53.
19. Holland A, Whittington J, Hinton E. The paradox of Prader-Willi syndrome: a genetic model of starvation. Lancet. 2003;362:989–91.
20. Adolphs R, Sears L, Piven J. Abnormal processing of social information from faces in autism. J Cogn Neurosci. 2001;13:232–40.
21. Ujiie Y, Asai T, Wakabayashi A. The relationship between level of autistic traits and local bias in the context of the McGurk effect. Frontiers in Psychology. 2015;6. Available from:http://journal.frontiersin.org/Article/1 0.3389/fpsyg.2015.00891/abstract. [cited 2019 Jan 16]
22. Belin P, Fecteau S, Bédard C. Thinking the voice: neural correlates of voice perception. Trends Cogn Sci (Regul Ed). 2004;8:129–35.
23. Mantoulan C, Payoux P, Diene G, Glattard M, Rogé B, Molinas C, et al. PET scan perfusion imaging in the Prader–Willi syndrome: new insights into the psychiatric and social disturbances. J Cereb Blood Flow Metab. 2011;31:275–82. 24. Zilbovicius M, Meresse I, Chabane N, Brunelle F, Samson Y, Boddaert N.
Autism, the superior temporal sulcus and social perception. Trends Neurosci. 2006;29:359–66.
25. Hazen EP, Stornelli JL, O’Rourke JA, Koesterer K, McDougle CJ. Sensory Symptoms in Autism Spectrum Disorders. Harv Rev Psychiatry. 2014;22:112–24. 26. Belin P, Bestelmeyer PEG, Latinus M, Watson R. Understanding voice
perception. Br J Psychol. 2011;102:711–25.
27. Lemaitre G, Houix O, Misdariis N, Susini P. Listener expertise and sound identification influence the categorization of environmental sounds. J Exp Psychol Appl. 2010;16:16–32.
28. Collett E, Marx M, Gaillard P, Roby B, Fraysse B, Deguine O, et al. Categorization of common sounds by cochlear implanted and normal hearing adults. Hear Res. 2016;335:207–2019.
29. Strelnikov K, Collett E, Gaillard P, Truy E, Déguine O, Marx M, et al. Categorisation of natural sounds at different stages of auditory recovery in cochlear implant adult deaf patients. Hearing Res. 2018;367:182–94. 30. Gepner B, Féron F. Autism: a world changing too fast for a mis-wired brain?
Neurosci Biobehav Rev. 2009;33:1227–42.
31. Belin P, Zatorre RJ, Lafaille P, Ahad P, Pike B. Voice-selective areas in human auditory cortex. Nature. 2000;403:309–12.
32. Massida Z, Belin P, James C, Rouger J, Fraysse B, Barone P, et al. Voice discrimination in cochlear-implanted deaf subjects. Hear Res. 2011;275:120–9.
33. Parizet E, Koehl V. Application of free sorting tasks to sound quality experiments. Appl Acoust. 2012;73:61–5.
34. Husson F, Josse J, Le S, Mazet J. FactoMineR: Multivariate Exploratory Data Analysis and Data Mining with R; 2014.
35. Cadoret M, Lê S, Pagès J. A factorial approach for sorting task data (FAST). Food Qual Prefer. 2009;20:410–7.
Publisher’s Note
Springer Nature remains neutral with regard to jurisdictional claims in published maps and institutional affiliations.