Comparative approaches to otoacoustic emissions:
Towards an understanding of why the ear emits
sound
by
Christopher Bergevin
Submitted to the Speech and Hearing Bioscience and Technology
Harvard-MIT Division of Health Sciences and Technology
in partial fulfillment of the requirements for the degree of
Doctor of Philosophy
at the
MASSACHUSETTS INSTITUTE OF TECHNOLOGY
May 2007
UEZe
Zoo~7]
@
Christopher Bergevin, MMVII. All rights reserved.
The author hereby grants to MIT permission to reproduce and
distribute publicly paper and electronic copies of this thesis document
in whole or in part.
A uth or . . .
...
SpeU and Hearing Bioscience and Technology
Harvard-MIT Divi
of Health Sciences and Technology
May 25, 2007
Certified by.. ...
Christopher A. Shera, Ph.D.
Professor of Otology and Laryngology, Harvard Medical School
Thesis Supervisor
C ertified by ...
...
.
...
Dennis M. Freeman, Ph.D.
Professor of Electrical Engineering, Massachusetts Institute of
Technology
Thesis Supervisor
Accepted by ...-. .4 ...
Martha L. Gray, Ph.D.
Edward Hood Taplin Professor of M dical and Electrical Engineering
Director, Harvard-MIT Division of Health Sciences and Technology
MASSACHUSETTS INSTImTE
OF TECHNOLOGY
JUL 122007
f
Comparative approaches to otoacoustic emissions:
Towards an understanding of why the ear emits sound
by
Christopher Bergevin
Submitted to the Speech and Hearing Bioscience and Technology Harvard-MIT Division of Health Sciences and Technology
on May 25, 2007, in partial fulfillment of the requirements for the degree of
Doctor of Philosophy
Abstract
The ear represents a remarkable achievement in sensory physiology. It is very fast (timescales on the order of 1-100 kHz), has a large bandwidth (-10 octaves in the hu-man), highly sensitive (threshold is ultimately determined by thermal noise), operates over an enormous dynamic range (factor of a trillion in terms of energy input), ca-pable of sharp stimulus selectivity (e.g. frequency and intensity discrimination) and exhibits robust nonlinear behavior. As a sensor designed to detect acoustic sound pressure, surprisingly, the ear also emits sound as well. These otoacoustic emissions (OAEs) have been developed extensively for clinical applications (healthy ears emits while impaired ones do not), though their full potential has yet to be realized. Much of the effort gone into understanding OAEs has been developed within the context of mammals, where specific anatomical and physiological features (e.g. traveling waves and somatic motility) are thought to play an integral role in generation. This thesis approaches OAEs comparatively, systematically characterizing emissions in humans and an array of non-mammals (chickens, geckos and frogs) who lack these mammalian features and exhibit a diverse range of morphologies. First, our results show that for a fixed set of stimulus conditions (employing moderate intensities), emissions are rela-tively largest in the gecko and frog (the two species with the fewest number of sensory cells) and smallest in the human and chicken for frequencies below -2 kHz. At higher frequencies (3-5 kHz), emissions descend toward the noise floor for the non-mammals but remain relatively constant in human. Second, OAE phase behavior indicates that emissions are generated by multiple mechanisms in the human and chicken (and possibly gecko in certain stimulus conditions), but not the frog. OAEs in all species
exhibit significant delays (~1 ms or longer), those being largest in humans. Tuning
can explain these delays in all species except the frog, where some additional source of delay is present. Lastly, non-monotonic growth (relative to stimulus intensity) was found in all species, suggesting the presence of multiple level-dependent sources. We interpret the observed similarities and differences in emission properties across species within the context of anatomical/physiological comparisons.
Thesis Supervisor: Christopher A. Shera, Ph.D.
Title: Professor of Otology and Laryngology, Harvard Medical School Thesis Supervisor: Dennis M. Freeman, Ph.D.
What we observe is not nature in itself, but nature
exposed to our method of questioning.
Acknowledgments
The work described in this thesis represents the culmination of integrating inputs from many, many individuals. I could attempt to provide an exhaustive list, but surely many important people would be left out. So I will compromise: if you are reading this and we crossed paths in some form or another at least once before 5/25/07, thank you. There is (at least) a little bit of you in this document...
Particular thanks goes to the members of my thesis committee: Chris Shera and Denny Freeman (my two advisors), John Guinan, John Rosowski, Paul Fahey and AJ Aranyosi. Their input/feedback/criticisms have been invaluable.
Contents
Acknowledgments 7
1 Basis for a Comparative Study 15
1.1 Overview ... ... 15
1.2 Human Peripheral Auditory Anatomy ... 17
1.3 Cochlear Amplification? ... . 22
1.4 Mammalian Otoacoustic Emissions ... 26
1.5 Non-mammalian Ears . . . . 32
1.6 Non-mammalian Otoacoustic Emissions . . . . 33
1.7 Summary of Approach . . . . 34
2 eOAE Methods 37 2.1 Measurement System ... . 37
2.2 Stimulus Paradigms and Analysis ... 38
2.2.1 I/O Delays . . . .. . . . . 40
2.2.2 System Distortion . . . . 41
2.3 Subjects . . . . 42
2.4 Data Visualization . . . . 47
3 Comparison of SFOAEs Across Species 49 3.1 Basis for a Comparative Study of OAEs . . . . 49
3.2 Overview of Anatomical Differences . . . . 51
3.2.1 Chickens . . . . 52 9
3.2.2 G eckos . . . . 54
3.2.3 Frogs . . . . 56
3.2.4 Hum ans . . . . 57
3.3 Methods ... ... ... . ... 57
3.3.1 SFOA Es . . . . 57
3.3.2 Choice of Stimulus Parameters and Methods . . . . 58
3.3.3 Quantifying Phase Gradients . . . . 59
3.4 SFOAE Results . . . . 60
3.5 D iscussion . . . . 65
3.5.1 Comparison With Previous Studies . . . . 66
3.5.2 Relating Emission Properties Back to Anatomical Differences. 67 3.5.3 Differences in SFOAE Generation Across Species . . . . 70
3.5.4 Emission Delays . . . . 71
3.5.5 Thning As a Source of Delay . . . . 73
3.6 Sum m ary . . . . 74
4 Are Otoacoustic Emissions Generated by Multiple Mechanisms in
Non-mammals?
79
4.1 Approaches Towards Classifying OAEs . . . . 794.2 Definition of an eOAE Generation Mechanism . . . . 81
4.3 eOAE Results . . . . 82
4.3.1 D POA Es . . . . 83
4.3.2 SFOAE vs. DPOAE Phase Gradient Comparison . . . . 86
4.3.3 DPOAE Dependence Upon Primary Ratio . . . . 90
4.4 D iscussion . . . . 92
4.4.1 Comparison with Previous DPOAE Studies . . . . 92
4.4.2 Effect of Stimulus Parameter Choice . . . . 93
4.4.3 Do Non-Mammals Show Evidence for Multiple Mechanisms? . 94 4.4.4 Differences at Lower Frequencies . . . . 97
4.4.6 Traveling Waves in Non-Mammals? ...
4.4.7 Differences in Emission Magnitudes . . . .
4.4.8 Spontaneous vs. Evoked Emissions . . . .
4.5 Sum m ary . . . .
5 eOAE Level Dependence
5.1 Background . . . .
5.2 Results -eOAE Level Dependence . . . .
5.3 D iscussion . . . .
5.3.1 Nonlinear Growth . . . . 5.3.2 Level Dependence of eOAE Phase Gradients . . . .
5.3.3 Level-Dependent Generation Mechanisms . . . .
5.4 Sum m ary . . . .
6 Evidence For Multiple Level-Dependent eOAE Sources?
6.1 Nonlinear and Non-Monotonic eOAE Growth . . . .
6.2 Single-Source Model . . . . 6.2.1 Overview . . . . 6.2.2 Predictions . . . . 6.3 M ethods . . . . 6.3.1 OAE Measurements . . . . 6.3.2 A nalysis . . . . 6.4 eOAE Growth . . . . 6.4.1 SFOAEs . . . . 6.4.2 DPOAEs . . . . 6.4.3 Frequency Dependence . . . .
6.4.4 Non-Monotonicities with Respect to L . . . .
6.4.5 SFOAE Phase Jumps . . . .
6.4.6 Sub-Notch Intensity Gradients . . . .
6.5 D iscussion . . . .
6.5.1 Nonlinear Emission Growth . . . .
98 101 102 103 105 105 107 114 114 119 123 126 129 129 132 132 135 . . . . . . 136 . . . . 136 . . . . 137 . . . . 139 . . . . 139 . . . . 142 . . . . 148 . . . . 149 . . . . 153 . . . . 153 . . . . 154 . . . . 154
6.5.2 Comparison of eOAEs and Single-Source Model 6.5.3 Further Evidence for Multiple Sources . . . . .
6.5.4 Non-Monotonic Behavior In ANF Responses . .
6.6 Sum m ary . . . . 7 Potpourri
7.1 Other OAE Properties . . . .
7.1.1 Effect of Death . . . . 7.1.2 Ossicular Interruption . . . . 7.2 OAEs a By-product of Cochlear Amplification? . . . . 7.3 Effects of Physical Dimensions . . . . 7.4 Future W ork . . . . 7.5 Recapitulation . . . . A Harmonic A.0.1 A.o.2 A.0.3 A.0.4 A.0.5 A.0.6 A.0.7 Oscillator 177
Undamped, Undriven Case - Simple Harmonic Oscillator . . . 178
Driven Harmonic Oscillator . . . . 179
Damped Driven Oscillator . . . . 181
Quality Factor . . . . 183
Build-up Time . . . . 184
Impedance . . . . 184
Analogy to Acoustics and Electronics . . . . 185 A.0.8 Applying the Harmonic Oscillator to Problems in Hearing
B Traveling Waves in the Mammalian Cochlea - A Simple Model
B.0.9 Transmission Line . . . . B.0.10 Passive Linear Model . . . . B.0.11 Model Comparison to Experimental Data . . . . B.O.12 Conclusions . . . . C Using Phase Gradients to Estimate Time Delays
C.1 Gradients in the Steady-State Condition . . . .
157 162 165 167 169 169 169 169 170 172 173 175 186 187 187 190 201 205 207 207
C.1.1 Delays Associated With Tuning . . . . 210
D Correcting for I/O Delays in Phase Measurements of eOAEs 213 D.1 Overview.. . . . . . . . . 213
D.2 Phase Correction . . . 215
D.2.1 Total System Delay . . . . 215
D .2.2 SFO A Es . . . . 216
D.2.3 DPOAEs . . . .. 217
Chapter 1
Basis for a Comparative Study
1.1
Overview
"Cochlea wave propagation .... ". So starts the seminal paper that first reported the
existence of evoked otoacoustic emissions [Kemp, 1978]. Much effort since that time has gone into both characterizing OAEs experimentally and developing theory to explain their origin. Much of this theory has been largely based upon mammalian morphology, or as Kemp put it, a 'cochlea' that supports a traveling 'wave' along its length. This approach has had much success in providing a framework for our understanding of emission generation as well as their clinical interpretation. The purpose of this research is to characterize emission properties in a number of species with different inner ear anatomies and examine comparatively how emissions may be generated in different types of ears.
A classification scheme for mammalian OAEs has been proposed which attributes emissions as arising from two fundamentally different mechanisms [Shera and Guinan, 1999). The argument focuses upon observed properties of emission phase and uses an anatomical framework based upon mammalian morphology to provide a physical basis into how the two mechanisms differ. One mechanism involves generation at the peak of the the traveling wave which, due to scaling symmetry, yields a relatively frequency-independent emission phase. The other mechanism involves a coherent reflection of forward-propagating energy due to place-fixed impedance irregularities and accounts
for emissions with a rotating phase [Zweig and Shera, 1995]. Taken together, the proposed taxonomy accounts for all different characterized types of emissions, both spontaneous (SOAE) and evoked (eOAE). Due to the relatively generic anatomy of the mammalian cochlea, it is generally assumed that this framework applies across a broad class of mammalian ears (including humans). Explanation aside, different emission types have very different frequency dependencies of their phases, indicating that there are at least two different mechanisms for emission generation in the mammalian ear
Numerous studies have examined OAEs in a wide array of non-mammalian species such as lizards (Rosowski et al., 1984; Manley et al., 1993], birds [Taschenberger and Manley, 1997] and frogs [van Dijk et al., 1996; Meenderink, 2005]. It has been shown that OAEs, arising either spontaneously or via an evoking stimulus, are not at all unique to the mammalian ear and are clearly present in a wide range of vertebrate
ears. Thus the emission of sound is a fairly generic process of most ears [Koppl, 1995]2.
In many of these studies, OAEs have been used as an assay towards understanding some other peripheral feature, such as hair cell regeneration in the chick due to acoustic overexposure [Ipakchi et al., 2005]. However, it is not clear if emissions are generated similarly in avian and mammalian ears or in fundamentally different ways. Furthermore, there is much debate as to what similarities and differences between mammalian and non-mammalian emissions imply about current OAE and cochlear models. The connection is complicated by how the so-called cochlear amplifier may differ between mammals and non-mammals [Manley, 2001].
Our choice of species to examine here comprises several distinct inner ear anatomies. We specifically chose animals which are known (directly or indirectly) to lack basi-lar membrane (BM) traveling waves and/or outer hair cells (i.e. cell body somatic motility). Differences among the species are schematized in Fig. 3-1. For a given ear, two different views are shown to facilitate comparison. Two of the most obvi-ous differences are the number of hair cells in a radial cross-section (as well as the
iCh.4 provides a discussion of what the definition of a mechanism is. 2
Significant eOAEs have also been observed in invertebrates such as grasshoppers and locusts. They have been shown to be physiologically sensitive and highly dependent upon the state of the neurons synapsed to the peripheral auditory organs (Mockel et al., 20061.
4
'I
Figure 1-1: Overview of the human auditory periphery [A. Greene].
orientation of the bundles) and the shape/size of the overlying tectorium (TM) in addition to the means by which it couples to the bundles and the organ as a whole.
The purpose of this first chapter is to set a basis for what we might gain from a comparative study and how we can use that knowledge to further our understanding about how the ear emits sound. The chapter is intended to provide the reader with the background motivating Chapters 3-6. First, we provide a general overview of the
.3
anatomy and physiology of the auditory periphery and how they vary across species This is followed by a discussion about the cochlear amplifier, providing a basis for the subsequent discussion about current thought regarding mammalian OAEs. Lastly, we pose the main questions we address in this thesis, with subsequent chapters being
devoted to each question.
1.2
Human Peripheral Auditory Anatomy
The ear can be roughly distinguished into three different parts: the outer, middle and inner ear (Fig. 1-1). Sound enters the external auditory meatus, or ear canal
3Detailed description of the non-mammalian anatomy is described in Ch.3.
V W ft 0 A
Figure 1-2: Schematic showing BM traveling wave along a straightened (uncoiled) cochlea [Geisler, 1990).
(outer ear), and sets the tympanic membrane (TyM) into motion. On the other side coupled to the TyM, are the three ossicles which span the middle ear. To a first degree, these bones serve as impedance matchers between air-filled outer world and the fluid-filled inner ear. The final bone, the stapes, is coupled to the oval window, entrance to the snail-shaped cochlea (inner ear). For our purposes, the mammalian auditory periphery is considered relatively generic (at least relative to non-mammals)
and the description below is considered to apply to all mammals (not just humans)4.
The cochlea is a long coiled tube comprised of three different chambers. A flexible partition called the basilar membrane (BM) separates the top two chambers (scala vestibuli and scala media) from the bottom (scala tympani), except at the most apical region of the cochlea where there is a hole called the helicotrema. The width and thickness of the BM change along the cochlear length, as does the cross-sectional area of the chambers. As the stapes footplate moves in and out in response to sound, pressure variations in the fluid will be setup inside the cochlea.
A flexible membrane called the round window allows for the volume displacements outwards as the stapes pushes inwards (since the cochlear fluid is largely
incompress-4Obviously there are significant differences across mammalian species. These can range from general (such as overall dimensions) to highly specific (e.g. the structure and shape of the supporting cells or special high frequency adaptations found in bats). Considering the importance of using animal models with the intention of clinical benefit back to humans, comparative OAE studies specifically across mammals are of high value and numerous researchers have explored this path [for example, see Souter, 1995].
ible). This creates a pressure difference across the basilar membrane. As a result, a traveling wave propagates along the BM as shown in Fig. 1-2'. Each point along the BM resonates at a particular frequency due to its graded mass and stiffness. It is this
tonotopic organization that allows the cochlea to function as a spectrum analyzer.
Higher frequencies excite excite basal regions (near the stapes) while lower frequencies stimulate more apically. Fig. 1-3 shows data from the seminal work of von Bekesy, showing BM displacement magnitude and phase in a human cadaver ear. Because he measured in dead ears, Bekesy's measurements fail to capture features observed in a living ear thought to arise from physiological amplification mechanisms (discussed in a subsequent section below).
Sitting on top of the BM in the scala media is a remarkable structure called the
organ of corti (OoC), as shown in Fig. 1-4. The OoC contains hair cells (HCs)
which effectively act as mechano-electro transducers, mapping BM motion to action potentials in the auditory nerve fibers (ANFs) innervating the HCs. A stereociliary bundle extends out of the epithelial surface of the HC that contains a unique set of transduction channels. As the BM is displaced and moves upwards in the transverse direction, there is a shearing between the BM and the overlying tectorial membrane (TM) in the radial direction6 . This shearing causes a deflection of the stereociliary bundle, thereby stimulating the transduction channels [Corey and Hudspeth, 1979]1. The scala media is unique in that its fluid composition creates an extremely high potential of about +70 mV (the largest resting potential in the entire body) due to the pumping action of the stria vascularis which also causes a large K+ concentration. This potential is quite high compared to the resting potential of the hair cell, which is at about -60 mV. As a result of this large potential difference, small bundle deflections
5
See Appendix B for further discussion.
'The TM is an anisotropic, extracellular gelatinous matrix. It has unique structural, electrical and mechanical properties that likely play a role in energy propagation throughout the cochlea. However, its exact role is still not currently well understood due to the difficulty associated with TM-based measurements.
7
Everything up to the level of BM displacement is generally referred to as macro-mechanics. However, motions at the level of the HC bundle and TM-recticular lamina displacements are referred to as micro-mechanics. Motions on these smaller length scales are currently not well understood and thus the exact mechanism by which HC transduction channels are excited is not known.
U.se
Fig. 3 7 Travelling waves in the cochlea were lrst shown by von BMklsy. The ful lines show the pattern of the deeetion of the cochlear pantidem at maeouesve
instants, as numbesed. The waves are contained within an envelope which is stakc (dotted tines). Stinuhas freguneny- 2M0 Hr From von Bek*sy (1960. Fig. 12.17).
5
3W o ~ o o ~ -70 o
ite
on
Fig 3 A Displacenent envelopes on the cochlear partition are shown for tones of
different freqeacy The lower plot shows she relative phase angle of the
displace-ment From von kksty ( 1960. Fig I I
58I
Figure 1-4: Schematic of organ of Corti. There is a single row of inner hair cells (IHCs) and three rows of outer hair cells (OHCs). 95% of all afferent nerves innervate the IHCs. Note the cut-away of the overlying tectorial membrane [adapted from Kiang, 1984].
cause appreciable changes in HC membrane potential, triggering a synaptic release of
neurotransmitter to the innervating nerves.
There are two distinct types of HCs in the mammalian inner ear: inner hair
cells (IHCs) and outer hair cells (OHCs). There are roughly three OHCs for every
IHC. IHCs receive the bulk of the afferent innervation (going to the brain) while
OHCs receive the bulk of the efferent innervation (coming back down from the brain).
Mammalian OHCs appear unique in that they exhibit somatic cell motility, a process
by which the cell changes its length in response to mechanical or electrical stimulation
[Brownell et al., 1985]. It is commonly believed somatic motility plays an important
role in cochlear mechanics (further described in subsequent sections).
OUTPUT
lose sensitivity for mid-levels, but achelve a reduced output
range 60 dB
-maintain low-level sensitivity (the steeper the slope, the more
sensitive you are to changes)
0dB 120dB
INPUT
Figure 1-5: The CNS has a limited range of inputs (about 60 dB), yet humans are able to hear over a much larger range (120 dB). This may mean that there is some form of compression that packs a large range of inputs into a smaller range of outputs. One sacrifice though is a reduction in level-sensitivity.
1.3
Cochlear Amplification?
Most animals are able to hear over a very large range of sound pressure amplitudes
(dynamic range)' and frequencies (10 octaves for humans). The lower end of the
dynamic range constitutes very small amounts of energy transmitted into the inner ear, comparable to the thermal energy present in the fluids. It was suggested [Gold, 19481 that in order for the ear to be able to detect such small inputs, there must be some sort of active mechanism wherein the ear adds energy to the signal in order to boost its detection (i.e. amplification). The idea is that an active contribution is necessary in light of the input being comparable to the noise floor and the presence of mechanisms for energy loss in the sound conduction pathway (such as the viscous damping of the cochlear fluids).
The notion of the ear being capable of generating power to boost its ability to detect a signal was not taken very seriously until the 1970's when two important
'The dynamic range is about 120 dB for humans, or a factor of a million. Sound intensity goes as the square of pressure, so the human dynamic range spans a million million fold range in energy!
developments took place. One was the discovery of OAEs in a normal healthy human ear [Kemp, 1978]. OAEs were discovered in the course of trying to understand the micro-structure in audiograms, which can vary significantly from person to person. While the initial measurements were made using an evoking stimulus, it was soon found that the ear can spontaneously emit sound (i.e. in the absence of any stimulus) that can be measured in the ear canal using a low-noise microphone. The other development stemmed from the measurements of BM displacement in a living squirrel monkey [Rhode, 1971]. Rhode demonstrated nonlinear growth of the BM velocity with respect to stimulus intensity (compressive growth at CF). The measurements of von Bekesy shown in Fig. 1-3 taken in the apical end of the human cadaver temporal bone do not show nonlinear behavior such as that seen by Rhode. This is in agreement with the observation by Rhode that the nonlinear response was highly physiologically vulnerable. Dead ears behave linearly while healthy ones exhibit robust nonlinear behavior.
It should be emphasized here that compressive growth does not directly imply that an active mechanism is present. Rhode's observation of the high degree of physi-ological vulnerability is more striking in that regard. Compressive growth can be seen as beneficial, extending the range of intensities one is sensitive to when considering the constraint of the limited dynamic range of inputs to the central nervous system (see Fig. 1-5)
The presence of OAEs and compressive growth led to the incorporation of an
active element into cochlear models [Kim et al. 1980, Neely and Kim, 1983] and the
term cochlear amplifier was eventually coined [Davis, 1983]. These models argued that an active contribution was necessary in order to account for the sensitivity and sharp frequency selectivity that the ear was known to be capable of. Furthermore, the knowledge that a healthy ear and a dead ear yielded two very different types of responses (such as whether it exhibited OAEs or compressive BM growth) served to elucidate the notion of a second filter.
9This 'second filter' was devised as the means to explain the discrepancy between the behavior of the BM (insensitive and broadly tuned) and ANF responses (highly sensitive and sharply tuned).
Rhode's data were later re-examined using a cochlear model that took an inverse approach [Zweig, 1992; also see de Boer, 1996]. Here, the form of the model was assumed (based upon simple physical and anatomical assumptions) and a 'backward' approach was taken to solve for the model's parameters using the measured data as
the model solution0. It was found that in order for the model to predict the measured
data, it must exhibit a region where the real part of the cochlear input impedance was negative (i.e. active energy contribution).
All these observations described above provided a foundation for the notion that an amplification mechanism(s) was present in the ear that serves to boost detection of low-level signals. These mechanisms would thus play a pivotal role in extending the dynamic range of the ear (Fig. 1-5) and the overall nonlinear level growth response. Furthermore, active elements inside the inner ear could account for OAEs, particularly spontaneous emissions. The fact that responses were highly physiologically vulnerable only strengthened this argument.
The physical origin of the active mechanism is currently an issue of intense de-bate. There are two prominent sides which argue as to what is the basis for cochlear amplification:
" OHC motility - Upon bundle deflection, experiments have shown that OHCs undergo a conformational change in cell length (with evidence pointing towards a strong role played by the membrane protein prestin). It is thought that these cell length changes mechanically couple back to BM motion, amplifying it [Brownell et al., 1985]". OHC motility appears to beunique to mammalian ears.
*
Transduction channel dynamics - The mechanically gated ion channels atthe tips of the HC bundles have been shown to exhibit appreciable forces when stimulated and even oscillate spontaneously [Le Goff et al. 2005]. While the
10
Inverse approaches are difficult, particularly in the regard that they rarely provide a unique solution.
"It has also been proposed that changes in OHC stiffness (due to prestin conformational changes) are an important factor [He et al., 2003]. Current research has cast some doubt on this notion however, suggesting stiffness changes may be artifactual [Hallworth, 2007].
elements constituting these channels are not well understood, it is thought that they can exert forces in a physically beneficial way to effectively boost the
bundle's motioni2
While neither of these two approaches has convincingly addressed the issue, they have provided much insight into what the underlying mechanism could be and how various components could work together to form it. It is plausible that both the above processes are present in the mammalian ear and work together. Furthermore, it remains to be seen how possible amplification mechanisms differ in mammals and non-mammals (evidence in the latter has indicated a lack of hair cell somatic motility), one of the underlying themes motivating this thesis.
Based upon the observation of spontaneous otoacoustic emissions alone, it is clear that there is some sort of active mechanical mechanism which allows for a flow of energy out of the ear. Statistical analyses have indicated that SOAEs are not merely filtered noise (which might derive from thermal energy present in the inner ear fluids),
but result from a stable, self-sustained oscillator 3. Furthermore, both the cochlear
responses indicative of a healthy ear (such sharp tuning derived from ANF measure-ments) and OAEs show a similar time course in physiological vulnerability, indicating that the two are intimately linked". So while the basis (and existence) of cochlear amplification is still hotly debated, OAEs present a fruitful means towards
under-standing a possible role of active mechanisms'5.
2The ion channels at the tips of the stereocilia have a strong nonlinear dependence upon Ca2+.
This observation sets the basis for a model where the active mechanical mechanisms at the bundle tip rest on the boundary of an instability [Choe et al., 1998]. As a result, a small deflection can push them into an unstable region where amplification can occur.
3
Some descriptions have proposed that SOAE generation is highly analogous to the amplification process taking place in a laser cavity [Shera, 2003].
"This link has been extensively exploited with the development of OAEs for clinical use, as described in the next section.
"As a caveat, we should emphasize the point that the term cochlear amplifier is not well defined and tends to be used in a number of highly variable contexts.
1.4
Mammalian Otoacoustic Emissions
Much effort has gone into understanding OAEs and how they are generated. This is an important step in furthering our understanding of how the underlying cochlear amplification processes function. A key motivation of this thesis stems from the notion that there are many popular misconceptions and varied consensus about the nature of the cochlear amplifier as noted above. One advantage of the OAE approach (as opposed to more direct physiological measurements) is that OAEs can be measured non-invasively. This provides a window into a healthy, normal-functioning ear (direct physiological visualization of the inner ear requires extensive surgery that can damage the sensitive structures inside). However, as a disadvantage, the ear is composed of many parts and OAEs provide effectively only a 'scalar' measurement coming from this complex system".
In the mammalian inner ear, pressure differences propagate along the length of the cochlear partition, setting up a traveling wave (Fig. 1-2). Along its length, there is an impedance gradient of the BM due to changes in width/thickness/.... (downward trend seen in Fig. 1-6). This gradient gives rise to a tonotopic distribution, where different locations resonate at different frequencies. From here on out with respect to notation, I will use BM to refer to the cochlear partition for simplicity. However, the actual partition itself is composed of multiple structures (the basilar membrane, organ of Corti and tectorial membrane).
One theory of mammalian OAEs postulates that certain types of emissions arise due to a back-scattering of energy propagating along the length of the BM (Zweig and Shera, 1995]. The basic idea is that in addition to the gross changes in BM impedance, there is a continuous distribution of random impedance irregularities along the length of the BM ('roughness' as shown in Fig. 1-6). As the traveling wave propagates along the cochlear length [Bekesy, 1960], the response will grow at the characteristic place for a given frequency component of the stimulus (Fig. 1-7). This
'6Specifically, one needs to tread carefully when equating OAE properties back to specific com-ponents of the inner ear, where the whole is more than the sum of the parts ('categorial novum' as outlined by the German polymath Nicolai Hartmann; also see Gestalt theory for parallels as well as
C )
o
W
Pre-existing mechanical
perturbations
o-0
base
Cochlear Location
0-
apex
Figure 1-6: Effective stiffness of cochlear partition changes along its length due to varying thick-ness, mass, etc. Additionally, it is hypothesized that there is a uniform distribution of random impedance irregularities. These can arise from a number of factors such as sudden changes in cell density or membrane stiffness, micro-variations in the fibrillar structure of the BM or TM, or differ-ences in the coupling of the micro-mechanical structures (ex. HC-TM connections). Adapted from Shera and Guinan, 2006.
will result in a region of scattered energy (due to the impedance irregularities) that can interfere constructively to form a backward-propagating signal. Back-scattered energy is thought to be the basis for reflection-based OAEs (as described below). The
active mechanism(s) is thought to play an important role here (particularly at lower
levels) in order to help boost the response amplitude at the characteristic place. This model has shown consistent agreement with physiological data [Shera and Guinan, 2006].
This reflection-based framework has been further developed to explain both spon-taneous emissions [Shera, 2003] and aspects of other emisson types [Kalluri and Shera, 20011. It is most beneficial at this point to develop some of the background on cochlear mechanics necessary to describe the model's implications/predictions, which are im-portant aspects of the proposed thesis.
Fig. 1-7 shows a snapshot of the BM for two different single tone inputs (dark curve for frequency fi and grey curve for frequency f2, where f2 > fi). The 'snapshot' is taken at the same point in the stimulus phase for the given frequency. The purpose of the figure is to demonstrate two different principles:
Wave shifts when frequency increases
f2
>
f1
Stapes
high CF
lwC
SM
~(base)
(px BMamplitude
(snapshot)cochlear
KEY POINTS:
location
1.- Wave pattern shifts with frequency
2. # of wavelengths is preserved
Figure 1-7: Snapshot of basilar membrane traveling wave for two different single tonal inputs. Goal of figure is to demonstrate concept of scaling symmetry. See text for description.
1. Tonotopy
-The cochlear partition's width and thickness increase along the
length (longitudinally) of the mammalian cochlea and that forms the basis for a
tonotopic gradient. The frequency at which a given location along the BM has a
maximum amplitude response is called the characteristic frequency (CF) for that
spot. Basal locations have higher CUs and they decrease monotonically as you
move towards the apex. Thus, frequency maps to space (e.g. the characteristic
place
+-+characteristic frequency).
2. Scaling Symmetry
-Measurements indicate that the shape of the traveling
wave vibration pattern remains fairly constant (at least locally) as you move
along the length of the BM with respect to the CF at that given location.
Qualitatively, the number of wavelengths accumulated between the stapes and
the peak of the response will be approximately constant for different
frequen-cies/locations. In more quantitative terms, the BM response is said to scale.
The response at a given point is no longer dependent upon both the stimulus
frequency
f
and the CF at that spot, but just the ratio f /CF of the two. The
place (or frequency) scale is effectively normalized by the characteristic place
Place-Fixed
Wave-Fixed
(Pro-Existing Perturbations)
Wave shifts when Wave shifts when
frequency increases frequency increases
Stapes
Pre-existing perturbation Induced souce/perturbation
remains fixed in space . moves with the vave
N\
-Phase changes at source Wave phase stays
cosant at source
Cochlear Location
Cochlear Location
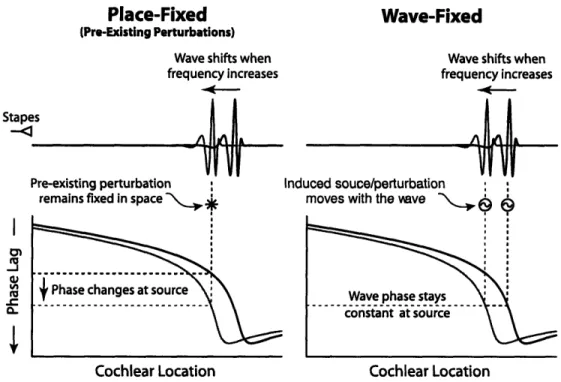
Figure 1-8: Snapshots of BM response to demonsrate wave-fixed versus place-fixed behavior. Since frequency maps to space, the x-axis here is effectively frequency. Wave-fixed emissions have a constant phase as frequency changes, while place-fixed emissions have a changing phase. 'Source' here refers to primary site of generation of backward-propagating energy. In the place-fixed case, it is a scatterer fixed at a given location while in the wave-fixed case, the source is at the peak of the traveling wave. [Shera, 2004]
These two properties have consequences for the frequency dependence of OAE phase as shown in Fig. 1-8. The purpose of this figure is to visually show how the phase of the emission can have a different frequency dependence based upon the underlying mechanism responsible for generation. OAE data have shown emissions evoked using one stimulus paradigm result in emissions whose phase is relatively invariant with stimulus frequency (DPOAEs), while a different stimulus paradigm evokes an emission whose phase depends strongly upon frequency (SFOAEs).
As described earlier, there is a gradual variation in BM impedance along its length giving rise to a tonotopic distribution. Additionally, superimposed on top of this there is a uniform distribution of small impedance irregularities (Fig. 1-6). Due to sudden jumps in impedance between adjacent locations, these irregularities will affect the forward-propagating energy, reflecting some back towards the stapes. This will be more prevalent in regions where the response amplitude is maximal. For simplicity,
we conceptualize to one spot of irregularity as shown shown on the left of Fig. 1-8. Since this spot is scattering energy backwards, it is thus acting as an emission
source. As the frequency of the stimulus changes, the phase at this source location
will change. We refer to the phase response of an emission generated by such a reflection mechanism as place-fixed. Conversely, if the emission arises at the peak of
the traveling wave (perhaps due to distortion arising from cochlear non-linearities),
scaling symmetry constrains the phase to vary little as frequency changes. This is shown on the right and we refer to this phase behavior as wave-fixed".
The place-fixed versus wave-fixed distinction was used as a basis for the OAE classification scheme shown in Fig. 1-9. It describes mammalian emissions as aris-ing from two fundamentally different mechanisms: linear reflection (place-fixed) and non-linear distortion (wave-fixed) [Shera and Guinan, 1999]. Emission data are classi-fied by their phase behavior: stimulus frequency emissions (SFOAEs) have a rapidly
rotating phase response (place-fixed) while 2f 1 - f2 distortion product emissions
(DPOAEs) have a relatively flat phase (wave-fixed). Furthermore, OAEs measured at the ear canal typically contain a mixture of both components. For example, this is
reflected in the phase response for different components of 2f2 -
fi
upon un-mixing[Kalluri and Shera, 2001]. It is worth noting here that the nature of cochlear non-linearity(s) that gives rise to the DPOAEs is not yet well understood. One general train of thought is that they arise at the point of transduction in the hair cells.
As mentioned earlier, the theory of reflection-based evoked emissions has also been further developed to explain the generation of SOAEs [Shera, 2003]. In this model, waves can be reflected not only from coherent reflection via BM irregularities (forming backward-traveling waves), but from the stapes as well, thereby effectively recreating forward-traveling waves. This process thereby sets up standing waves in the cochlea where loss of energy (from both viscous forces and only partial reflection of acoustic energy at the stapes, where the 'leaked' energy then appears in the ear canal as an SOAE) is counteracted by the active gain mechanism inside the cochlea. Thus, the
"As a note, I will use the terms phase-gradient and delay interchangeably to refer to how the phase changes with frequency, though these terms are not necessarily physically the same.
Mechanism-Based Taxonomy for OAEs
Otoacoustic Emissions
OAE that arise by OAs that a by
Linear Reflection Nonlinear Distortion
Reflection Emissions Distortion Emissions
Due to coherent reflection from Due to nonineaities acting as 'sources' 'random'impedance pertrbations of cochlear traveling waves
Exam ples: Echo emissions (SFOAEs Examples: DPOAEs when coherent and TEOAEs) at iow levels reflecoAs th are DP placeis
negligible
Spontaneous Emissions Evoked Emissions
Due to standing waves caused by 'ruaway' Typically, a mixture of emissions mnultiple iternal chrn fito produced by both mechanisms
stabilized by no=nXre anoncinearities
Figure 1-9: Schematic showing proposed classification scheme for mammalian OAEs. [adapted from Shera and Guinan, 1999]
model proposes that the mammalian cochlea is acting as a hyciro-mechanical analog
to a laser cavity 8 n
In addition to elucidating the role of a possible amplification processes, another motivation for better understanding OAE generation stems from the fact that audiol-ogists make extensive use of their measurement in the clinic for diagnostic purposes. Emissions are generated in the normal healthy ear, so an absence or abnormality in their characteristics can indicate possible pathologies to an audiologist. Furthering our knowledge of how emissions are generated potentially extends their usefulness in the clinic. For example, if we can better understand the correlation between emission phase gradients and cochlear tuning, OAEs could provide a direct and objective mea-sure of an individual's frequency selectivity [Shera, Guinan and Oxenham, 2002119. Also, by clarifying misconceptions which abound for OAEs, clinicians can avoid mis-interpretation and incorrect diagnoses.
1 5
A strength of this specific model for SOAEs is that it makes testable predictions based upon the relation between different emission types (that have been shown to be consistent with human emission data).
19
1.5
Non-mammalian Ears
The general morphology of the non-mammalian auditory periphery is similar to that of mammals in the sense that there are distinct outer, middle and inner ears. Similar to the human, all the non-mammalian species examined here (chicken, gecko and frog) have a tympanic middle ear. However, outer ear anatomy differs greatly. While the chickens have an external auditory meatus, the frog does not (their TyM is flush with the side of their head). Geckos have a shallow recess in which their TyM sits. We did not examine closely how outer ear properties (such as TyM thickness or effective
area) compare across species.20
For the middle ear, all three species have a similar ossicular structure. This comprises a single connecting bone called the columella, which couples the TyM to the stapedial footplate (in contrast to three bones in the human ear). One point of view is that a single ossicular system is not an efficient transmitter of higher frequency information and thus has led non-mammalian inner ears to evolve towards
optimizing detection of lower frequency sounds [Manley, 1990]. All three species
show some degree of direct acoustic coupling between both tympanic membranes via coupled middle ear airspaces (again, in contrast to humans). This is achieved via the the inter-aural tube in the chicken, and by the oral cavity in the gecko and frog. This coupling is believed to provide a mechanism for increased binaural directional sensitivity [Fletcher and Thwaites, 1979]. Differences aside, the middle ear plays a very similar mechanical role in these non-mammalian species as it does in mammals. Specifically, it acts as an impedance transformer, transmitting sound pressure from a low impedance medium (air) to a high impedance one (the fluids of the inner ear). The role of the middle ear is also important to consider within the context of this study, as it is the means by which energy generated by the inner ear (associated with the OAE generation mechanisms) is subsequently transmitted outwards and appears at the outer ear as an emission.
The greatest diversity across these species is apparent upon examination of the
2 0
1t is worth noting that a tympanic outer ear is not necessary for the detection of eOAEs [van Dijk et al., 2002].
inner ear anatomy. A schematic providing an overview of the inner ear anatomy in the different species examined in this study is shown in Fig. 3-1. Differences both in terms of anatomy and hearing perception across the non-mammalian species are described in detail in Ch.3.
1.6
Non-mammalian Otoacoustic Emissions
As mentioned previously, numerous studies have examined non-mammalian OAEs. Spontaneous emissions have been seen in most groups of vertebrates tested. These include birds [Taschenberger and Manley, 1997], lizards [Koppl and Manley, 1993] and frogs [van Dijk et al., 1996]. However, in a given class, there can be much diversity across species with regards to the presence of SOAEs. For example, SOAEs have not been observed in chicken ears while they have been reported to be readily apparent in owls. Furthermore, in a given species, ears from a limited percentage of all individuals
may readily emit spontaneously while the majority of ears do not21.
Reports of OAEs in non-mammals have typically focused upon evoked emissions. Various aspects of these studies are discussed in more detail in Ch.3-6. It is also worthwhile to note that OAEs have been examined in non-vertebrate species such as moths and grasshoppers. Non-vertebrate studies are described in more detail in Ch.4. What is clear from these studies is that most types of ears are capable of emitting sound. So in spite of significant morphological differences across species, OAEs are a common feature and appear to be a relatively generic property of the ear [Koppl, 1995]. This observation motivates further study of emission properties to better understand how the underlying generation mechanisms are similar and different across species. Knowledge of how emission properties compare coupled with what we know about how the underlying anatomy/physiology differs across species will serve to reveal fundamental processes that are common to all ears.
2 1
This has been readily apparent over the course of study described in this thesis. Some individual geckos readily show consistent SOAE activity, though the majority of the animals did not exhibit any SOAEs at all.
1.7
Summary of Approach
Human anatomy and OAEs have been well characterized and serve here as a reference for our interpretation across species. To summarize, we are looking at four different species, only one of which (based upon present evidence) has hair cells exhibiting somatic motility (humans) and two which are thought to lack a traveling wave prop-agating along the length of the auditory organ via a flexible BM (geckos and frogs). Perceptual aspects of auditory function in the non-mammalian species examined in this study are summarized briefly in Ch.3
The primary approach of the current study is to examine OAE magnitude and phase behavior across a number of different species in a systematic way. For this study, we use a single measurement system and stimulus paradigms to avoid systematic errors which might confound interpretation. Many previous OAE studies have failed to report phase information, which as alluded to above, can provide additional insights into emission generation. We look across a variety of species focusing upon two different types of emissions: distortion products (DPOAEs) and stimulus frequency emissions (SFOAEs). As there are a large number of different stimulus conditions which can conceivably be tested, we will limit ourselves here to those which will address the following four groups of questions (while maintaining the comparative approach throughout):
" How do SFOAE phase gradient delays compare across species? What type of information do these phase gradients reveal?
" Does the mammalian OAE classification scheme apply to non-mammalian ears? Specifically, do non-mammalian ears exhibit evidence for multiple
mech-anisms of emission generation?
" How does emission frequency dependence vary with respect to stim-ulus intensity? In particular, how do eOAE phase gradients vary with level? " At a fixed frequency, how do emission properties vary with respect to stimulus intensity? Is there evidence for multiple level-dependent OAE
gen-eration mechanisms in the ear (which could potentially explain non-monotonic growth)? Does dependence upon stimulus intensity differ significantly across species?
The subsequent chapters in the thesis further motivate each one of these four groups of questions and present data to address each.
Chapter 2
eOAE Methods
2.1
Measurement System
All measurements reported in this thesis were obtained using the same stimulus paradigms, acquisition codes, and ER-10C for all species. A desktop computer housed a 24-bit soundcard (Lynx TWO-A, Lynx Studio Technology), whose synchronous I/O was controlled using a custom data-acquisition system written in C. Experiments performed on chicken ears were done at University of Pennsylvania using a different computer, soundcard (same model) and isolation booth, but all other aspects were identical. A sample rate of 44.1 kHz was used to transduce signals to/from an Ety-motic ER-10C (whose gain was set at +40 dB). The microphone signal was filtered using a high-pass filter (consisting simply of a resistor and capacitor) with a cut-off frequency of 410 Hz.
The probe earphones were calibrated in-situ using flat-spectrum, random-phase noise. These calibrations were repeatedly verified throughout the duration of the experiment for a given subject. Re-calibration was performed if the actual level presented differed by more that 3 dB from the specified value. The microphone calibration was tested using a pistonphone (which had a 94 dB SPL output at 1007 Hz) and found to conform well to the shipped specifications. The microphone frequency response was flat (within ±1-2 dB) across frequency range examined in this study.
OAE Measurement System
24 bit A/D and D/A COMPUTER
[all acquisition/analysis software coded in C]
probe coupled N 'OAE probe contains a microphone tightly to ear and two earphones (to minimize system
noise reduction chamber distortion)
Figure 2-1: Schematic showing overview of measurement system. The same stimulus paradigms were used for all species. Measurement equipment was the same for the humans, geckos and frogs. Chicken measurements were performed at University of Pennsylvania using a different computer, soundcard and isolation booth, but all other equipment was the same.
2.2
Stimulus Paradigms and Analysis
For SFOAEs, we used a suppression paradigm similar to that previously employed by Shera and Guinan (1999). A schematic of this method is shown in Fig. 2-2. The first earphone (EP1) produces a signal consisting of a 464 ms sinusoidal buffer at the probe
frequency
f,,
ramped on/off over 12 ms at the ends of the buffer. The second earphone(EP2) also produces a 464 ms signal, but at the suppressor frequency
f,
which wasramped on only during the latter half of the buffer (the first half was silence). The microphone response was extracted from two 186 ms (8192 pts.) segements from the total buffer, one from the probe alone and one with the probe+suppressor. These segments were taken at least 20 ms after the end of the ramping-on periods to allow
any transient behavior to decay1. Thus, the measurements reported here are for the
steady-state condition.
The Fourier transform of each segment was taken and the complex difference of
the two Fourier coefficients at
f,
revealed the emission magnitude and phase. Unless'Phase shifts introduced with these delays were accounted for and described in further detail in Appendix D.
Step 1.
Step 2.
Present Probe Alone
Present both Probe &
(emission is present)
Suppressor
tones(emission not present)
FFT reveals magnitude
Step 3.
and phase AT Probe Freq. FFT reveals magnitude Subtract phasors
and phase AT Probe freq. Im
Im I
Total
TotalProbe
SFOAE
rvealed!!pressure
pressure
ur
Re Re
-
Since the system is non-linear, the presence of the suppressor tone
will affect what is going on at the probe frequency (Step 2)
-
Subtraction of the phasors in the complex plane reveals both the
magnitude and phase of the OAE in the suppression paradigm
Figure 2-2: SFOAE suppression paradigm schematized.otherwise noted, the suppressor level (L,) was 15 dB above the probe level (L,) and
f,
was 40 Hz abovef,.
When measuring level growth functions, stimulus levels wererandomized. For DPOAEs, each earphone produced a single frequency (EPI - fi,
EP2 - f2) over a 244 ms buffer, each tone being ramped on/off at the ends. Similar to the SFOAEs, a 186 ms segment was extracted from the microphone response.
For both SFOAEs and DPOAEs, 35 buffers were averaged, excluding any flagged by an artifact-rejection paradigm (similar to that of Shera and Guinan, 1999)2. Fur-thermore, all stimulus frequencies were quantized such that an integral number of stimulus periods fit in the response segment. This means that the nominal values of quantities such as
f,
-f,
and f2/fl (which are specified to be constant for a given fre-quency sweep) could vary a small amount between successive steps in a sweep. These variations were always less than 2% (and usually much smaller). Frequency step-size during sweeps was small enough to avoid ambiguity during the phase unwrapping2
The artifact rejection was done in the time domain by subtracting two buffers and applying a threshold criterion to the largest difference. The presence of the high-pass filter for the microphone signal significantly increased the usefulness of the artifact rejection paradigm (noise was largest at frequencies below ~200 Hz).
(described further below).
The response from the microphone was Fourier transformed and depending upon the emission type, either the emission magnitude and phase (SFOAEs) or the whole spectrum (DPOAEs) saved to file. Further analysis was done using Matlab (phase correction, phase unwrapping, etc.). Unless otherwise noted, all error bars indicate the standard error of the averages for a given stimulus set (after standard propagation of error among the various measured quantities). The noise floor was found by averaging the i3 frequency bins adjacent to the one of interest for both SFOAEs and DPOAEs. In the case where multiple emissions are plotted together, the noise floor curve shown is typical of what is seen for any given measurement.
2.2.1
I/O Delays
In addition to determining the necessary voltages to drive the earphones, the calibra-tion characterized the delay associated with the D/A (signal from computer going to the earphones) and A/D (response signal coming from microphone to computer) con-verters. These delays, totaling -2.5 ms, account for the electronic delay associated with I/O delays from the 24 bit A/D and D/A converters. The total system delay is described in more detail in Appendix D. It was important to quantify this delay as it must be accounted for in the emission phase.
For DPOAEs, the relative contribution (to the total phase shift) between the shifts associated with the D/A and A/D also needs to be measured. Basically, the relative electronic delays were measured by passing the signal across a diode (which acts as an instantaneous nonlinearity), providing a reference phase for any given distortion product that can be used to correct the DPOAE phase. Corrections to account for phase shifts associated with measurement system I/O delays are described in more detail in Appendix D. OAE phase results using this method were consistent with those previously reported [Knight and Kemp, 2000; Shera and Guinan, 1999].
2.2.2
System Distortion
Distortion associated with nonlinearities in the measurement system was present and introduced some degree of artifact. However, as described below, artifactual distortion was relatively small compared to the eOAEs and could be clearly distinguished from emissions. The physical basis for this distortion most likely derives from nonlinear characteristics of the ER-10C earphones. The probe contained two earphones, due to the fact that a significant amount of intermodulation distortion was present when a single earphone was driven with two sinusoids (harmonic distortion is described below). However, the output of the earphones was linear with respect to driving voltage.
System distortion could be measured in a number of different ways (i.e. probe coupling configurations). In the simplest case, artifactual distortion was measured using small cavities (~0.5 cc), with both rigid and non-rigid terminations. Emission measurements were also made in a profoundly deaf subject (sensorineural hearing loss with a unilateral cochler implant; presumably lacking any emissions) to provide a measure with a comparable acoustic coupling to that for human subjects (where the volume is larger, -3 cc)3.
For DPOAEs, distortion occurred at both harmonic and intermodulation frequen-cies. Quadratic and cubic harmonic distortions (with the probe coupled in various configurations) are shown in Fig. 2-3 and Fig. 2-4. Several observations are worth noting. First, the amplitude of the harmonic distortion depends strongly upon the
earphone's acoustic load impedance. Second, both fi and f2 harmonics appear to be
'filtered' in a similar way (this is more apparent in the cubic case). Third, emission phase (which is corrected for I/O delays) does exhibit a complex frequency depen-dence (the phase of the primaries is constant and zero). The source of this frequency dependence is unknown. The bottom-line here is that the ER-10C is a poor choice
3Though this subject had a cochlear implant in one ear, both ears were tested. SFOAE (L,
= 40 dB SPL) and DPOAE (L1 = L2 = 65 dB SPL, f2/fl = 1.22) measures were found to be completely in the noise floor, the noise being comparable to that present in most human subjects. So no artifact was apparent at all in either ear for this subject.