HAL Id: hal-00076849
https://hal-insu.archives-ouvertes.fr/hal-00076849
Submitted on 22 Jan 2013
HAL is a multi-disciplinary open access
archive for the deposit and dissemination of
sci-entific research documents, whether they are
pub-lished or not. The documents may come from
teaching and research institutions in France or
abroad, or from public or private research centers.
L’archive ouverte pluridisciplinaire HAL, est
destinée au dépôt et à la diffusion de documents
scientifiques de niveau recherche, publiés ou non,
émanant des établissements d’enseignement et de
recherche français ou étrangers, des laboratoires
publics ou privés.
Source and H2O content of high-MgO magmas in island
arc settings - An experimental study on primitive
calk-alkaline basalts from St. Vincent, Lesser Antilles.
Michel Pichavant, B. O. Mysen, Ray Macdonald
To cite this version:
Michel Pichavant, B. O. Mysen, Ray Macdonald. Source and H2O content of high-MgO magmas
in island arc settings - An experimental study on primitive calk-alkaline basalts from St. Vincent,
Lesser Antilles.. Geochimica et Cosmochimica Acta, Elsevier, 2002, 66, pp.2193-2209.
�10.1016/S0016-7037(01)00891-2�. �hal-00076849�
PII S0016-7037(01)00891-2
Source and H
2O content of high-MgO magmas in island arc settings: An experimental
study of a primitive calc-alkaline basalt from St. Vincent, Lesser Antilles arc
M. PICHAVANT,1,* B. O. MYSEN,2
and R. MACDONALD3
1Institut des Sciences de la Terre d’Orle´ans (ISTO), UMR 6113 CNRS-UO, 1A rue de la Fe´rollerie, 45071 Orle´ans, France 2Geophysical Laboratory, Carnegie Institution of Washington, 5251 Broad Branch Road, NW, Washington, DC 20015-1305, USA
3Environmental Science Division, IENS, Lancaster University, Lancaster LA1 4YQ, UK
(Received June 6, 2001; accepted in revised form November 28, 2001)
Abstract—Liquidus phase relationships have been determined for a high-MgO basalt (STV301: MgO⫽12.5
wt%, Ni⫽250 ppm, Cr⫽728 ppm) from Black Point, St Vincent (Lesser Antilles arc). Piston-cylinder experiments were conducted between 7.5 and 20 kbar under both hydrous and oxidizing conditions. AuPd capsules were used as containers. Compositions of supraliquidus glasses and mass-balance calculations show that Fe loss is ⬍ 10% in the majority of experiments. Two series of water concentrations in melt were investigated: (i) 1.5 wt% and (ii) 4.5 wt% H2O, as determined by SIMS analyses on quenched glasses and with
the by difference technique. The Fe3⫹
/Fe2⫹
partitioning between Cr-Al spinel and melt and olivine-spinel equilibria show that oxidizing fO2were imposed (NNO ⫹ 1.5 for the 1.5 wt% H2O series, NNO ⫹ 2.3 for
the 4.5 wt% H2O series). For both series of water concentrations, the liquid is multiply-saturated with a spinel
lherzolite phase assemblage on its liquidus, at 1235°C, 11.5 kbar (1.5 wt% H2O) and 1185°C, 16 kbar (4.5
wt% H2O). Liquidus phases are homogeneous and comparable to typical mantle compositions. Mineral-melt
partition coefficients are generally identical to values under anhydrous conditions. The modal proportion cpx/opx on the liquidus decreases from the 1.5 wt% to the 4.5 wt% H2O series. The experimental data are
consistent with STV301 being a product of partial melting of lherzolitic mantle. Conditions of multiple saturation progressively evolve toward lower temperatures and higher pressures with increasing melt H2O
concentration. Phase equilibria constraints, i.e., the necessity of preserving the mantle signature seen in high-MgO and picritic arc basalts, and glass inclusion data suggest that STV301 was extracted relatively dry (⬃ 2 wt% H2O) from its mantle source. However, not all primary arc basalts are extracted under similarly dry
conditions because more hydrous melts will crystallize during ascent and will not be present unmodified at the surface. From degrees of melting calculated from experiments on KLB-1, extraction of a 12.5 wt% MgO melt with ⬃ 2 wt% H2O would require a H2O concentration of 0.3 wt% in the sub-arc mantle. For mantle sources
fluxed with a slab-derived hydrous component, extracted melts may contain up to ⬃ 5.5 wt% H2O. Copyright © 2002 Elsevier Science Ltd
1. INTRODUCTION
High-MgO (MgO ⱖ 8 wt.%) basalts are relatively uncom-mon in modern subduction zone settings. Nevertheless, they occur in virtually every island arc and are of great petrological significance as these basalts possibly represent one type of primary magma in subduction zones (e.g., Tatsumi and Eggins, 1995 and references therein). As such, they constitute valuable sources of information on the conditions of partial melting and the thermal structure of the mantle wedge beneath island arcs. In addition, knowledge of the H2O content of primary arc
magmas is important in assessing processes of volatile and material recycling in subduction zones.
Information on the conditions of genesis of high-MgO arc basalts has come mainly from experimental studies. Yet, till now, most high-pressure experimental studies on high-MgO arc basalts have been performed under anhydrous conditions (Tat-sumi, 1982; Tatsumi et al., 1983; Gust and Perfit, 1987; Kushiro, 1987; Bartels et al., 1991; Draper and Johnson, 1992; Baker et al., 1994; Tatsumi et al., 1994). Water-bearing exper-iments have been carried out in only three studies (Tatsumi, 1982; Tatsumi et al. 1983; Baker et al., 1994). Another
char-acteristic of those experiments is that experimental fO2
condi-tions generally have been too reducing for arc settings (Tat-sumi, 1982; Tatsumi et al., 1983; Gust and Perfit, 1987; Bartels et al., 1991; Draper and Johnson, 1992). Consequently, only a very limited number of experimental studies are truly applica-ble to real conditions of basaltic melt generation in subduction zones.
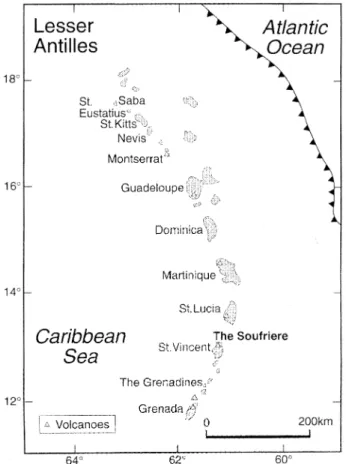
The Lesser Antilles intraoceanic island arc is the surface manifestation of the subduction of the American plate beneath the Caribbean plate (Fig. 1). The arc contains a wide range of magma types (Brown et al., 1977; Macdonald et al., 2000), from low-K tholeiites (north), calc-alkaline basalts (central islands) to alkalic basalts in Grenada (south). Primitive, high-MgO and picritic basalts occur mainly in the central and southern parts of the arc. The Soufriere volcano in the northern part of the island of St Vincent is composed almost entirely of calc-alkaline basalts and basaltic andesites (Heath et al., 1998). The most magnesian basalts from Soufriere, St Vincent, resem-ble high-MgO and picritic basalts known in other arcs, for example Vanuatu (Eggins, 1993), NE Japan (Kushiro, 1987; Tatsumi et al., 1994) and the Aleutians (Nye and Reid, 1986; Draper and Johnson, 1992). Heath et al. (1998) have argued that the high-MgO basalts exposed at St Vincent represent primary mantle-derived magmas and are parental to the
* Author to whom correspondence should be addressed (pichavant@ cnrs-orleans.fr).
Pergamon Printed in the USA. All rights reserved
0016-7037/02 $22.00 ⫹ .00
andesites which dominate the eruption products in the central and northern parts of the arc. Therefore, these basalts shed light on the origin of the calc-alkaline igneous suite in the Lesser Antilles arc.
In this paper, we present a high-pressure experimental study of a sample of primitive calc-alkaline basalt from Soufriere, St Vincent. The experiments were designed (1) to test whether the composition studied is representative of a primary mantle melt; (2) to determine the effect of H2O on the pressure-temperature
conditions of equilibration of the basaltic liquid with its in-ferred mantle source; and (3) to provide constraints on the H2O
content of primitive arc magmas.
2. HIGH-MGO BASALTS FROM SOUFRIERE, ST. VINCENT
At Soufriere, St Vincent, both basalts and basaltic andesites have erupted throughout the volcano’s history, although basalts were volumetrically the most abundant in the earlier stages (Pre-Somma Lavas and Yellow Tuff Formation, see Heath et al., 1998). The basalts range from microphyric fine-grained rocks with abundant (up to 30%) microphenocrysts of olivine (ol), spinel (sp) and clinopyroxene (cpx), to more coarsely porphyritic rocks also containing phenocrystic plagioclase (pl). Olivines up to Fo89.7can be found (Marcelot et al., 1981; Heath
et al., 1998). The ol-sp thermometer of Ballhaus et al. (1991) yields temperatures between 1026 and 1130 °C for these basalts (Heath et al., 1998). The higher end of this range is in agree-ment with older temperature estimates on the same rocks and likely corresponds to crystallization temperatures (see Heath et al., 1998). The St Vincent basalts record fairly oxidizing redox conditions (FMQ⫹1.5 ⬍ fO2⬍ FMQ⫹1.8, Heath et al., 1998).
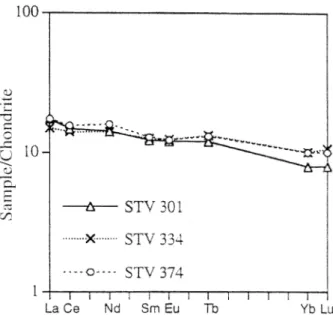
The most magnesian basaltic lava (STV 301, 12.5 wt.% MgO, Table 1; see also Marcelot et al., 1981) from Black Point is slightly nepheline normative, a feature shared with the silica-undersaturated mafic end-members of the Grenada series (e.g., Thirlwall and Graham, 1984). More evolved St Vincent basalts are silica-oversaturated (Heath et al., 1998). Chondrite-normal-ized REE patterns for relatively magnesian basalts (Fig. 2) are flat to slightly LREE-enriched. Mantle-normalized element abundances (Fig. 3) show patterns characteristic of arc basalts,
Fig. 1. Map of the Lesser Antilles island arc showing location of the Soufriere volcano, St. Vincent.
Table 1. Composition of High-MgO Basalt Starting Samples and Glasses.
Sample STV 301a whole-rock ID 16b whole-rock IK85060803c whole-rock STV 301 glass* (1 atm) STV 301 glass** (1500°C, 15 kbar) SiO2 47.01 48.94 49.03 46.86 (35) 45.89 (27) TiO2 1.07 0.70 0.64 1.08 (3) 1.06 (1) Al2O3 15.28 16.01 13.95 15.29 (15) 15.00 (5) FeOt 8.79 8.90 8.95 8.96 (17)° 8.71 (14) MnO 0.16 0.17 0.15 0.17 (3) 0.18 (2) MgO 12.50 11.42 12.38 11.97 (5) 11.75 (9) CaO 10.96 10.89 10.75 11.00 (9) 10.71 (13) Na2O 2.23 2.21 1.93 2.27 (7) 2.19 (4) K2O 0.47 0.52 0.27 0.49 (2) 0.50 (3) H2O nd nd 1.90 0.10 † 2.84† total 98.47 99.76 99.95 98.19 98.83 Cr 728 662 820 nd nd Ni 250 266 nd nd nd
aOlivine basalt, St. Vincent, Lesser Antilles (Health et al., 1998, this work). bHigh-magnesia basalt, Umnak, Aleutians (Draper and Johnson, 1992). cOlivine tholeiite, Ryozen, NE Japan (Kushiro, 1987).
* Average of 41 electron microprobe analyses; numbers in brackets are standard deviations in terms of least unit cited. ** Average of 24 electron microprobe analyses; numbers in brackets are standard deviations in terms of least unit cited. ° FeO ⫽ 1.52 wt% and Fe2O3⫽ 8.26 wt%; Fe
3⫹/Fe2⫹(at.) determined by Mo¨ssbauer spectroscopy. †H
namely high LILE/HFSE and LREE/HFSE, negative Nb anom-alies and relatively high Ba/La. Relative to MORB, the Sou-friere basalts show LILE and LREE enrichment and HREE depletion (Fig. 3). The geochemical characteristics of the Sou-friere basalts are consistent with generation from a mantle wedge similar to, or slightly enriched in HFSE relative to the midocean ridge basalt (MORB) source, and metasomatized by addition of a fluid phase from the subducting slab (e.g., Heath et al., 1998).
3. EXPERIMENTAL STRATEGY AND METHODS 3.1. Strategy
To test the possible origin of the St Vincent basalt by partial melting of the mantle, the inverse approach was used (e.g., Myers and Johnston,
1996; Falloon et al., 1999). Phase relations were studied near the liquidus of the studied composition by means of high-pressure crystal-lization experiments. If the studied magma is multiply-saturated with olivine ⫹ orthopyroxene (opx) ⫹ clinopyroxene on its liquidus, then it is in equilibrium with a lherzolite and is thus considered primary (e.g., Thompson, 1974; Tatsumi et al., 1983, 1994; Kushiro, 1987; Draper and Johnson, 1992; Myers and Johnson, 1996; Falloon et al., 1999). In such a case, the P-T conditions of multiple saturation provide an estimate of the conditions of magma segregation from (or of last equilibration with) its mantle source (e.g., Tatsumi et al., 1983, 1994; Falloon et al., 1999). This conclusion also requires, however, that the phases crystallizing on the liquidus of the study sample have compo-sitions typical of residual upper mantle rocks. Conversely, the absence of multiple saturation with a lherzolite mineral assemblage may indi-cate either that the composition studied is not a primary mantle melt or that a reaction relationship exists between minerals and melt at the P-T conditions of magma segregation (e.g., Falloon et al., 1999).
Previously, the inverse experimental approach has been applied to several primitive high-MgO arc basalts from NE Japan and the Aleu-tians (Tatsumi, 1982; Tatsumi et al., 1983; 1994; Gust and Perfit, 1987; Kushiro, 1987; Draper and Johnson, 1992) and to a primitive high-alumina basalt from the Cascades (Bartels et al. 1991). Under anhy-drous conditions, several were shown to be multiply-saturated with mantle mineral assemblages on their liquidus, in most cases between 1300 to 1350°C and 10 to 12 kbar (e.g., Kushiro, 1987; Tatsumi et al., 1994). Other high-MgO basalt compositions were shown not to be multiply-saturated with a lherzolitic mantle assemblage on their liqui-dus (Gust and Perfit, 1987; Bartels et al., 1991; Falloon et al., 1999). The few data available under hydrous conditions (Tatsumi, 1982; Tatsumi et al., 1983) show that the effect of water is to shift the P-T conditions of multiple saturation towards lower temperatures and higher pressures. However, H2O concentrations in the quenched melt
(glass) were not determined in previous studies and the effect of H2O
remains to be established quantitatively.
The major difference between this work and previous inverse exper-imental studies on arc basalts is that experexper-imental conditions more relevant to arc settings were imposed, i.e., presence of water and oxidized fO2. To satisfy these requirements, several aspects of the high
pressure methodology were adapted, as detailed below.
3.2. Starting Materials and Capsules
Sample STV 301 (MgO ⫽ 12.5 wt.%, Heath et al., 1998) was selected for the experimental study. It has Ni ⫽ 250 ppm and Cr ⫽ 728 ppm (Table 1), contains olivine, clinopyroxene and spinel microphe-nocrysts, and has an olivine/whole-rock Kd(Fe-Mg) ⫽ 0.33 (Heath et al., 1998), indicating no significant crystal accumulation. Two types of glasses with different initial H2O contents were used as starting
mate-rials. First, a nominally dry glass was prepared by fusing 8 g of the powdered rock sample in air at 1400°C for several hours (Macdonald et al., 1998). Second, a hydrous glass was synthesized by reacting the previous glass plus ⬃ 2.6 wt.% H2O at 1500°C, 15 kbar, for 1 h. Three
batches of hydrous glasses were used in this study. The water concen-tration of the starting glasses was analyzed by Karl-Fischer ticoncen-tration (Behrens et al., 1996) with an uncertainty of ⫾ 0.1 wt.%. The glass prepared at 1 atm contains 0.10 wt.% H2O and has a Fe3⫹/Fe2⫹ratio
(at.) of 4.88 (Table 1) as determined by Mo¨ssbauer spectroscopy. The hydrous glasses have final H2O concentrations (2.84 to 2.91 wt.%)
slightly higher than the amount of water initially present in the capsule, which suggests that they gained some H2O during synthesis. Because
the hydrous glasses were available in small quantities, no Mo¨ssbauer analysis was performed. Some starting glasses were examined by FTIR to check for the presence of H2O and absence of C-bearing species.
About 10 mg of glass (either nominally dry or hydrous) was loaded into a Au70Pd30capsule (length: 6 to 8 mm, ID: 2.6 mm, wall thickness:
0.2 mm) which was welded shut with a small torch and then placed in the furnace assembly. The choice of Au70Pd30capsules was dictated by
the necessity to impose oxidizing conditions (i.e., above graphite sta-bility) and to limit the presence of C as an additional component, therefore eliminating graphite containers. It is shown below that the performances of Au70Pd30alloy with respect to Fe loss are reasonably
good in the experimental T-fO2 range covered in this study (i.e.,
Fig. 2. Chondrite-normalized REE abundances in selected basalts from Soufriere, St Vincent. After Heath et al. (1998).
Fig. 3. Primordial mantle-normalized trace element plots for selected basalts, Soufriere, St Vincent, and MORB. After Heath et al. (1998).
⌬NNO ⬎ 0 and T ⬍ 1300°C), in agreement with previous results (Kawamoto and Hirose, 1994).
3.3. Equipment and Run Procedure
The high-pressure experiments were performed in three end-loaded, 1/2⬙ piston-cylinder apparatuses at the Geophysical Laboratory, Wash-ington DC, using the hot piston-out technique. The furnace assemblies consisted of graphite tube furnaces, AlSiMag inner parts, and outer sleeves of pyrex and talc imposing a H-rich environment in the high-pressure cell. In all experiments, the Au70Pd30capsule was encased in
a 0.8 mm thick AlSiMag sleeve that served as a sample holder. Temperatures were monitored using Pt-Pt90/Rh10thermocouples and
are known to better than ⫾ 10°C. After the experiments, checks were made of the position of the thermocouple which needed to be ⱕ 1 mm from the top of the capsule. No pressure correction was applied to the thermocouple readings. Reported pressures incorporate calibrations performed using standard mineral reactions (quartz o coesite and calcite o aragonite). The pressure uncertainty is ⫾ 1 kbar. Run durations ranged between 10 to nearly 24 h, and were around 16 h on average. The samples were quenched in a few seconds by switching off the power to the furnace.
3.4. Analytical Techniques
Experimental capsules were sectioned, then mounted in epoxy and polished. Phase assemblages were identified by optical and Raman microscopy. Seventeen charges (out of a total of 32) were examined with scanning electron microscopy (SEM).
Electron microprobe analysis of the experimental charges was per-formed with the Cameca SX 50 of the Service Commun BRGM-CNRS at Orle´ans, with an acceleration voltage of 15 kV and a counting time
of 10 s on peak. Silicate minerals were used as standards. A sample current of 6 nA and beam sizes of 1 to 2 m were employed for mineral phases and 10 m for glasses. Analysis of the starting glasses revealed no detectable migration of alkalies under the beam (Table 1) and no correction was applied to the Na2O and K2O concentrations (e.g.,
Pichavant, 1987). Analytical errors are: 2% (SiO2, Al2O3, CaO), 3%
(FeO, MgO, TiO2), 5% (MnO, Na2O, K2O) relative. Mass-balance
calculations (Albare`de, 1995) were performed on all major oxides except MnO and H2O to estimate the proportions of phases coexisting
in a given charge and to evaluate quantitatively the extent of Fe loss (Tables 2, 3).
The H2O concentrations in glasses were measured with the Cameca
IMS-3F ion microprobe of the CRPG, Nancy, using the procedures of Deloule et al. (1995). A negative primary oxygen beam with an intensity of 10 nA was focused to produce a spot of 30 m diameter. The mass resolution was set to 800.1H,28Si and30Si were measured;
possible interferences or instrumental biases were monitored by check-ing the Si isotope ratio. An energy offset of ⫺80 eV was applied (Deloule et al., 1995). Counting times varied between 5 s (1H,30Si) to
2 s (28Si). Measurement cycles were accumulated for 10 to 20 min on
each spot. Between 5 to 8 spots were analysed for each sample. Standards were the starting glasses analyzed by Karl-Fischer titration, thus virtually eliminating matrix effects. The uncertainty on the deter-mined H2O content is better than 10% relative.
For charges that could not be analyzed for H2O due to the limited
size of their glass pools or access limitations to the ion microprobe, the H2O contents were estimated using a “by-difference” method modified
after Devine et al. (1995). The difference to 100% of electron micro-probe analyses was calibrated against the dissolved glass H2O content,
the starting glasses being used as standards. These standard glasses were analyzed together with the experimental glasses during each electron microprobe session. Differences in Fe3⫹/Fe2⫹between
exper-Table 2. Conditions and Results for Experiments with the Dry Starting Glass.
Run# P (kbar) T (°C) Duration (hour) Results H2O glass (wt%) ⌬NNO▪ ⌺r2* ⌬FeO§ (%) 15 7.5 1200 19.25 gl(97)‡, ol(2), sp(1) 1.76° ⫹2.1 0.59 ⫺7.4 16 8 1220 16.75 gl(97), ol(2), sp(1) 1.0 ⫹1.7 2.52 ⫺15.8 29 9 1220 18 gl(99), ol(tr), sp(1) 1.3 ⫹0.9 2.18 ⫺15.4 32 9 1200 18 gl(99), ol(tr), sp(1) 1.8 ⫹1.0 2.28 ⫺15.7 11 10 1240 16.75 gl(100) 0.77° — — ⫺7.4 17 10.5 1230 17.5 gl(97), ol(2), sp(1) 1.26° ⫹1.2 2.76 ⫺17.1 10 10 1220 23.25 gl(87), ol(10), opx(⫺9) cpx(14), sp(tr) 1.5 ⫹1.4 1.56 ⫺12.4 9 10.5 1200 14.5 gl(90), ol(5) cpx(5), sp(tr) 0.9 ⫹2.6 0.03 ⫺1.6 30 11 1220 17.5 gl(89), ol(4) cpx(6), sp(1) 1.9 ⫹1.2 0.47 ⫺7.0 19 12 1240 17 gl(100) 1.07° — — ⫺5.5 39 12 1260 2 gl(53), opx(7) cpx(35), sp(5) 1.9 ⫹0.6 0.16 ⫺3.5 31220 318 35 12 1200 19 gl(85), ol(4) cpx(11), sp? 1.4 — 3.78 ⫺20.4 8 13 1250 21.25 gl(100) 1.77° — — ⫺27.4 20 12.5 1210 18 gl(58), opx(6) cpx(32), sp(4) 1.7 ⫹1.8 0.01 ⫺0.3 23 13 1230 13 gl(77), opx(2) cpx(19), sp(2) 0.9 ⫹0.9 1.05 ⫺10.5 21 14.5 1280 18 gl(100) 1.56° — — ⫺26.4 25 15 1260 12 gl(74), opx(3) cpx(22), sp(1) 1.1 ⫹1.0 0.08 ⫺2.8 24 15 1240 12.5 gl(77), opx(3) cpx(20) 1.6 — 1.55 ⫺11.8 26 17.5 1240 16 gl(54), opx(5) cpx(41) 2.3 — 2.42 ⫺13.6 28 18 1290 12 gl(100) 0.87° — — ⫺21.0
‡Phase proportions calculated by mass balance.
° H2O concentration by ion microprobe; other H2O concentration data are estimated with the by difference method.
▪⌬NNO ⫽ logfO
2- logfO2of the NNO buffer calculated at P and T (Chou, 1987). Experimental fO2calculated from olivine-spinel equilibria
(Ballhaus et al., 1991). For olivine-free but spinel-bearing charges, experimental fO2calculated from spinel-liquid equilibria (Maurel and Maurel,
1982; Danyushevsky and Sobolev, 1996; Kress and Carmichael, 1991). See also text. * Sum of residuals for the mass balance calculations.
§⌬FeO is apparent loss or gain of FeO calculated as (wt%) 100* (FeO
calc–FeOstarting glass)/FeOstarting glass. For crystal-bearing charges, FeOcalcis
concentration of FeO (total Fe as FeO) in the charge calculated by mass balance. For crystal-free charges, FeOcalcis concentration of FeO (total Fe
as FeO) in the glass measured by electron microprobe.
imental and standard glasses were taken into account in the calibration. The error on the estimation of H2O content with our “by-difference”
method is 25% relative for glasses with ⬃ 4 to 5 wt.% H2O, increasing
up to 100% relative for glasses with ⱕ 1 wt.% H2O.
4. RESULTS
A total of 32 high-pressure near-liquidus experiments were performed, 20 with the nominally dry starting glass and 12 with the hydrous starting glass, in the range 1160 to 1290°C and 7.5 to 20 kbar. Experimental conditions and results are summarized in Tables 2 and 3. Most experiments approached their final (target) temperature from below but 2 experiments were two-stage runs in which the charge was initially kept above the liquidus for 2 h before being isobarically cooled to their final (target) temperature.
4.1. Control of the Melt H2O Content
In this study, no attempt was made to buffer the H2O
concentration of experimental melts. Rather, the H2O
concen-tration of the melt in each series was controlled by the com-position of the starting glasses (H2O content and Fe
3⫹
/Fe2⫹
) and by the intrinsic properties of the talc-bearing high-pressure assemblies which promoted a H-rich environment around the capsules. Experiments performed with the nominally dry start-ing product have glass H2O concentrations ranging between 0.9
and 2.3 wt.% (Table 2), 1.4 ⫾ 0.4 wt.% on average. Glasses from experiments performed with the hydrous starting material have H2O concentrations ranging between 3.3 and 5.8 wt.%
(Table 3), 4.4 ⫾ 0.9 wt.% on average. In the following, exper-iments performed with the nominally dry starting glass will be designated as the 1.5 wt.% H2O experiments and those with the
hydrous starting glass as the 4.5 wt.% H2O experiments. The
dispersion of H2O concentrations between charges is,
respec-tively, 29 and 20% relative for the 1.5 wt.% and 4.5 wt.% H2O
series of experiments. Several factors contribute to this disper-sion, including variations in the proportion of crystals from one charge to the other and, to a lesser extent, differences in Fe loss among charges (see below). Part of the dispersion in H2O
concentrations is also analytical. The sensitivity of the “by-difference” method is poor for concentrations ⬍ 2 wt.% H2O.
For the 4.5 wt.% H2O series of experiments, the ion microprobe
data and the “by-difference” estimates are within 0.14 wt.% H2O from each other on average (9 charges), but the deviation
increases up to 0.65 wt.% H2O for the 1.5 wt.% H2O series of
experiments (7 charges).
The data on H2O content imply that all charges gained some
H2O during the experiments. As noted above, the first series of
experiments (Table 2) was performed from an almost dry starting material (Table 1). Yet, glasses from this series have average H2O concentrations of 1.4 wt.%, indicating an average
gain of 1.3 wt.% H2O. This is very close to the average gain of
H2O which can be calculated for the 4.5 wt.% H2O series of
glasses (i.e., ⬃ 1.5 wt.%), suggesting that the mechanism responsible for capsules gaining H2O is the same whatever the
glass starting material used (Table 1). Gain of H2O in
piston-cylinder experiments is commonly explained by the oxidation of hydrogen diffusing through the capsule walls, in relation to the reduction of an oxidized component of the charge such as Fe2O3(e.g., Eggler et al., 1974; Brooker et al., 1998). The use
of strongly oxidized glass starting materials in combination with talc-bearing assemblies as in this study would promote such a mechanism. However, calculations of the amount of H2O generated (assuming an initial glass Fe
3⫹
/Fe2⫹
ratio as in Table 1 and a final glass Fe3⫹
/Fe2⫹
ratio of 0.4, as determined below) yields a maximum of 0.62 wt.% H2O, i.e., substantially
less than the monitored increase in H2O concentration (1.3 to
1.5 wt.%), which underlines the need for an additional H2O
supply mechanism. Although reduction of Fe3⫹
and Fe2⫹
to
Table 3. Conditions and Results for Experiments with the Hydrous Starting Glass.
Run# P (kbar) T (°C) Duration (hour) Results H2O glass (wt%) ⌬NNO▪ ⌺r2* ⌬FeO§ (%) 13 9.5 1180 16.25 gl(98)‡, ol(2), sp(tr) 3.71° ⫹2.5 0.66 ⫺7.5 16 10 1160 17.5 gl(96), ol(3), sp(1) 4.80° ⫹2.4 0.52 ⫺5.2 6 12.5 1200 17.5 gl(100) 3.51° — — ⫺2.0 9 15 1200 23 gl(100) 4.64° — — ⫺8.9 12 14.5 1180 19 gl(97), ol(2), sp(1) 4.95° ⫹1.9 0.37 ⫺5.0 11 15 1160 18 gl(70), opx(5) cpx(23), sp(2) 5.8 ⫹2.8 0.15 ⫺3.5 26 15 1220 2 gl(100) 4.77° — — ⫺17.1 31180 318 17 17.5 1180 12 gl(75), opx(5) cpx(20) 5.3 — 2.59 ⫺17.2 19 17.5 1200 12 gl(75), opx(4) cpx(20), sp(1) 5.2 ⫹1.9 0.38 ⫺5.0 7 19 1250 10.5 gl(100) 3.28° — — ⫺5.5 18 20 1220 12 gl(100) 3.23° — — ⫺5.7 8 19 1200 19.25 gl(98), opx(1) cpx(1) 3.76° — 2.56 ⫺16.6
‡Phase proportions calculated by mass balance.
° H2O concentration by ion microprobe; other H2O concentration data are estimated with the by difference method.
▪⌬NNO ⫽ logfO
2- logfO2of the NNO buffer calculated at P and T (Chou, 1987). Experimental fO2calculated from olivine-spinel equilibria
(Ballhaus et al., 1991). For olivine-free but spinel-bearing charges, experimental fO2calculated from spinel-liquid equilibria (Maurel and Maurel,
1982; Danyushevsky and Sobolev, 1996; Kress and Carmichael, 1991). See also text. * Sum of residuals for the mass balance calculations.
§⌬FeO is apparent loss or gain of FeO calculated as (wt%) 100* (FeO
calc–FeOstarting glass)/FeOstarting glass. For crystal-bearing charges, FeOcalcis
concentration of FeO (total Fe as FeO) in the charge calculated by mass balance. For crystal-free charges, FeOcalcis concentration of FeO (total Fe
as FeO) in the glass measured by electron microprobe.
metallic Fe by alloying with the Au70Pd30capsule could
gen-erate more H2O, no correlation exists between the H2O
con-centration and the relative Fe loss (Tables 2, 3). Therefore, direct infiltration of H2O from the high-pressure assembly to
the charge across the Au70Pd30capsule is thought to be the
main additional H2O supply mechanism. Recent studies have
documented the possibility of O and H2O migration through
noble metal capsules at high temperatures in piston-cylinder studies (Patin˜o-Douce and Beard, 1994; Tuckenbrodt et al., 1997). Therefore, it is likely that not only H2, but also H2O,
were supplied to the charge by the talc-bearing high-pressure cells used in this study.
4.2. Control of fO2
No attempt was made to buffer the fO2of the experimental
charges by using, for example, double capsules with conven-tional oxygen buffers. This is because at high temperatures these buffers cannot last for sufficiently long durations if the fH2imposed by the high-pressure cell is in strong contrast to
that of the buffer (e.g., Scaillet et al., 1992). Rather, the fO2in
this study was controlled by the initial Fe3⫹
/Fe2⫹
ratios of the starting glasses and by the fH2 (and fH2O) imposed by the
high-pressure cells. For charges crystallizing olivine and spinel at equilibrium, experimental fO2was calculated from the
for-mulation of Ballhaus et al. (1991). For charges lacking olivine but crystallizing spinel, experimental fO2were calculated from
melt Fe3⫹
/Fe2⫹
ratios (Kress and Carmichael, 1991), assuming that the melt iron redox equilibrium is not affected by the presence of H2O (Carmichael, 1991). Melt Fe
3⫹
/Fe2⫹
ratios were obtained from the composition of Cr-Al spinels crystal-lizing in experimental products (Maurel and Maurel, 1982; Danyuschevsky and Sobolev, 1996). Because the data of Mau-rel and MauMau-rel (1982) are for dry basaltic melts at 1 atm, the effects of H2O and pressure on Fe
3⫹
/Fe2⫹
partitioning between spinel and melt are unknown and have been assumed to be negligible (see Danyuschevsky and Sobolev, 1996). ⌬NNO (difference in log fO2 from that of the nickel-nickel oxide
buffer, NNO) values obtained from Ballhaus et al. (1991) are higher by 0.2 log units on average than those calculated with the spinel-melt method on the same charges. As an additional check, the spinel-melt method was tested on the hydrous lher-zolite partial melting experiments of Hirose and Kawamoto (1995) and yielded fO2lower by 0.2 log unit on average than
the calculations of those authors. Thus, the spinel-melt is a reliable method of calculation of fO2 for our olivine-free
charges.
All fO2data in Tables 2 and 3 are referenced to the NNO
buffer calculated at the P and T of the experiment (Chou, 1987). The ⌬NNO values range between ⫹ 0.6 to ⫹ 2.6 (⫹ 1.4 ⫾ 0.6 on average, Table 2) in the 1.5 wt.% H2O series of
experiments and between ⫹ 1.9 to ⫹ 2.8 (⫹ 2.3 ⫾ 0.4 on average, Table 3) in the 4.5 wt.% H2O series of experiments.
Therefore, all experiments from this study were equilibrated under relatively oxidizing conditions, although, on average, the 4.5 wt.% H2O experiments are more oxidized than the 1.5 wt.%
H2O (Fig. 4).
Melt Fe3⫹
/Fe2⫹
ratios were obtained directly from spinel composition (Maurel and Maurel, 1982; Danyuschevsky and Sobolev, 1996) or indirectly, from fO2 data, by using the
empirical expression of Kress and Carmichael (1991). The Fe3⫹
/Fe2⫹
derived by this method are of ⬃ 0.4 and ⬃ 0.5, respectively, for the 1.5 and 4.5 wt.% H2O series of
experi-ments. For charges lacking spinel and whose fO2is unknown,
melt Fe3⫹
/Fe2⫹
ratios were calculated from Kress and Car-michael (1991), taking the average fO2 for each series of
experiments. By comparison with the Fe3⫹
/Fe2⫹
ratio of the starting glass (4.88, Table 1), the Fe3⫹
/Fe2⫹
ratios thus ob-tained indicate that reduction of Fe3⫹
occurred during the experiments. However, it is important to point out that a sub-stantial fraction of iron exists as Fe3⫹
in basaltic melts from this study. Melt FeO (and not FeOt) concentrations are used
below to calculate the Fe-Mg mineral-melt partition coeffi-cients.
4.3. Evaluation of Fe Loss
The importance of Fe-loss was evaluated for charges above the liquidus from glass compositions and for charges below the liquidus from mass-balance calculations (Tables 2, 3). Fe-loss is mostly a function of temperature. Below 1200°C, Fe-loss is of a few % (relative of the total FeO present), except for three runs (#26, 17 and 8, Table 3). Above 1250°C, Fe-loss may be more severe, although exceptions exist (#25, Table 2, #7, Table 3). Seventeen runs out of the 32 reported experienced Fe losses ⱕ 10% relative, 4 (all from the 1.5 wt.% H2O
experi-ments) had ⬎ 20% loss (Table 2) and none had more than 28% loss. These results show that Fe-loss has been minimized in this study. They confirm the relatively good performances of Au70Pd30 capsules with respect to Fe-loss under oxidizing
conditions (Kawamoto and Hirose, 1994), at least below 1200°C. However, Fe-loss has not been totally suppressed.
4.4. Approach to Equilibrium and Quench Crystallization
In this study, we have avoided the use of crystalline starting materials because melting experiments involve notoriously sluggish reactions and, as a rule, are more difficult to equili-brate than crystallization experiments (e.g., Green, 1976; Gust
Fig. 4. H2O content of experimental glasses from this study plotted
as a function of fO2, expressed as deviation from the NNO buffer
(⌬NNO). (■): experiments performed with the dry starting glass (Table 2); (䊐): experiments performed with the hydrous starting glass (Table 3).
and Perfit, 1987; Bartels et al., 1991; Draper and Johnston, 1992; Scaillet et al., 1995; Scaillet and Evans, 1999; Martel et al., 1999). Attainment of equilibrium cannot be documented from reversals, therefore, because all experiments from this study are of crystallization type. Nevertheless, several lines of evidence can be used to evaluate the approach to equilibrium. These are the following:
1. Experimental durations (16 h on average) were relatively long compared to other studies of this type (Tatsumi, 1982; Tatsumi et al., 1983; Gust and Perfit, 1987; Kushiro, 1987; Baker et al., 1994; Tatsumi et al., 1994). Bartels et al. (1991) found that 6 h were sufficient to obtain reproducible phase assemblages and proportions in near-liquidus anhydrous experiments on a partially crystalline high alumina basalt at 1280°C, 12 kbar. Because reaction kinetics are likely to be faster in presence of H2O, experimental durations in this
study were such that equilibrium should have been closely approached.
2. To test the reactivity of our glass starting materials and check for reproducibility, 2 two-stage runs (one for each series of melt H2O concentrations) were performed.
Exper-iments were first kept at superliquidus conditions for 2 h. Temperatures were then dropped isobarically and main-tained for 18 h (Tables 2, 3). Results from these two-stage runs agreed with those from the other experiments within uncertainties (Fig. 5), which supports the conclusion that our results are reproducible and independent of how experimen-tal temperatures are approached.
3. In a given charge, mineral phases and glass have homoge-neous compositions. This is best documented by examining the standard deviations of the electron microprobe analyses (Tables 4, 5), which are in the same range as the analytical dispersion. The only exception is spinel which is slightly heterogeneous in some of the 1.5 wt.% H2O charges, as
revealed by standard deviations ⬎ 1 wt.% for Cr2O3, Al2O3
and FeOtot(Table 4).
4. Mineral-melt Kd calculated from the experimental data are in agreement with results from the literature under compa-rable P-T conditions (see below for details) and suggest a close approach to chemical equilibrium.
5. Results of the mass-balance calculations are detailed on Tables 2 and 3. All charges but one (#10, Table 2) could be successfully mass-balanced. However, sums of residuals of the mass-balance calculations vary widely, from 0.01 to ⬎ 3 and strongly correlate with Fe loss (Tables 2, 3). Charges with Fe losses ⬍ 10% relative have ⌺R2 ⬍ 1 (0.31 on
average), which compares favourably with residuals from other studies (e.g., 0.02 to 0.13, Gaetani and Grove, 1998; 0.2, Falloon and Danyushevsky, 2000), and demonstrate that a constant bulk silicate composition was maintained. In contrast, those with Fe losses ⬎ 10% relative are character-ized by ⌺R2⬎ 1, thus indicating deviation from a constant
bulk silicate composition. Charge #10 has a calculated neg-ative proportion of opx (Table 2), suggesting that an equi-librium phase assemblage was not obtained. Because this charge is the only one containing the 4-phase assemblage ol ⫹ cpx ⫹ opx ⫹ sp, it has been kept in Table 2 but is neither plotted on, nor taken into account in the construction of, the phase diagram (Fig. 5).
6. The crystalline phases obtained in this study are euhedral and have homogeneous sizes, up to 100 m for olivine, in the 10 to 30 m range for orthopyroxene, 10 m for clinopyroxene and ⬍ 10 m for spinel. The presence of quench crystals is common in the 4.5 wt.% H2O series of
experiments. The proportion of materials crystallized during the quench is variable, but never important enough to pre-vent large glass pools being preserved for analysis. The ⌺R2
values (Table 3) indicate that the amount of quench crystals is never high enough to affect the mass-balance calculations. To summarize, we believe that the experimental data pre-sented here closely approach equilibrium phase assemblages and compositions. The main problem is the presence of some dispersion in bulk silicate composition (and H2O content, see
above) between charges. Nevertheless, it should be emphasized that this dispersion is never large enough to affect the phase equilibria. For example, results from run #35 (Fe loss of 20.4% relative) are consistent (see Fig. 5) with run #9 and #20 (both with relative Fe losses ⬍ 5%, Table 2).
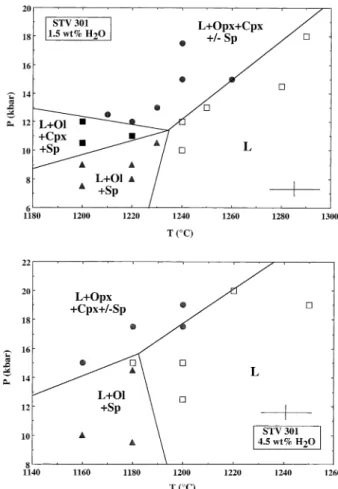
Fig. 5. Near-liquidus phase relations for STV301 with 1.5 wt.% H2O
(top) and 4.5 wt.% H2O in the melt (bottom). Symbols: (Œ) L ⫹ Ol ⫹
Sp; (F) L ⫹ Opx ⫹ Cpx ⫹/- Sp; (■) L ⫹ Ol ⫹ Cpx ⫹ Sp; (䊐) L (above liquidus). Abbreviations: Ol: olivine, Opx: orthopyroxene; Cpx: clinopyroxene; Sp: Cr-Al spinel; L: glass. The cross shown in both diagrams represents the experimental uncertainty. The slightly negative slope of the low pressure liquidus for the 4.5 wt.% H2O diagram is also
constrained by additional experiments at 4 kbar (Macdonald et al., 1998; in preparation) that have determined a liquidus temperature of 1200°C for STV301 with ⬃ 4.5 wt.% H2O in the melt.
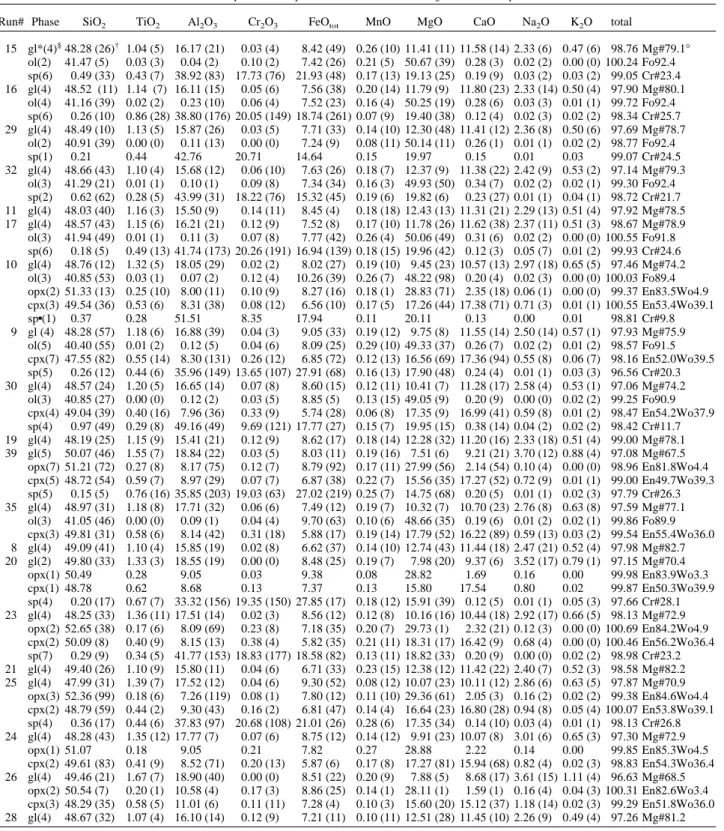
Table 4. Compositions of phases in the the 1.5 wt% H2O series of experiments.
Run# Phase SiO2 TiO2 Al2O3 Cr2O3 FeOtot MnO MgO CaO Na2O K2O total
15 gl*(4)§48.28 (26)† 1.04 (5) 16.17 (21) 0.03 (4) 8.42 (49) 0.26 (10) 11.41 (11) 11.58 (14) 2.33 (6) 0.47 (6) 98.76 Mg#79.1° ol(2) 41.47 (5) 0.03 (3) 0.04 (2) 0.10 (2) 7.42 (26) 0.21 (5) 50.67 (39) 0.28 (3) 0.02 (2) 0.00 (0) 100.24 Fo92.4 sp(6) 0.49 (33) 0.43 (7) 38.92 (83) 17.73 (76) 21.93 (48) 0.17 (13) 19.13 (25) 0.19 (9) 0.03 (2) 0.03 (2) 99.05 Cr#23.4 16 gl(4) 48.52 (11) 1.14 (7) 16.11 (15) 0.05 (6) 7.56 (38) 0.20 (14) 11.79 (9) 11.80 (23) 2.33 (14) 0.50 (4) 97.90 Mg#80.1 ol(4) 41.16 (39) 0.02 (2) 0.23 (10) 0.06 (4) 7.52 (23) 0.16 (4) 50.25 (19) 0.28 (6) 0.03 (3) 0.01 (1) 99.72 Fo92.4 sp(6) 0.26 (10) 0.86 (28) 38.80 (176) 20.05 (149) 18.74 (261) 0.07 (9) 19.40 (38) 0.12 (4) 0.02 (3) 0.02 (2) 98.34 Cr#25.7 29 gl(4) 48.49 (10) 1.13 (5) 15.87 (26) 0.03 (5) 7.71 (33) 0.14 (10) 12.30 (48) 11.41 (12) 2.36 (8) 0.50 (6) 97.69 Mg#78.7 ol(2) 40.91 (39) 0.00 (0) 0.11 (13) 0.00 (0) 7.24 (9) 0.08 (11) 50.14 (11) 0.26 (1) 0.01 (1) 0.02 (2) 98.77 Fo92.4 sp(1) 0.21 0.44 42.76 20.71 14.64 0.15 19.97 0.15 0.01 0.03 99.07 Cr#24.5 32 gl(4) 48.66 (43) 1.10 (4) 15.68 (12) 0.06 (10) 7.63 (26) 0.18 (7) 12.37 (9) 11.38 (22) 2.42 (9) 0.53 (2) 97.14 Mg#79.3 ol(3) 41.29 (21) 0.01 (1) 0.10 (1) 0.09 (8) 7.34 (34) 0.16 (3) 49.93 (50) 0.34 (7) 0.02 (2) 0.02 (1) 99.30 Fo92.4 sp(2) 0.62 (62) 0.28 (5) 43.99 (31) 18.22 (76) 15.32 (45) 0.19 (6) 19.82 (6) 0.23 (27) 0.01 (1) 0.04 (1) 98.72 Cr#21.7 11 gl(4) 48.03 (40) 1.16 (3) 15.50 (9) 0.14 (11) 8.45 (4) 0.18 (18) 12.43 (13) 11.31 (21) 2.29 (13) 0.51 (4) 97.92 Mg#78.5 17 gl(4) 48.57 (43) 1.15 (6) 16.21 (21) 0.12 (9) 7.52 (8) 0.17 (10) 11.78 (26) 11.62 (38) 2.37 (11) 0.51 (3) 98.67 Mg#78.9 ol(3) 41.94 (49) 0.01 (1) 0.11 (3) 0.07 (8) 7.77 (42) 0.26 (4) 50.06 (49) 0.31 (6) 0.02 (2) 0.00 (0) 100.55 Fo91.8 sp(6) 0.18 (5) 0.49 (13) 41.74 (173) 20.26 (191) 16.94 (139) 0.18 (15) 19.96 (42) 0.12 (3) 0.05 (7) 0.01 (2) 99.93 Cr#24.6 10 gl(4) 48.76 (12) 1.32 (5) 18.05 (29) 0.02 (2) 8.02 (27) 0.19 (10) 9.45 (23) 10.57 (13) 2.97 (18) 0.65 (5) 97.46 Mg#74.2 ol(3) 40.85 (53) 0.03 (1) 0.07 (2) 0.12 (4) 10.26 (39) 0.26 (7) 48.22 (98) 0.20 (4) 0.02 (3) 0.00 (0) 100.03 Fo89.4 opx(2) 51.33 (13) 0.25 (10) 8.00 (11) 0.10 (9) 8.27 (16) 0.18 (1) 28.83 (71) 2.35 (18) 0.06 (1) 0.00 (0) 99.37 En83.5Wo4.9 cpx(3) 49.54 (36) 0.53 (6) 8.31 (38) 0.08 (12) 6.56 (10) 0.17 (5) 17.26 (44) 17.38 (71) 0.71 (3) 0.01 (1) 100.55 En53.4Wo39.1 sp▪(1) 0.37 0.28 51.51 8.35 17.94 0.11 20.11 0.13 0.00 0.01 98.81 Cr#9.8 9 gl (4) 48.28 (57) 1.18 (6) 16.88 (39) 0.04 (3) 9.05 (33) 0.19 (12) 9.75 (8) 11.55 (14) 2.50 (14) 0.57 (1) 97.93 Mg#75.9 ol(5) 40.40 (55) 0.01 (2) 0.12 (5) 0.04 (6) 8.09 (25) 0.29 (10) 49.33 (37) 0.26 (7) 0.02 (2) 0.01 (2) 98.57 Fo91.5 cpx(7) 47.55 (82) 0.55 (14) 8.30 (131) 0.26 (12) 6.85 (72) 0.12 (13) 16.56 (69) 17.36 (94) 0.55 (8) 0.06 (7) 98.16 En52.0Wo39.5 sp(5) 0.26 (12) 0.44 (6) 35.96 (149) 13.65 (107) 27.91 (68) 0.16 (13) 17.90 (48) 0.24 (4) 0.01 (1) 0.03 (3) 96.56 Cr#20.3 30 gl(4) 48.57 (24) 1.20 (5) 16.65 (14) 0.07 (8) 8.60 (15) 0.12 (11) 10.41 (7) 11.28 (17) 2.58 (4) 0.53 (1) 97.06 Mg#74.2 ol(3) 40.85 (27) 0.00 (0) 0.12 (2) 0.03 (5) 8.85 (5) 0.13 (15) 49.05 (9) 0.20 (9) 0.00 (0) 0.02 (2) 99.25 Fo90.9 cpx(4) 49.04 (39) 0.40 (16) 7.96 (36) 0.33 (9) 5.74 (28) 0.06 (8) 17.35 (9) 16.99 (41) 0.59 (8) 0.01 (2) 98.47 En54.2Wo37.9 sp(4) 0.97 (49) 0.29 (8) 49.16 (49) 9.69 (121) 17.77 (27) 0.15 (7) 19.95 (15) 0.38 (14) 0.04 (2) 0.02 (2) 98.42 Cr#11.7 19 gl(4) 48.19 (25) 1.15 (9) 15.41 (21) 0.12 (9) 8.62 (17) 0.18 (14) 12.28 (32) 11.20 (16) 2.33 (18) 0.51 (4) 99.00 Mg#78.1 39 gl(5) 50.07 (46) 1.55 (7) 18.84 (22) 0.03 (5) 8.03 (11) 0.19 (16) 7.51 (6) 9.21 (21) 3.70 (12) 0.88 (4) 97.08 Mg#67.5 opx(7) 51.21 (72) 0.27 (8) 8.17 (75) 0.12 (7) 8.79 (92) 0.17 (11) 27.99 (56) 2.14 (54) 0.10 (4) 0.00 (0) 98.96 En81.8Wo4.4 cpx(5) 48.72 (54) 0.59 (7) 8.97 (29) 0.07 (7) 6.87 (38) 0.22 (7) 15.56 (35) 17.27 (52) 0.72 (9) 0.01 (1) 99.00 En49.7Wo39.3 sp(5) 0.15 (5) 0.76 (16) 35.85 (203) 19.03 (63) 27.02 (219) 0.25 (7) 14.75 (68) 0.20 (5) 0.01 (1) 0.02 (3) 97.79 Cr#26.3 35 gl(4) 48.97 (31) 1.18 (8) 17.71 (32) 0.06 (6) 7.49 (12) 0.19 (7) 10.32 (7) 10.70 (23) 2.76 (8) 0.63 (8) 97.59 Mg#77.1 ol(3) 41.05 (46) 0.00 (0) 0.09 (1) 0.04 (4) 9.70 (63) 0.10 (6) 48.66 (35) 0.19 (6) 0.01 (2) 0.02 (1) 99.86 Fo89.9 cpx(3) 49.81 (31) 0.58 (6) 8.14 (42) 0.31 (18) 5.88 (17) 0.19 (14) 17.79 (52) 16.22 (89) 0.59 (13) 0.03 (2) 99.54 En55.4Wo36.0 8 gl(4) 49.09 (41) 1.10 (4) 15.85 (19) 0.02 (8) 6.62 (37) 0.14 (10) 12.74 (43) 11.44 (18) 2.47 (21) 0.52 (4) 97.98 Mg#82.7 20 gl(2) 49.80 (33) 1.33 (3) 18.55 (19) 0.00 (0) 8.48 (25) 0.19 (7) 7.98 (20) 9.37 (6) 3.52 (17) 0.79 (1) 97.15 Mg#70.4 opx(1) 50.49 0.28 9.05 0.03 9.38 0.08 28.82 1.69 0.16 0.00 99.98 En83.9Wo3.3 cpx(1) 48.78 0.62 8.68 0.13 7.37 0.13 15.80 17.54 0.80 0.02 99.87 En50.3Wo39.9 sp(4) 0.20 (17) 0.67 (7) 33.32 (156) 19.35 (150) 27.85 (17) 0.18 (12) 15.91 (39) 0.12 (5) 0.01 (1) 0.05 (3) 97.66 Cr#28.1 23 gl(4) 48.25 (33) 1.36 (11) 17.51 (14) 0.02 (3) 8.56 (12) 0.12 (8) 10.16 (16) 10.44 (18) 2.92 (17) 0.66 (5) 98.13 Mg#72.9 opx(2) 52.65 (38) 0.17 (6) 8.09 (69) 0.23 (8) 7.18 (35) 0.20 (7) 29.73 (1) 2.32 (21) 0.12 (3) 0.00 (0) 100.69 En84.2Wo4.9 cpx(2) 50.09 (8) 0.40 (9) 8.15 (13) 0.38 (4) 5.82 (35) 0.21 (11) 18.31 (17) 16.42 (9) 0.68 (4) 0.00 (0) 100.46 En56.2Wo36.4 sp(7) 0.29 (9) 0.34 (5) 41.77 (153) 18.83 (177) 18.58 (82) 0.13 (11) 18.82 (33) 0.20 (9) 0.00 (0) 0.02 (2) 98.98 Cr#23.2 21 gl(4) 49.40 (26) 1.10 (9) 15.80 (11) 0.04 (6) 6.71 (33) 0.23 (15) 12.38 (12) 11.42 (22) 2.40 (7) 0.52 (3) 98.58 Mg#82.2 25 gl(4) 47.99 (31) 1.39 (7) 17.52 (12) 0.04 (6) 9.30 (52) 0.08 (12) 10.07 (23) 10.11 (12) 2.86 (6) 0.63 (5) 97.87 Mg#70.9 opx(3) 52.36 (99) 0.18 (6) 7.26 (119) 0.08 (1) 7.80 (12) 0.11 (10) 29.36 (61) 2.05 (3) 0.16 (2) 0.02 (2) 99.38 En84.6Wo4.4 cpx(2) 48.79 (59) 0.44 (2) 9.30 (43) 0.16 (2) 6.81 (47) 0.14 (4) 16.64 (23) 16.80 (28) 0.94 (8) 0.05 (4) 100.07 En53.8Wo39.1 sp(4) 0.36 (17) 0.44 (6) 37.83 (97) 20.68 (108) 21.01 (26) 0.28 (6) 17.35 (34) 0.14 (10) 0.03 (4) 0.01 (1) 98.13 Cr#26.8 24 gl(4) 48.28 (43) 1.35 (12) 17.77 (7) 0.07 (6) 8.75 (12) 0.14 (12) 9.91 (23) 10.07 (8) 3.01 (6) 0.65 (3) 97.30 Mg#72.9 opx(1) 51.07 0.18 9.05 0.21 7.82 0.27 28.88 2.22 0.14 0.00 99.85 En85.3Wo4.5 cpx(2) 49.61 (83) 0.41 (9) 8.52 (71) 0.20 (13) 5.87 (6) 0.17 (8) 17.27 (81) 15.94 (68) 0.82 (4) 0.02 (3) 98.83 En54.3Wo36.4 26 gl(4) 49.46 (21) 1.67 (7) 18.90 (40) 0.00 (0) 8.51 (22) 0.20 (9) 7.88 (5) 8.68 (17) 3.61 (15) 1.11 (4) 96.63 Mg#68.5 opx(2) 50.54 (7) 0.20 (1) 10.58 (4) 0.17 (3) 8.86 (25) 0.14 (1) 28.11 (1) 1.59 (1) 0.16 (4) 0.04 (3) 100.31 En82.6Wo3.4 cpx(3) 48.29 (35) 0.58 (5) 11.01 (6) 0.11 (11) 7.28 (4) 0.10 (3) 15.60 (20) 15.12 (37) 1.18 (14) 0.02 (3) 99.29 En51.8Wo36.0 28 gl(4) 48.67 (32) 1.07 (4) 16.10 (14) 0.12 (9) 7.21 (11) 0.10 (11) 12.51 (28) 11.45 (10) 2.26 (9) 0.49 (4) 97.26 Mg#81.2
* Glass analyses normalized to 100% anhydrous, with all Fe as FeO. Unnormalized total is reported.
§Number of microprobe analyses.
†One standard deviation in terms of least unit cited.
° Mg# calculated as molar MgO/(MgO⫹FeO). See text for calculations of FeO. Fo ⫽ at Mg/(Mg⫹Fe). Cr# ⫽ at. Cr/(Cr⫹Al). En ⫽ at. Mg/(Mg⫹Fe⫹Ca), Wo ⫽ at. Ca/(Mg⫹Fe⫹Ca) with Fe as Fe2⫹.
▪ Spinel population with heterogeneous Cr/(Cr⫹Al). Abbreviations as in Table 2.
4.5. Phase Equilibria
Tables 2 and 3 list phase assemblages and proportions of phases for the two series of experiments. Phase equilibria are represented on P-T diagrams (Fig. 5). These diagrams were constructed by taking into consideration all the experimental data points available for each series of melt H2O concentration
(except charge #10, see above). Liquidus phase assemblages are divided into three groups: (1) ol ⫹ sp, (2) ol ⫹ sp ⫹ cpx and (3) cpx ⫹ opx ⫾ sp. Plagioclase and garnet were not found. Spinel is present at the lowest pressures investigated (7.5 kbar, Table 2) but there is no sp ⫹ liquid field. Spinel is absent in a number of charges especially at high pressures (e.g., #24, 26 from the 1.5 wt.% H2O series of experiments, Table 2; #8, 17
from the 4.5 wt.% H2O experiments, Table 3). The 4-phase
ol ⫹ cpx ⫹ opx ⫹ sp assemblage has been found only in charge #10, which, however, is thought to be out of equilibrium (see above).
In both phase diagrams (Fig. 5), the ol ⫹ sp assemblage is located at low pressures and the cpx ⫹ opx ⫹/- sp assemblage at high pressures. The ol ⫹ cpx ⫹ sp field is found in an intermediate pressure domain and only in the 1.5 wt.% H2O
experiments. This assemblage was not detected in the 4.5 wt.% H2O experiments, probably because of the smaller number of
data points and larger spacing between experiments for this series of melt H2O concentrations. At low pressure, olivine and
spinel crystallize simultaneously below the liquidus where SEM observations show the presence of both isolated spinel crystals and spinel inclusions in olivine. At higher pressure, both cpx and opx (⫾ sp) appear together on the liquidus. Neither a cpx ⫹ liquid nor an opx ⫹ liquid field has been found. For both series of melt H2O concentrations, the
propor-tion of cpx crystallizing on or near the liquidus largely exceeds that of opx. In detail, the cpx:opx ratio is about ⬃ 8:1 (by weight) for the 1.5 wt.% H2O and ⬃ 4:1 for the 4.5 wt.% H2O
series of experiments, respectively. Thus, increasing the H2O
content of the melt (and varying the P-T-fO2conditions of the
liquidus accordingly) significantly changes the relative propor-tions of cpx and opx crystallizing on the liquidus.
For the 1.5 wt.% H2O phase diagram (Fig. 5), the high
pressure liquidus (above that where olivine is a liquidus phase) and field boundaries delimiting the ol ⫹ cpx ⫹ sp phase field are well constrained. The low pressure liquidus is less well constrained. On Figure 5, it has been drawn with a slightly positive slope, in agreement with previous studies under anhy-drous conditions (e.g., Gust and Perfit, 1987; Kushiro, 1987; Bartels et al., 1991; Draper and Johnston, 1992; Tatsumi et al., 1994). In contrast, the low pressure liquidus for the 4.5 wt.% H2O phase diagram is drawn with a slightly negative slope
(Fig. 5). This is because additional experiments (Macdonald et al., 1998; in preparation) constrain the liquidus temperature of
Table 5. Compositions of Phases in the 4.5 wt% H2O Series of Experiments.
Run# Phase SiO2 TiO2 Al2O3 Cr2O3 FeOtot MnO MgO CaO Na2O K2O total
13 gl*(4)§ 47.89 (35)† 1.18 (4) 16.39 (6) 0.06 (2) 8.52 (29) 0.09 (7) 11.61 (22) 11.38 (14) 2.36 (4) 0.52 (5) 95.00 Mg#79.9° ol(3) 41.37 (45) 0.00 (0) 0.07 (2) 0.14 (16) 7.60 (20) 0.14 (12) 50.18 (24) 0.23 (4) 0.00 (0) 0.01 (2) 99.74 Fo92.2 sp(4) 0.30 (18) 0.53 (7) 35.97 (49) 18.34 (53) 24.82 (62) 0.08 (10) 16.41 (17) 0.18 (3) 0.02 (3) 0.01 (1) 96.67 Cr#25.5 16 gl(4) 47.95 (57) 1.16 (3) 16.53 (15) 0.07 (8) 8.47 (10) 0.20 (16) 10.92 (26) 11.79 (41) 2.40 (11) 0.51 (4) 94.58 Mg#78.6 ol(2) 41.76 (16) 0.00 (0) 0.03 (2) 0.04 (5) 7.40 (12) 0.23 (7) 50.14 (25) 0.21 (1) 0.01 (1) 0.00 (0) 99.82 Fo92.3 sp(5) 0.28 (20) 0.48 (4) 34.14 (74) 19.52 (10) 24.20 (20) 0.16 (8) 18.17 (60) 0.17 (11) 0.03 (3) 0.01 (1) 97.20 Cr#27.7 6 gl(4) 47.69 (75) 1.13 (3) 15.64 (6) 0.03 (3) 8.95 (53) 0.20 (2) 12.47 (26) 11.18 (22) 2.18 (11) 0.51 (5) 95.42 Mg#79.1 9 gl(4) 48.26 (20) 1.13 (7) 15.79 (16) 0.07 (8) 8.31 (17) 0.12 (5) 12.38 (5) 11.21 (29) 2.21 (6) 0.50 (3) 94.55 Mg#79.9 12 gl(4) 48.52 (22) 1.13 (6) 15.96 (13) 0.03 (3) 8.66 (24) 0.12 (6) 11.60 (22) 11.20 (25) 2.27 (2) 0.51 (6) 94.99 Mg#77.2 ol(4) 41.65 (21) 0.03 (3) 0.08 (3) 0.01 (2) 7.68 (19) 0.08 (2) 49.90 (37) 0.27 (3) 0.02 (3) 0.01 (2) 99.73 Fo92.1 sp(3) 0.43 (49) 0.30 (3) 40.69 (48) 17.19 (72) 19.95 (66) 0.11 (0) 19.19 (55) 0.13 (6) 0.03 (5) 0.00 (1) 98.02 Cr#22.1 11 gl(4) 48.81 (48) 1.44 (6) 18.02 (19) 0.01 (2) 9.23 (26) 0.23 (6) 9.50 (9) 9.70 (16) 2.89 (22) 0.82 (6) 92.83 Mg#74.6 opx(2) 51.69 (11) 0.18 (2) 6.76 (35) 0.19 (13) 7.68 (11) 0.22 (4) 30.25 (11) 1.35 (12) 0.09 (4) 0.00 (0) 98.41 En87.0Wo2.7 cpx(2) 48.35 (47) 0.53 (9) 7.97 (32) 0.27 (23) 6.39 (1) 0.22 (6) 15.75 (16) 18.75 (31) 0.68 (10) 0.01 (1) 98.92 En49.7Wo42.9 sp(5) 0.28 (24) 0.36 (6) 49.64 (85) 2.31 (64) 25.41 (39) 0.13 (13) 19.14 (36) 0.16 (7) 0.02 (2) 0.01 (2) 97.46 Cr#3.0 26 gl(5) 48.28 (41) 1.07 (7) 16.47 (24) 0.12 (7) 7.56 (30) 0.17 (7) 12.27 (15) 11.12 (25) 2.43 (6) 0.51 (5) 93.79 Mg#81.3 17 gl(4) 48.01 (26) 1.38 (5) 18.53 (41) 0.04 (7) 8.13 (26) 0.14 (10) 10.24 (7) 9.91 (16) 2.91 (6) 0.70 (2) 93.45 Mg#76.6 opx(1) 51.55 0.14 7.85 0.18 7.56 0.05 29.83 1.55 0.14 0.00 98.85 En86.3Wo3.3 cpx(1) 49.08 0.38 8.46 0.43 5.83 0.23 15.88 17.98 0.94 0.06 99.27 En50.9Wo41.5 19 gl(4) 48.06 (27) 1.39 (7) 17.76 (17) 0.07 (6) 9.20 (19) 0.21 (7) 10.32 (30) 9.92 (9) 2.39 (7) 0.67 (1) 93.59 Mg#73.2 opx(1) 52.04 0.12 8.26 0.00 7.99 0.28 29.84 1.66 0.01 0.01 100.21 En86.1Wo3.3 cpx(1) 48.74 0.49 8.96 0.31 6.74 0.19 15.59 17.87 0.80 0.00 99.69 En50.3Wo40.9 sp(1) 0.19 0.28 53.81 3.76 19.37 0.14 20.16 0.16 0.00 0.02 97.87 Cr#4.5 7 gl(4) 47.85 (15) 1.14 (6) 15.78 (11) 0.12 (7) 8.63 (28) 0.14 (10) 12.53 (14) 11.06 (19) 2.24 (12) 0.51 (4) 95.26 Mg#79.5 18 gl(4) 47.75 (23) 1.10 (8) 15.85 (13) 0.07 (7) 8.61 (29) 0.05 (7) 12.38 (20) 11.37 (26) 2.35 (3) 0.47 (2) 95.46 Mg#79.4 8 gl(4) 48.21 (55) 1.14 (7) 16.37 (14) 0.11 (9) 7.72 (8) 0.20 (8) 12.10 (23) 11.25 (13) 2.36 (8) 0.54 (3) 94.51 Mg#80.3 opx(2) 52.38 (86) 0.10 (4) 8.11 (77) 0.35 (3) 6.70 (35) 0.13 (11) 30.08 (3) 1.73 (8) 0.12 (3) 0.03 (1) 99.73 En86.2Wo3.3 cpx(2) 48.61 (18) 0.37 (1) 9.96 (43) 0.25 (16) 5.40 (13) 0.12 (4) 15.81 (16) 17.99 (26) 0.97 (7) 0.03 (3) 99.51 En50.9Wo42.0 * Glass analyses normalized to 100% anhydrous, with all Fe as FeO. Unnormalized total is reported.
§Number of microprobe analyses.
†One standard deviation in terms of least unit cited.
° Mg# calculated as molar MgO/(MgO⫹FeO). See text for calculations of FeO. Fo ⫽ at. Mg/(Mg⫹Fe). Cr# ⫽ at. Cr/(Cr⫹Al). En ⫽ at. Mg/(Mg⫹Fe⫹Ca), Wo ⫽ at. Ca/(Mg⫹Fe⫹Ca) with Fe as Fe2⫹.
STV301 in presence of ⬃ 4.5 wt.% H2O in the melt to be
1200°C at 4 kbar. In both diagrams, the intersection of the low and high pressure liquidus fields defines multiple saturation points where the study composition would be simultaneously saturated with an ol ⫹ cpx ⫹ opx ⫹ sp phase assemblage. These points are located at 1235 °C, 11.5 kbar and 1185 °C, 16 kbar for 1.5 and 4.5 wt.% H2O in the melt respectively, (Fig. 5).
In terms of phase equilibria, varying the melt H2O
concentra-tion mainly changes the P-T locaconcentra-tion of the multiple saturaconcentra-tion points.
4.6. Phase Compositions
Olivine compositions range between Fo92.4and Fo89.9in the
1.5 wt.% H2O series of experiments, and between Fo92.3and
Fo92.1in the 4.5 wt.% H2O series of experiments (Tables 4, 5).
The Fe/Mg olivine-melt partition coefficient (Fe/Mg)0l/(Fe/
Mg)glassis 0.32 ⫾ 0.03 for 1.5 wt.% H2O (calculated with glass
FeO concentrations), indistinguishable from that for 4.5 wt.% H2O (0.31 ⫾ 0.02). Values identical within error were found in
the recent literature for comparable compositions and P-T conditions (0.26 to 0.30, Hirose and Kawamoto, 1995; 0.34 ⫾ 0.01, Gaetani and Grove, 1998; 0.34 ⫾ 0.01, Falloon and Danyushevsky, 2000). The achievement of consistent Fe-Mg olivine-melt partition coefficient provides an a posteriori veri-fication of the fO2determinations since the Kd calculations use
melt FeO concentrations computed from experimental fO2(see
above).
Orthopyroxenes (Wo2.7 to 4.9En81.8 to 87Fs10.2 to 13.8) have
elevated Al2O3(6.8 to 10.6 wt.%), Al IV
(0.16 to 0.23 pfu, 6 O basis) and AlVI
(0.12 to 0.21 pfu). The TiO2contents are ⬍ 0.3
wt.%. Orthopyroxenes from the 4.5 wt.% H2O series of
exper-iments tend to be slightly richer in En, and poorer in Wo, Al2O3
and TiO2than those from the 1.5 wt.% H2O series of
experi-ments (Tables 4, 5). The Fe/Mg partition coefficient between orthopyroxene and melt is 0.34 ⫾ 0.04, in agreement with results from recent literature (0.32 ⫾ 0.02, Gaetani and Grove, 1998; 0.31 ⫾ 0.02, Falloon and Danyushevsky, 2000).
Clinopyroxenes (Wo36 to 42.9En49.7 to 56.2Fs7.1 to 12.2) are
Ca-rich with Wo contents increasing from the 1.5 to the 4.5 wt.% H2O experiments (Gaetani et al., 1993). They have high
Al2O3(8.0 to 11.0 wt.%), Al IV
(0.18 to 0.23 pfu, 6 O basis) and AlVI
(0.15 to 0.25 pfu). TiO2contents are ⬃ 0.5 wt.%. Na2O
concentrations (0.55 to 1.18 wt.%) increase with pressure (Ta-bles 4, 5). Clinopyroxenes from this study have a substantial proportion of Fe present as Fe3⫹
(Fe3⫹
/⌺Fe ⫽ 22% on average in the 1.5 wt.% H2O experiments, 30% in the 4.5 wt.% H2O
experiments; Fe3⫹
in cpx calculated from Lindsley, 1983). The Fe/Mg partition coefficient between clinopyroxene and melt, calculated with Fe in cpx ⫽ Fe2⫹
(i.e., as for orthopyroxene), is 0.45 ⫾ 0.07 for the 1.5 wt.% H2O and 0.49 ⫾ 0.05 for the
4.5 wt.% H2O experiments, respectively. These values are
higher than results from the literature (e.g., 0.35 ⫾ 0.05, Hirose and Kawamoto, 1995; 0.36 ⫾ 0.04, Kinzler, 1997; 0.33 ⫾ 0.02, Gaetani and Grove, 1998), although the data overlap in part. These high Fe-Mg clinopyroxene-melt partition coefficients are attributed to the oxidizing conditions of our experiments.
Spinels are Cr-Al spinels with Cr# (⫽Cr/(Cr ⫹ Al) ranging mostly between 20 and 28 and Mg# (calculated with Fe in sp ⫽ Fe2⫹
) between 63 and 81 (Tables 4, 5). In cpx-bearing
crystal-rich charges from the 4.5 wt.% H2O experiments (#11, 19),
spinel has very low Cr# (⬍5, Table 5). The Cr/(Cr⫹Al) of the spinel in charge #10 is heterogeneous (Table 4). Average Fe3⫹
/
⌺Fe of spinel is 48% for the less oxidized 1.5 wt.% H2O and
59% for the more oxidized 4.5 wt.% H2O experiments (Fe 3⫹
calculated by assuming 32 O and 24 cations in the formula unit). The Fe/Mg partition coefficient between spinel and melt is 0.98 ⫾ 0.14 (calculated with Fe ⫽ Fe2⫹
, both in spinel and melt) or 0.69 ⫾ 0.10 (calculated with Fe ⫽ ⌺Fe), the latter being in good agreement with values in the literature (0.54 ⫾ 0.06, Kinzler, 1997; 0.60 ⫾ 0.13, Gaetani and Grove, 1998).
The experimental glasses obtained in this study are all ba-saltic in composition and are characterized by a narrow range of SiO2 contents, from ⬃ 48 to 50 wt.%. With progressive
crystallization below the liquidus, glass SiO2, Al2O3, TiO2,
Na2O and K2O increase whereas CaO, MgO and CaO/Al2O3
decrease. FeOtincreases slightly and glass Mg# decrease from
82 to 68 as crystallization proceeds. The most evolved glasses (i.e., the less MgO-rich) have SiO2contents near 50 wt.% and
Al2O3near 19 wt.% (Table 4) at 7.5 wt.% MgO. In other words,
these glasses approach the composition of certain high-alumina basalts (Gust and Perfit, 1987; Draper and Johnson, 1992).
5. DISCUSSION
5.1. A Lherzolitic Mantle Source for the St. Vincent Arc Basalts
The experimental data presented in this paper demonstrate that STV301 is multiply-saturated on its liquidus with a lher-zolitic mantle phase assemblage for both 1.5 and 4.5 wt.% H2O
in the melt. The compositions of near-liquidus phases are comparable to upper mantle minerals. This evidence suggests that the studied basalt is a product of partial melting of a lherzolitic mantle.
One may question how robust this conclusion is or, in other words, to what extent it is dependent of the conditions of the experiments. In this study, no experiments were performed under anhydrous conditions which leads to the question whether STV301 would be multiply-saturated with a lherzolite assemblage in absence of H2O. Several high-MgO and picritic
basalts compositionally close to STV301 have been found to be multiply-saturated with a lherzolite phase assemblage under dry conditions (e.g., Kushiro, 1987; Tatsumi et al., 1994 and see above). However, there are examples of similar high-MgO basalts which are not multiply-saturated under the same con-ditions, essentially because orthopyroxene is not present on the liquidus (Gust and Perfit, 1987; Bartels et al., 1991; Falloon et al., 1999). Although the absence of orthopyroxene on the liquidus has been attributed to its sluggish growth kinetics (Gust and Perfit, 1987; Falloon et al., 1999), it could alterna-tively be the consequence of the anhydrous conditions in those experiments. In the present study, the proportion of orthopy-roxene (relative to clinopyorthopy-roxene) crystallizing on the liquidus was found to decrease with decreasing the H2O concentration
in the melt. This observation is consistent with the fact that lherzolite melting reactions between ⬃ 10 to 20 kbar consume a larger proportion of opx under hydrous than under anhydrous conditions (Gaetani and Grove, 1998; Falloon and Danyush-evsky, 2000). Therefore, experiments performed on anhydrous STV301 would be expected to have a modal proportion of opx
lower than in the 1.5 wt.% H2O series of experiments.
Orthopy-roxene is, thus, expected to be either present in very small amounts or absent on the anhydrous liquidus of STV301, a conclusion consistent with observations for other similar high-MgO basalt compositions experimentally studied under dry conditions (Gust and Perfit, 1987; Bartels et al., 1991; Falloon et al., 1999). We stress the point that the absence of opx on the anhydrous liquidus of high-MgO basalts does not necessarily preclude an origin by melting of a lherzolite source under hydrous conditions.
It might be also questioned whether STV301 would remain multiply-saturated with a lherzolite phase assemblage for H2O
concentrations ⬎ 4.5 wt.% in the melt, which is the maximum average melt H2O concentration investigated in this study.
Near-liquidus experiments by Nicholls and Ringwood (1973) have shown that the addition of water markedly increases the maximum pressure of olivine stability for olivine tholeiite compositions. The displacement of the multiple saturation point toward higher pressures, as observed in this study when in-creasing the melt H2O concentration from 1.5 to 4.5 wt.%, is
consistent with these results. Nicholls and Ringwood (1973) found olivine to be present on the liquidus of olivine tholeiite up to 27 kbar, 1090 °C for water-saturated conditions. Perido-tite melting experiments have demonstrated that basaltic melts with H2O concentrations between 7 and 12 wt.% can coexist
with spinel lherzolite phase assemblages at around 1100 °C (Hirose and Kawamoto, 1995; Gaetani and Grove, 1998). Therefore, although the pressure/temperature coordinates of individual phase volumes likely depend on the H2O content,
increasing the melt H2O concentration beyond 4.5 wt.% is not
expected to change the liquidus phase assemblage for STV301. This will remain true until amphibole appears on the liquidus, presumably for temperatures ⬍ 1100 °C (Nicholls and Ring-wood, 1973; Hirose and Kawamoto, 1995; Gaetani and Grove, 1998). Note that for a STV301 melt to be multiply saturated with a lherzolitic assemblage at temperatures ⱕ 1100°C, very high melt H2O concentrations would be needed (ⱖ⬃ 10 wt.%)
from the extrapolation of the multiple saturation P-T locus (Fig. 6). In the same way, previous studies have found that pres-sures ⱖ 20 kbar are necessary for garnet to crystallize on the liquidus of olivine tholeiite compositions (Nicholls and Ring-wood, 1973; Falloon et al., 1999). Although garnet has not been found in experiments from this study, it is expected that garnet replaces spinel on the STV301 liquidus above 20 kbar. Assum-ing a minimum pressure of 20 kbar for the crystallization of garnet in STV301, extrapolation of the multiple saturation P-T locus (Fig. 6) yields a minimum melt H2O concentration of ⬃
7 wt.% for STV301 to be multiply saturated with a garnet lherzolite. Therefore, very high H2O contents are needed for
arc basalts to be last-equilibrated with a garnet-bearing lherzo-lite source. To summarize, we consider that the conclusion that STV301 is a product of partial melting of a lherzolitic source is robust, and does not depend significantly of the experimental melt H2O concentrations imposed in this study.
5.2. H2O Content of Primitive Arc Basalts from St.
Vincent
The P-T conditions of multiple saturation for several high-MgO basalts are summarized on Figure 6. The data include
results for both dry and hydrous conditions (only two studies available, including the present one) and are for basalts with MgO concentrations ranging between 10 and 13 wt.%. The two multiple-saturation points from this study are in quite good agreement with the data of Tatsumi (1982), both for basalts very close to each other in MgO content (12.5 and 11.7 wt.% MgO, respectively). Interpolation and extrapolation of the available multiple saturation points defines a P-T-H2O locus
along which STV301 would be in equilibrium with a lherzolitic phase assemblage. By increasing the H2O concentration of the
melt, conditions of multiple saturation progressively evolve toward lower temperatures and higher pressures. The data lead to the suggestion that the first 1 wt.% of added H2O has quite
a dramatic effect on the temperature of the multiple saturation point (Fig. 6), but comparatively little effect on the pressure.
5.2.1. Constraints from phase equilibria
Knowledge of the P-T-H2O locus of Figure 6 permits
dis-cussion of the conditions of extraction of STV301 from its mantle source and to evaluate the H2O content of primary
melts. For a primary basalt such as STV301 to preserve its status as a primary magma, it is necessary that olivine crystal-lization is prevented or limited during magma ascent. Basaltic magma ascent in the subarc mantle is commonly viewed to occur via dykes and, consequently, is thought to involve little or no chemical reaction with wall-rocks, and is adiabatic (e.g., Tatsumi and Eggins, 1995). Basalt adiabats are shown on Figure 6, calculated with a constant slope of dT/dP ⫽ 1 °C/km (McKenzie and Bickle, 1988). Melt crystallization during as-cent will be controlled by the relative slopes of the adiabat and of the low pressure liquidus (ol ⫹ liquid ⫽ liquid). If the slope of the low pressure liquidus is flatter than the adiabat, the melt may ascend unmodified. Alternatively, if the low pressure liquidus has a negative slope, olivine crystallization will occur during ascent. The former situation is the one expected for anhydrous basaltic melts while the latter is typical of hydrous systems, either H2O-saturated or at equilibrium with a H2
O-rich fluid, which have liquidi with negative slopes (e.g., Ni-cholls and Ringwood, 1973; Yoder, 1976). It follows that a STV301 melt, if extracted from the mantle under anhydrous conditions, will have the ability to reach the surface unmodified and will thus preserve its primary geochemical characteristics. Conversely, if last-equilibrated with its mantle source under H2O-rich conditions, a STV301 melt will crystallize a
signifi-cant amount of ol during ascent and thus will not reach the surface unmodified. Therefore, phase equilibria considerations suggest extraction of STV301 from the mantle under relatively dry conditions. There should exist a maximum melt H2O
con-tent beyond which the respective positions of the liquidus and adiabat prevent STV301 to reach the surface unmodified. How-ever, for this maximum to be precisely defined, the slope of the low pressure liquidi would need to be better determined, both for 1.5 and 4.5 wt.% H2O and for higher melt H2O
concentra-tions. Therefore, although it is not presently possible to more precisely constrain the H2O content of STV301 from phase
equilibria considerations, the general conclusion from the above analysis is that high-MgO and picritic arc basalts erupted at the surface must have been extracted from the mantle under relatively dry conditions.
5.2.2. Evidence from glass inclusions
The direct analysis of water in glass inclusions trapped in phenocrysts has been a powerful way to constrain the H2O
concentration of primitive arc basalts. Glass inclusions in prim-itive arc magmas have average H2O concentrations between 1.5
and 2.0 wt.% (Sobolev and Chaussidon, 1996), although H2O
contents up to 6 to 7 wt.% have sometimes been found (Sisson and Layne, 1993; Roggensack et al., 1997). No glass inclusion data are available for the primitive St. Vincent basalts. There is, however, a large body of data available for products of the 1979 eruption (Devine and Sigurdsson, 1983; Bardintzeff, 1992; Toothill, 1999). Basaltic inclusions trapped in olivine have average H2O concentrations of ⬃3 wt.% (Macdonald et al.,
2000). These glass inclusions do not represent primitive liquids but rather correspond to derivative compositions (i.e., MgO ⱕ 3 to 4 wt.%). By taking 3 wt.% as the H2O content of the
derivative liquids and assuming that they represent products of 40% closed-system fractionation from parents such as STV301
(Sisson and Grove, 1993; Macdonald et al., 1998), a value of 1.8 wt.% H2O is obtained for the primitive liquids. For
com-parison, Devine (1995) and Devine and Sigurdsson (1995) have suggested that the H2O contents of relatively magnesian (close
to primary) basalts of Grenada were 1 to 2 wt.% and that the melts parental to the Kick’em Jenny basalts initially con-tained ⬃ 2 wt.% H2O. By using 2 wt.% as the H2O
concen-tration of primary STV301 melts, experimental data from this study suggest ⬃ 1230°C and ⬃ 13 kbar as the conditions of melt extraction from the mantle, corresponding to point B (Fig. 6). We conclude that the glass inclusion data provide evidence for relatively low melt H2O concentrations in the primary
mantle-derived magmas erupted at St. Vincent, consistent with the phase equilibria analysis above.
5.2.3. Other considerations
One interesting aspect of Figure 6 is the sensitivity of the temperature of multiple saturation on melt H2O content. This
Fig. 6. P-T conditions of multiple saturation for several high-MgO and picritic arc basalts with MgO concentrations between ⬃ 10 and 13 wt.%. Source of data, anhydrous conditions: Kushiro (1987), Bartels et al. (1991), Draper and Johnston (1992), Tatsumi et al. (1994); hydrous conditions: Tatsumi (1982) and this study. The heavy dashed curve yields the P-T-H2O in melt conditions of equilibrium of STV301 (12.5 wt.% MgO) with a spinel lherzolite source, constructed
from the data of Tatsumi (1982) and of this study. Numbers along the curve are H2O concentrations in the melt. A and B
are two different examples of P-T-H2O in melt conditions of last equilibration/extraction of the 12.5 wt.% MgO basalt with
its mantle source. Adiabatic ascent paths are calculated from these two points (see text). The low pressure liquidi for STV301 with 1.5 and 4.5 wt.% H2O in the melt (light dashed lines) are drawn for comparison with the adiabats. The two
geotherms, drawn schematically through points A and B, illustrate the relation between the H2O concentration of primary