AAV-mediated direct in vivo CRISPR screen
identifies functional suppressors in glioblastoma
The MIT Faculty has made this article openly available.
Please share
how this access benefits you. Your story matters.
Citation
Chow, Ryan D et al. “AAV-Mediated Direct in Vivo CRISPR Screen
Identifies Functional Suppressors in Glioblastoma.” Nature
Neuroscience 20, 10 (August 2017): 1329–1341 © 2017 Nature
America, Inc., part of Springer Nature
As Published
http://dx.doi.org/10.1038/NN.4620
Publisher
Nature Publishing Group
Version
Author's final manuscript
Citable link
http://hdl.handle.net/1721.1/116866
Terms of Use
Creative Commons Attribution-Noncommercial-Share Alike
AAV-mediated direct in vivo CRISPR screen identifies functional
suppressors in glioblastoma
Ryan D. Chow*,1,2,3, Christopher D. Guzman*,1,2,4,5,6, Guangchuan Wang*,1,2, Florian
Schmidt*,7,8, Mark W. Youngblood**,1,3,9, Lupeng Ye**,1,2, Youssef Errami1,2, Matthew B. Dong1,2,3, Michael A. Martinez1,2, Sensen Zhang1,2, Paul Renauer, Kaya Bilguvar1,10, Murat
Gunel1,3,9,10, Phillip A. Sharp11,12, Feng Zhang13,14, Randall J. Platt7,8,#, and Sidi
Chen1,2,3,4,5,6,15,16,#
1Department of Genetics, Yale University School of Medicine, 333 Cedar Street, SHM I-308, New
Haven, CT 06520, USA 2System Biology Institute, Yale University School of Medicine, 333 Cedar
Street, SHM I-308, New Haven, CT 06520, USA 3Medical Scientist Training Program, Yale
University School of Medicine, 333 Cedar Street, SHM I-308, New Haven, CT 06520, USA
4Biological and Biomedical Sciences Program, Yale University School of Medicine, 333 Cedar
Street, SHM I-308, New Haven, CT 06520, USA 5Immunobiology Program, Yale University School
of Medicine, 333 Cedar Street, SHM I-308, New Haven, CT 06520, USA 6Department of
Immunobiology, Yale University School of Medicine, 333 Cedar Street, SHM I-308, New Haven, CT 06520, USA 7Department of Biosystems Science and Engineering, ETH Zurich,
Mattenstrasse 26, 4058 Basel, Switzerland 8Department of Chemistry, University of Basel,
Petersplatz 1, 4003 Basel, Switzerland 9Department of Neurosurgery, Yale University School of
Medicine, 300 Cedar Street, New Haven, CT 06520-8043 10Yale Center for Genome Analysis,
Yale University School of Medicine, 300 Cedar Street, New Haven, CT 06520-8043 11Koch
Institute for Integrative Cancer Research, MIT, 77 Massachusetts Avenue, Cambridge, MA 02139-4307, USA 12Department of Biology, MIT, 77 Massachusetts Avenue, Cambridge, MA
02139-4307, USA 13Broad Institute of MIT and Harvard, 75 Ames Street, Cambridge, MA 02142,
USA 14Department of Biological Engineering, MIT, 75 Ames Street, Cambridge, MA 02142, USA 15Comprehensive Cancer Center, Yale University School of Medicine, Integrated Science &
Technology Center, 850 West Campus Drive, Room 361, West Haven, CT 06516, USA 16Stem
Users may view, print, copy, and download text and data-mine the content in such documents, for the purposes of academic research, subject always to the full Conditions of use: http://www.nature.com/authors/editorial_policies/license.html#terms
#Correspondence: RJP (rplatt@ethz.ch), SC (sidi.chen@yale.edu), +1-203-737-3825 (office), +1-203-737-4952 (lab).
*Co-first authors **Co-second authors
Contributions
S.C. and R.J.P. conceived, designed the study and performed the initial set of experiments. C.D.G., G.W., R.J.P. and S.C. performed the majority of animal work and histology. R.D.C. developed the algorithms and performed integrative analyses of all the data. G.W. performed exome-capture, mutant cell line generation, drug treatment and RNA-seq. F.S. performed AAV production. S.C. performed MRI. M.W.Y. contributed to data analysis. L.Y., Y.E., M.B.D., M.A.M., S.Z. and P.R. contributed to experiments including mouse breeding, genotyping, cloning, cell culture, virus prep, injection, necropsy and sample prep. K.B. assisted captured and exome sequencing. M.G. provided clinical insights. P.A.S., F.Z., R.J.P., and S.C. jointly supervised the work. R.D.C. and S.C. wrote the manuscript with inputs from all authors.
Competing Financial Interests
HHS Public Access
Author manuscript
Nat Neurosci
. Author manuscript; available in PMC 2018 February 14. Published in final edited form as:Nat Neurosci. 2017 October ; 20(10): 1329–1341. doi:10.1038/nn.4620.
A
uthor Man
uscr
ipt
A
uthor Man
uscr
ipt
A
uthor Man
uscr
ipt
A
uthor Man
uscr
ipt
Cell Center, Yale University School of Medicine, Integrated Science & Technology Center, 850 West Campus Drive, Room 361, West Haven, CT 06516, USA
Abstract
A causative understanding of genetic factors that regulate glioblastoma (GBM) pathogenesis is of central importance. Here, we developed an adeno-associated virus (AAV)-mediated autochthonous CRISPR screen in GBM. Stereotaxic delivery of an AAV library targeting genes commonly mutated in human cancers into the brains of conditional Cas9 mice resulted in tumors that recapitulate human GBM. Capture sequencing revealed diverse mutational profiles across tumors. The mutation frequencies in mice correlate with those in two independent patient cohorts. Co-mutation analysis identified co-occurring driver combinations such as Mll2, B2m-Nf1, Mll3-Nf1 and Zc3h13-Rb1, which were subsequently validated using AAV minipools. Distinct from Nf1-mutant tumors, Rb1-Nf1-mutant tumors are undifferentiated and aberrantly express Homeobox gene clusters. The addition of Zc3h13 or Pten mutations altered the gene expression profiles of Rb1 mutants, rendering them more resistant to temozolomide. Our study provides a functional landscape of gliomagenesis suppressors in vivo.
Introduction
Glioblastoma (Glioblastoma multiforme, GBM) is one of the deadliest cancers1. Current standard of care fails to cure the vast majority of patients with this disease1–3, leaving them a median survival of 12.2 to 18.2 months4–7. The first genome atlas of GBM uncovered 453 validated non-silent somatic mutations in 223 unique genes, which were further refined to a total of 71 significantly mutated genes (SMGs)8. Subsequent integrative genomic analyses revealed comprehensive mutational landscapes in GBM, uncovering 21 to 75 SMGs across multiple different cohorts of patients8–13. Many of the newly discovered genes have never been characterized in GBM; thus, their functional roles in gliomagenesis remain largely unknown9, 10. Further complicating the interpretation of causality, mutations can occur in novel combinations across individual patients, leading to drastically different pathological features, prognoses, and therapeutic responses3, 14–16. Thus, a deeper functional
understanding of gliomagenesis and a quantitative measurement of phenotypic effects across various combinations of drivers are both of central importance.
To date, no study has comprehensively and combinatorially investigated which of the mutations identified in human patients can indeed functionally drive GBM from normal cells in the brain9. Key barriers include accurate delivery, precise genome manipulation, efficient massively parallel perturbation, and unbiased, high-sensitivity quantitative readout, all of which have to be achieved simultaneously in the native brain microenvironment. We overcame these challenges through an AAV-mediated direct in vivo autochthonous CRISPR screen in the brain of fully immunocompetent mice, coupled with capture sequencing to achieve an ultra-deep readout of all functional variants. With these data, we identified multiple new drivers and co-occurring drivers, and subsequently validated a set of such combinations. Transcriptome profiling of these driver combinations revealed distinct
A
uthor Man
uscr
ipt
A
uthor Man
uscr
ipt
A
uthor Man
uscr
ipt
A
uthor Man
uscr
ipt
expression signatures between genotypes and in response to temozolomide (TMZ)
treatment. Utilizing this approach, we mapped the functional landscape of GBM suppressors in the native microenvironment of the mouse brain.
Results
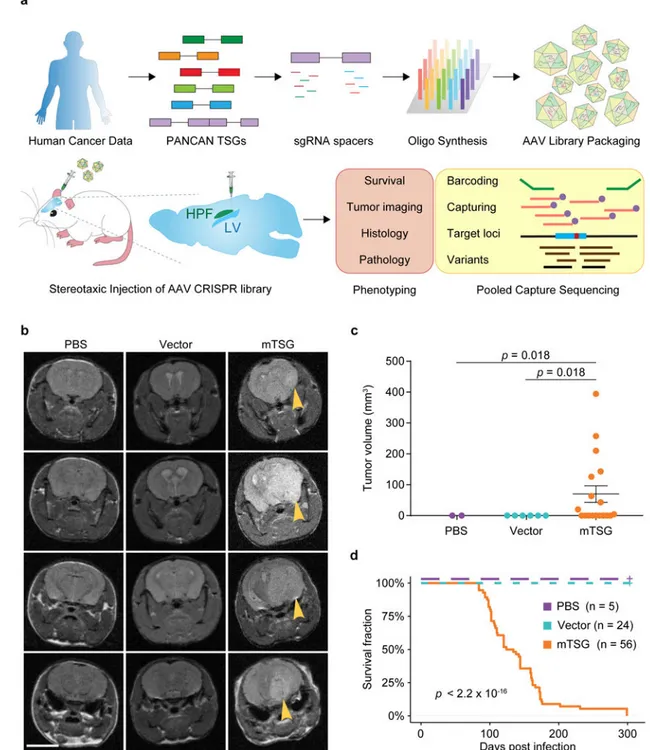
Stereotaxic injection of an AAV-CRISPR library drives robust gliomagenesis
To directly test the function of putative SMGs in the mouse brain, we set out to develop a direct in vivo autochthonous screening strategy, which necessitates pooled mutagenesis of normal cells directly in the native organ and subsequent deconvolution of mutant
phenotypes. Because GBM is a disease originating from astrocytes, we generated an AAV-CRISPR vector that encodes Cre recombinase under a Glial fibrillary acidic protein (GFAP) promoter, resulting in conditional expression of Cas9 and GFP in astrocytes when injected into a conditional Rosa26-LSL-Cas9-GFP mouse (LSL-Cas9 mouse) (Methods) (Figure S1a). The vector also contains an sgRNA targeting Trp53, with the initial intent to generate co-mutational Trp53 knockouts that might exhibit genome instability and thus be sensitized to tumorigenesis17–21. Local viral delivery into the brain restricts the number of transducible cells, and cancer genomes generally consist of dozens to hundreds of SMGs22–25. With these considerations in mind, we designed an sgRNA library (mTSG library) targeting the mouse homologs of top-ranked pan-cancer SMGs (Methods), plus 7 genes with essential molecular functions that we initially considered as internal controls (Figure 1a) (Table S1). We pool-synthesized all sgRNAs, cloned them into the AAV-CRISPR vector at greater than 100× coverage, and deep-sequenced the library to ensure all sgRNAs were fully covered and represented with a tight lognormal distribution (99% within two orders of magnitude) (Figure 1a, Figure S1b). We generated high-titer AAVs (> 1 * 1012 viral particles per mL) from the plasmid that contained the mTSG library (AAV-mTSG), as well as the empty vector (AAV-vector) (Figure 1a). We then stereotaxically injected AAV-mTSG, AAV-vector or PBS into the lateral ventricle (LV, n = 40 mice) or hippocampus (HPF, n = 16 mice) in the brains of LSL-Cas9 mice (Methods). We performed magnetic resonance imaging (MRI) to scan the brains of these mice at four-months post-injection, and found that half (9/18 = 50%) of AAV-mTSG library transduced animals developed brain tumors at this time point, whereas none of the AAV-vector or PBS injected animals had detectable tumors by MRI (Figure 1b) (Figure S1e) (Table S2). Quantification of tumor volumes showed that AAV-mTSG transduced mice had average tumor volumes of 70.2 mm3 (including animals without tumors), or 140.3 mm3 (excluding animals without a tumor) (two-tailed Welch’s t-test, t17 = 2.62, p = 0.018, mTSG vs. vector or PBS) (Figure 1c) (Table S2). These data suggested that the AAV-mTSG library robustly initiated tumorigenesis in the brains of LSL-Cas9 mice. We analyzed the overall survival of a cohort of LSL-Cas9 mice injected with AAV-mTSG, AAV-vector or PBS (Table S3). In this screen, injection location did not affect the rate of tumor development as reflected by overall survival (two-sided Mann-Whitney U test of HPF vs LV, p = 0.054) (Table S3), and thus were considered as one group (AAV-mTSG). For the AAV-mTSG transduced group, the first three animals died 84 days post injection (dpi), 90% of animals did not survive 176 dpi, and all 56 AAV-mTSG transduced animals reached their survival endpoints within 299 days (i.e. died, or had a poor body condition score BCS < 2,
A
uthor Man
uscr
ipt
A
uthor Man
uscr
ipt
A
uthor Man
uscr
ipt
A
uthor Man
uscr
ipt
and thus were euthanized) (Table S3) (Figure 1d). The median survival time of the AAV-mTSG group was 129 days (95% confidence interval (CI) = 111–159 days) (Figure 1d), consistent with the presence of tumors in half of the mice at 4 months by MRI. In contrast, all 24 AAV-vector and all 5 PBS injected animals survived the duration of the study and maintained good body condition (BCS = 5) (log-rank (LR) test, p < 2.2 * 10−16, mTSG vs. vector or PBS; LR test, p = 1, vector vs PBS) (Figure 1d). For the vast majority (96.4%, or 54/56) of AAV-mTSG injected mice, macrocephaly was observed at the survival endpoint (Figure S1c), suggesting that they had developed brain tumors. On the contrary,
macrocephaly was observed in none of the AAV-vector (0/24) or PBS (0/5) injected mice during the study (two-tailed Fischer’s exact test, p < 1 * 105, mTSG vs. vector or PBS; p = 1, vector vs. PBS). These data indicated that the brain tumors induced by the AAV-mTSG viral library were typically lethal.
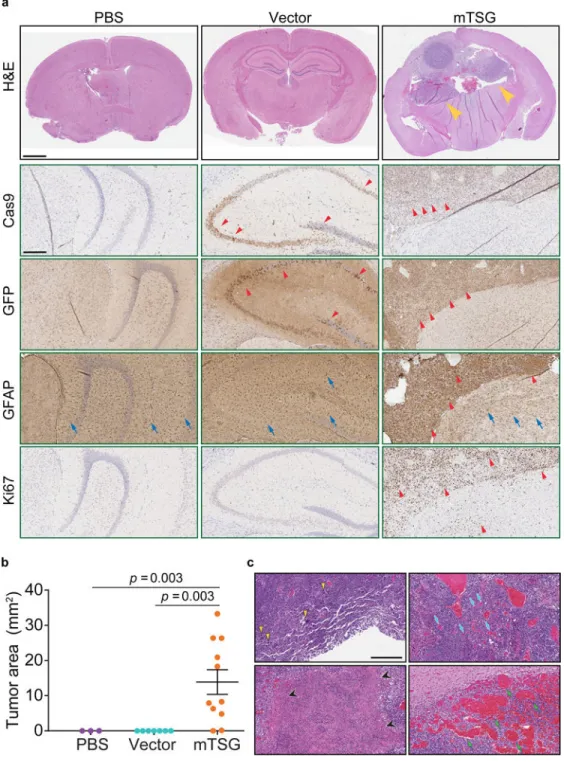
We observed that AAV-mTSG mice had GFP-positive masses that deformed their brains (100%, or 6/6) (Figure S1d, Figure 2a). AAV-vector mice had diffuse GFP-positive regions in the brain with fully normal morphology, suggesting these were AAV-transduced cells expressing Cas9-GFP induced by Cre expression that had not become tumors (n = 2) (Figure S1d, Figure 2a). PBS injected or uninjected mice had no detectable GFP expression even at long exposure (n = 3) (Figure S1d). Immunohistochemistry (IHC) analysis showed that AAV-mTSG induced tumors stained positive for Cas9 and GFP, consistent with them having arisen from cells with activation of Cas9-GFP expression (Figure 2a). These tumors were also positive for GFAP, an astrocytic marker (Figure 2a), and for Ki67, a proliferation marker (Figure 2a). AAV-vector transduced brains stained positive for Cas9 and GFP in a subset of cells at the injection site (Figure 2a), but these cells were not proliferative (Ki67 negative) and did not have tumor-like pathological features (Figure 2a). PBS-injected mice stained negative for Cas9, GFP and Ki67 (Figure 2a). Endpoint histopathology showed that the vast majority of AAV-mTSG mice developed brain tumors (10/11 = 91%), whereas none of AAV-vector (0/7 = 0%) or PBS (0/3 = 0%) mice had detectable tumors (two-tailed Fischer’s exact test: p = 0.0003, mTSG vs. vector; p = 0.011, mTSG vs. PBS) (Figure 2a–b) (Table S4). The mean endpoint tumor size as measured by area in brain sections for the AAV-mTSG group was 13.9 mm2, as compared to 0 mm2 in the two control groups (two-tailed Welch’s t-test, t10 = 3.97, p = 0.003, mTSG vs. vector or PBS) (Figure 2b). Brain tumors in AAV-mTSG mice showed pathological features of dense cellular structure with proliferative spindles, nuclear aneuploidy and pleiomorphism, giant cells, regions of necrosis, angiogenesis and hemorrhage (Figure 2c), all of which are hallmark features of human GBM2. Clinical features such as deformation of the brain, invasion, loss of neuronal bundles, necrosis and hemorrhage were further corroborated by special staining methods such as Luxol fast blue Cresyl violet (LFB/CV), Wright Giemsa, Masson and Alcian Blue Periodic acid – Schiff (AB/PAS) (Figure S2). We investigated a panel of human GBM clinical samples from Yale Glioma tissue bank, and confirmed the observation of these pathological features (Figure S3a–b). These data suggested that the AAV-mTSG library-induced autochthonous brain tumors recapitulate features of human GBM.
A
uthor Man
uscr
ipt
A
uthor Man
uscr
ipt
A
uthor Man
uscr
ipt
A
uthor Man
uscr
ipt
Targeted capture sequencing reveals diverse mutational profiles across tumors
Because AAVs usually do not integrate into the genome, direct sequencing of the targeted regions was needed to determine which mutations were in each tumor. To map the molecular landscape of these brain tumors, we designed a probe set (mTSG-Amplicon probes)
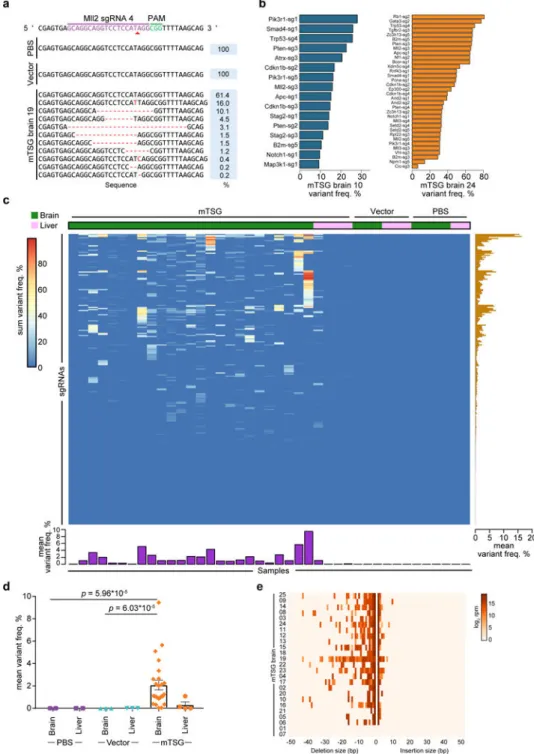
covering the target regions of all library sgRNAs (Methods) (Table S5). We used these probes to perform targeted capture sequencing for whole brain and liver samples (as a control organ not being directly transduced) in a cohort of AAV-mTSG, AAV-vector and PBS injected mice (n = 25, 3, and 4 brain samples, respectively) (Table S6). 277/278 (99.6%) of unique sgRNA target regions were captured for all samples from this experiment, the exception being Arid1a-sg5 (due to unavailability of qualified regions in capture probe design). Across all 41 brain and liver samples, the average of mean coverage across all probes was 19,405 ± 180 s.e.m. (Table S7). We analyzed the mutant variants at the predicted cutting sites of the 277 successfully captured unique sgRNAs across all samples (Methods) (Table S8). At the single sgRNA level, for example, at the predicted cutting site of sgRNA-4 in the Mll2 locus (also known as Kmt2d), various insertions and deletions (indels) were detected in AAV-mTSG but not AAV-vector or PBS mice (Figure 3a). As gliomagenesis takes multiple months in mice (Figure 1d), we surveyed 3 mice at 3.5 weeks post-injection and performed capture sequencing to reveal early mutation profiles, as an approximation for in vivo sgRNA cutting efficiency (Figure S4a–b, Table S9). We found that even lower-efficiency sgRNAs can end up being highly enriched in the process of tumorigenesis if the mutations they generated are strongly oncogenic (Figure S4c, Figure 3b–c). After removing germline variants, we determined whether the regions flanking each sgRNA target site would be classified as significantly mutated sgRNA sites (SMSs) (Methods) (Table S10). We implemented a false-discovery-rate (FDR) approach with (FDR < 1/12 PBS/vector samples, or 8%) as well as a flat 5% variant frequency cutoff, and confirmed that the choice of alternative cutoffs did not alter the final SMS calls (Figure S6a). With these criteria, we observed a diverse mutational landscape across most mice that were capture-sequenced (Figure 3b–c, Figure S5, Table S11). As an example, one AAV-mTSG mouse (mTSG brain 10) had significant mutations at the predicted cutting sites of 16 out of 277 captured gene-targeting sgRNAs in the mTSG library, covering 12 significantly mutated genes (mSMGs) (Figure 3b). A second example (mTSG brain 24) showed a more diverse mutational profile (34 SMSs for 26 mSMGs) (Figure 3b). The raw indel frequencies were also summed across all detected variants for each sgRNA target site in each sample, revealing a highly diverse pattern of variant frequencies generated by this sgRNA pool (Figure 3c) (Table S10). Comparing brain samples between treatment groups, AAV-mTSG injected brains had significantly higher mean variant frequencies (2.087 ± 0.429 s.e.m., n = 25) compared to vector (0.005 ± 0.001, n = 3) or PBS (0.003 ± 0.001, n = 4) injected brains (two-tailed Welch’s t-test, t24 = 4.85 and t24 = 4.86, p = 6.03 * 10−5 and p = 5.96 * 10−5 for mTSG vs. vector and mTSG vs. PBS, respectively) (Figure 3c–d). Comparing targeted vs. non-targeted organs in AAV-mTSG injected mice, the mean variant frequencies of brains (2.087 ± 0.429, n = 25) were significantly higher than livers (0.309 ± 0.261, n = 4) (two-tailed Welch’s t-test, t21.48 = 3.54, p = 0.002) (Figure 3c–d). The predominant indels were deletions for virtually all samples, and most insertions at SMS sites were 1 bp in size (Figure 3e) (Table S8). We identified distinct variant frequency clusters of sgRNA-induced indels that may serve as an approximation to the clonality of these tumors (Methods). From this analysis, we
A
uthor Man
uscr
ipt
A
uthor Man
uscr
ipt
A
uthor Man
uscr
ipt
A
uthor Man
uscr
ipt
found that only 2/22 of the brains had single-cluster tumors, with the majority (20/22) being comprised of multiple clusters (Figure S6b). These data demonstrate on-target, pooled genome editing in the brain at a library scale, stochastically generating loss-of-function mutations in native glial cells and priming them for selection during gliomagenesis.
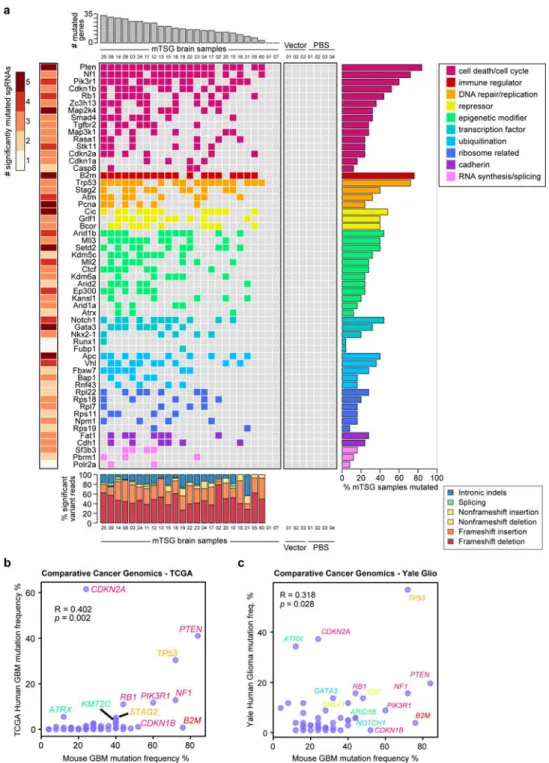
We next summarized the mutational data from the SMS level to the mSMG level (Table S12) and created an oncomap of all mTSG brain samples (Figure 4a). Across all mice with SMGs (23/25), the detected variants were predominantly frameshift indels (frameshift reads / total variant fraction >60% in 22/23 mice) compared to non-frameshift indels, splicing indels and intronic indels (Figure 4A, bottom panel). Surprisingly, all 56 genes have at least one associated SMSs, with eight of them (Pten, Map2k4, B2m, Pcna, Cic, Setd2, Gata3 and Apc) having 5/5 SMSs (Figure 4a left and middle panel). The SMGs encode functionally diverse categories of proteins, including cell death or cell cycle regulators, immunological
regulators, DNA repair and replication regulators, transcriptional repressors, epigenetic regulators, transcription factors, cadherin type proteins and ubiquitin ligases (Figure 4a). Many of the genes were significantly mutated in 20% to 50% of mice, with most of the epigenetic regulators in this range, such as Arid1b, Mll3, Setd2, Mll2, Kdm5c, Kdm6a, Arid2 and Ctcf (Figure 4a), highlighting the role of epigenetic regulators in brain
tumorigenesis. Interestingly, B2m, a core component of major histocompatibility complex (MHC) class I that is essential for antigen presentation, appeared as the second most frequently mutated gene (19/25 = 76% of mice) (Figure 4a, right panel). This analysis revealed, in a quantitative manner, the relative phenotypic strength of specific loss-of-function mutations in driving gliomagenesis in vivo.
We compared the mutational frequencies in mice to the variant frequencies of their homologous genes in human GBM with their frequencies of non-silent mutation and deletion. For these 56 genes, the mutation frequencies in mouse GBMs (an end-product of pooled mutagenesis and in vivo gliomagenesis) significantly correlated with the mutation frequencies in TCGA GBM patients (Pearson correlation R = 0.402, p = 2.1 * 10−3) (Figure 4b) (Table S13). To further investigate this correlation, we utilized the clinical cancer genomics data from the Yale Glioma tissue bank, a source independent from TCGA (Tables S14, S15). Collectively, the mouse mutation frequencies again significantly correlated with those in human patients (R = 0.318, p = 0.0277) (Figure 4c) (Table S16). These data suggest that the AAV-CRISPR autochthonous GBM mouse model revealed a quantitative phenotypic profile of tumor suppressors reflecting the genomic landscape of human GBM patients. Co-mutation analysis identifies frequently co-occurring driver combinations
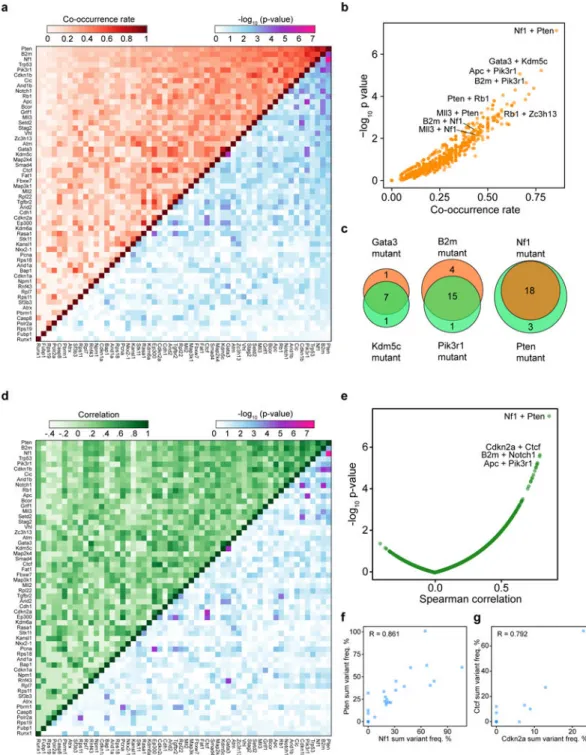
To generate an unbiased map of co-drivers, we calculated the co-occurrence rate of double-mutations for each gene pair (Methods) (Figure 5a–b, Table S17). This analysis showed that 76 gene pairs out of a total of 1540 possible pairs were statistically significant in terms of co-occurrence (hypergeometric test, FDR adjusted q < 0.05). The Nf1+Pten pair emerged as the top pair (co-occurrence rate = 18/21 = 85.7%, hypergeometric test, p = 7.53 * 10−8) (Figure 5a–c). Interestingly, several previously undocumented combinations emerged, such as Kdm5c+Gata3 (co-occurrence rate = 77.8%, hypergeometric test, p = 6.04 * 10−6), and B2m+Pik3r1 (70.0%, p = 2.28 * 10−5) (Figure 5a–c). In addition, we performed correlation
A
uthor Man
uscr
ipt
A
uthor Man
uscr
ipt
A
uthor Man
uscr
ipt
A
uthor Man
uscr
ipt
analysis of summed mutant frequencies for each pair of genes across all mice (Methods) (Figure 5d–e, Table S18). 22.9% (352/1540) of the gene pairs were positively correlated (Spearman correlation > 0, FDR adjusted q < 0.05) (Figure 5d–e). The most significantly correlated gene pair was again Nf1+Pten (Spearman correlation = 0.861, p = 3.34 * 10−8) (Figure 5d–f, Table S18), along with other representative pairs such as Cdkn2a+Ctcf (correlation = 0.792, p = 2.41 * 10−6) (Figure 5g), B2m+Notch1 (correlation = 0.789, p = 2.82 * 10−6), and Apc+Pik3r1 (correlation = 0.774, p = 5.77 * 10−6) (Figure 5d–e).
Exclusion of Trp53 revealed largely identical results for the remaining genes (Figure S7a-b). Of note, a subset of the significantly co-occurring pairs were also found to be co-mutated in human GBM, including the pairs of RB1+TP53, PTEN+RB1, RASA1+STK11, B2M +MAP2K4, PTEN+STAG2, CDKN1B+TP53 and CDKN1B+NF1 (Figure S7C–D). These data revealed co-occurrence and correlation relationships of specific mutations during glioblastoma progression in vivo.
Minipool validation of individual drivers and combinations
We went on to test several of the highly represented individual drivers or combinations using an sgRNA minipool validation approach (Methods) (Figure 6a). All of the un-injected (n = 2), EYFP (n = 4) and empty vector (n = 3) injected mice survived and maintained good body condition for the whole duration of the study. Control mice sacrificed from 4 to 11 months after treatment were devoid of any observable tumors by histology analysis (Figure 6b, Figure S8, Table S19), again indicating that without mutagenesis, or with Trp53 disruption alone, LSL-Cas9 mice did not develop brain tumors. In contrast, within 11 months post injection, 50% (4/8) of mice receiving AAVs containing Nf1 sgRNA minipool developed macrocephaly, poor body condition score and tumors (compared to all 9 control mice, two-tailed Fisher’s exact test, p = 0.029). All mice receiving Nf1;Pten (9/9, 100%, p = 4.11 * 10−5) and Nf1;B2m minipools (4/4, 100%, p = 0.0014) developed macrocephaly, poor body condition score and large tumors (Figure 6c, Table S19). Notably, mice receiving Nf1;B2m minipools had significantly worse survival than mice receiving Nf1 minipools alone (p = 0.0067) (Figure S9a), implying that loss of antigen presentation in cancer cells likely accelerates GBM progression in immunocompetent mice. All mice receiving Rb1, Rb1;Pten, or Rb1;Zc3h13 minipools (3/3, 100%, p = 0.0045 for all three groups) developed
macrocephaly, poor body condition score and large tumors (Figure 6D, Table S19). For the same duration of study (maximum 11 months), smaller fractions of mice receiving the AAV sgRNA minipools targeting Arid1b;Nf1 (4/9), Mll3;Nf1 (2/5), Mll2 (2/10), Cic (1/5), Cic;Pten (1/4), Setd2 (1/5), and Gata3;Mll3 (1/5) developed tumors (Table S19).
Collectively, half (40/80, or 50%) of the mice receiving AAV sgRNA minipools targeting any of the single genes or gene pairs developed brain tumors within 11 months (collective validation vs. all controls, two-tailed Fisher’s exact test, p = 0.004). These data indicated that mutating these individual genes or combinations in combination with Trp53 causes GBM in fully immunocompetent animals.
Interestingly, brain tumors with Nf1 mutations displayed highly polymorphic pathological features, with diverse fibroblastic cell morphologies, regions of necrosis and large hemorrhages (Figure 6c), yet were almost always GFAP-positive (Figure S8). In sharp contrast, tumors with Rb1 mutations were composed of round cells with dense nuclei,
A
uthor Man
uscr
ipt
A
uthor Man
uscr
ipt
A
uthor Man
uscr
ipt
A
uthor Man
uscr
ipt
frequently with proliferative spindles and giant cells with massive nuclear aneuploidy and pleiomorphism, but rarely with regions of necrosis or large-area hemorrhage (Figure 6d), and often contained mixtures of GFAP-positive and GFAP-negative cells (Figure S8). Transcriptomic characterization of tumors with differing mutational backgrounds
We then investigated the molecular underpinnings of gliomagenesis driven by different combinations of drivers (Figure 7a, Figure S9b). We performed mRNA-seq to profile the transcriptome of these mutant glioma cells (Nf1, Nf1;Mll3, Rb1, and Rb1;Zc3h13, n = 3 cell replicates each) (Tables S20, S21). Comparing Nf1-mutant and Rb1-mutant cells, we found that 616 genes were more highly expressed in Rb1 cells (Benjamini-Hochberg adjusted p < 0.05 and log fold change ≥ 1), while 982 genes were more highly expressed in Nf1 cells (Figure 7b, Table S22). Gene ontology analysis of the genes associated with higher expression in Nf1-mutant cells revealed multiple enriched categories (Benjamini-Hochberg adjusted p < 0.05), including extracellular region part, biological adhesion, neuron
differentiation, hormone metabolic process, cell motion, and cell-cell signaling (Figure 7c). Gene ontology analysis of the genes associated with higher expression in Rb1-mutant cells revealed a distinct set of enriched categories (adjusted p < 0.05), which surprisingly included regionalization, anterior/posterior pattern formation, transcription factor activity, embryonic morphogenesis, cell adhesion, extracellular matrix, neuron differentiation, and GTPase regulator activity (Figure 7d). Strikingly, a total of 13 Homeobox genes were among the top-40 upregulated genes in Rb1 mutants.
To understand the direct effect of additional mutations on the transcriptome of these cells, we next compared Nf1;Mll3 to Nf1 cells, and Rb1;Zc3h13 to Rb1 cells. We found that 522 genes were upregulated in Nf1;Mll3 compared to Nf1 cells, while 175 were downregulated (Figure 7e, Table S23). Gene ontology analysis of the upregulated genes in Nf1;Mll3 cells revealed enrichment of extracellular matrix, EGF-like region, biological adhesion, calcium ion binding, tube development, and growth factor binding (Figure 7f). Comparing
Rb1;Zc3h13 to Rb1 cells revealed 703 upregulated and 166 downregulated genes (Figure 7g, Table S24). Rb1;Zc3h13-high genes were enriched in categories such as extracellular matrix, immune response, cell adhesion, 2–5-oligoadenylate synthetase, cell morphogenesis, GTPase activity, cell motion, and vasculature development (Figure 7h). Collectively, these findings indicate that the addition of an Mll3 mutation significantly alters the transcriptome of Nf1 mutant cells, as does the addition of a Zc3h13 mutation on Rb1 mutant cells. Secondary mutations influence the transcriptome and engender chemotherapeutic resistance
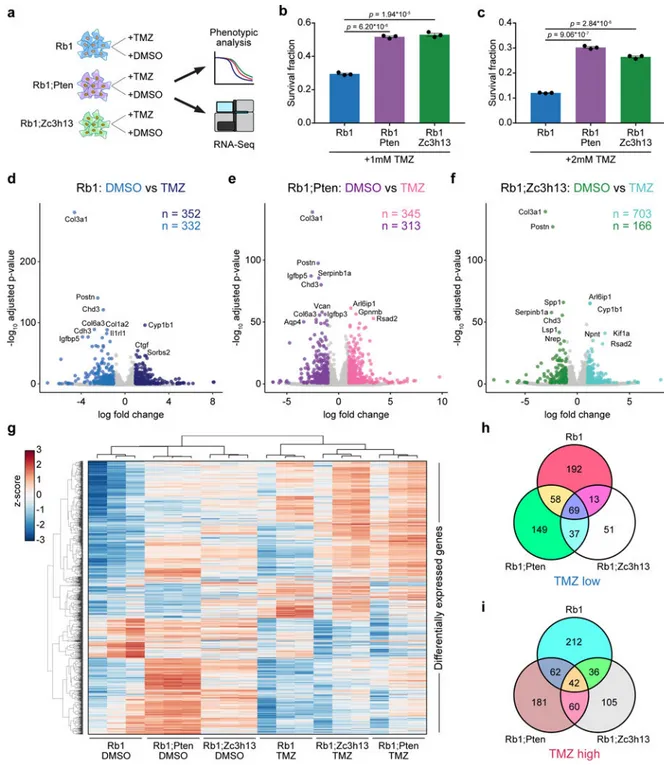
As GBM remains a very challenging cancer type to treat, understanding the molecular changes underlying drug response is of profound importance. We thus performed drug-treatment-RNA-seq experiments to investigate the transcriptome responses of
AAV-CRISPR-induced GBM cells (Rb1, Rb1;Pten and Rb1;Zc3h13) to TMZ, a chemotherapeutic with significant albeit small survival benefit for GBM patients, among the only 4 currently approved drugs for this disease (Methods) (Figure 8a). Drug response phenotyping showed that Zc3h13 loss-of-function rendered Rb1 cells significantly more resistant to 1mM TMZ, similar to Pten loss-of-function (two-tailed t-test, t4 = 31.32 and t4 = 23.51, p = 6.20 * 10−6
A
uthor Man
uscr
ipt
A
uthor Man
uscr
ipt
A
uthor Man
uscr
ipt
A
uthor Man
uscr
ipt
and p = 1.94 * 10−5, for Rb1;Pten vs. Rb1 and Rb1;Zc3h13 vs. Rb1, respectively) (Figure 8b). These differences were also observed with 2mM TMZ (t4 = 50.69 and t4 = 38.10, p = 9.06 * 10−7 and p = 2.84 * 10−6, for Rb1;Pten vs. Rb1 and Rb1;Zc3h13 vs. Rb1,
respectively) (Figure 8c). Given the differential responses among these three genotypes, we performed mRNA-seq to profile the transcriptome of these mutant cells treated with TMZ as compared to DMSO controls (Tables S20, S21). Differential expression analyses of TMZ and DMSO treated cells from each of the three genotypes revealed systematic changes in gene expression (Figure 8d–f, Table S25–27). Collectively, the differentially expressed genes in the TMZ vs. DMSO comparisons uncovered a molecular map of the transcriptomic differences between genotypes in response to TMZ treatment (Figure 8g).
Of the genes that were significantly reduced upon TMZ treatment in each group, a total of 69 genes were shared among all three genotypes (Figure 8h, Table S28), indicating that these genes are a common transcriptional response to TMZ. As Rb1;Zc3h13 and Rb1;Pten cells exhibited greater survival fractions with TMZ treatment when compared to Rb1 cells, we identified 37 genes that were significantly reduced upon TMZ treatment in Rb1;Zc3h13 and Rb1;Pten cells, but not in Rb1 cells (Figure 8h, Table S28). As for the genes that were significantly induced by TMZ, a total of 42 genes were common in all three genotypes (Figure 8i, Table S29), representing a shared TMZ-induced gene signature Interestingly, we identified 60 genes that were upregulated upon TMZ treatment in Rb1;Zc3h13 and Rb1;Pten cells, but not in Rb1 cells. These included Arl6ip1, which encodes a protein that has been shown to suppress cisplatin-induced apoptosis in cancer cells26, and Cd274 (also known as PD-L1), which encodes the ligand for the inhibitory receptor PD-1 that is currently a major focus of investigation in cancer immunotherapy27. Taken together, the transcriptomic analyses provide unbiased molecular signatures underlying the increased TMZ-resistance upon Zc3h13 or Pten mutations in Rb1-oncotype glioma cells, suggesting that the precise combinations of mutational drivers present in individual GBMs directly influence therapeutic responses.
Discussion
To date, there has been no unbiased phenotypic picture of which genetic factors and combinations are necessary or sufficient to drive tumorigenesis in the brain. In order to answer these questions, it is critical to directly test the hypotheses gleaned from cancer genomics in a controlled experimental setting to find causative genes and to quantitatively measure their phenotypes in vivo. Determining whether these alterations are bona fide driver mutations requires direct in vivo testing, and has historically been performed using cell lines or genetically engineered mouse models28. Development and applications of pioneering mouse models of GBM have led to profound progress in our understanding of tumor initiation, stem cell populations, progression and therapeutic responses of GBM29–40 driven by a variety of important mutations. The CRISPR system41–43 has been utilized to directly mutate oncogenes and tumor suppressor genes in somatic cells for modeling genetic events in various cancer types (reviewed in44). We now demonstrate high-throughput gene editing for multiplexed autochthonous GBM models in fully immunocompetent mice. Our study provides a massively parallel view of tumor suppressors in vivo, revealing the relative selective strength of mutations in these genes when competing in the brain, as well as the
A
uthor Man
uscr
ipt
A
uthor Man
uscr
ipt
A
uthor Man
uscr
ipt
A
uthor Man
uscr
ipt
driver variations between individuals. As CRISPR targeting might lead to off-target effects at other loci, we performed exome sequencing for a subset of the mTSG brain samples. This dataset revealed unbiased, exome-wide measurement of other mutations (Figure S7e, Tables S30–31). These mutations might be caused by off-target effects of CRISPR, rare AAV integrations45, or by the unstable genomes of GBM cells, especially those with p53 loss20, throughout tumorigenesis.
Across all genes tested, the mutation frequencies in this highly complex mouse model of GBM significantly correlate with the mutation frequencies in human patients from two large independent cohorts (TCGA and Yale Glioma bank), suggesting the clinical relevance of the findings. Several of the novel SMGs highly enriched in this mouse study have also been associated with GBM in the clinical setting, such as B2M, CIC, MLL2, MLL3, SETD2, ZC3H13 and ARID1B11, 46–49. Because differences in driver mutations can dramatically affect treatment efficacies in pre-clinical animal models and in patients, a functional understanding of cancer drivers is therefore essential for precision medicine50.
We also performed a lentiCRISPR direct in vivo screen in GBM, using the same mTSG library (Methods, Table S32, Figure S9c–d). We found that the AAV-mTSG CRISPR library resulted in more robust gliomagenesis in vivo compared to lentiCRISPR mTSG, in terms of latency (death of first animal, 84 vs. 200 days), survival (median survival, 4 vs. 10 months), and penetrance (100% vs. 67%). However, AAVs usually do not integrate into the genome, except under certain circumstances (low rate of integration at AAVS1 locus)45. Thus, AAV-encoded transgenes such as exogenously supplied sgRNAs do not replicate as cells divide during tumor progression, limiting the readout of the mTSG library by PCR amplification of the sgRNA cassette itself. Instead, we achieved successful readout of driver mutations by sequencing the predicted sgRNA cutting sites using ultra-deep targeted captured sequencing. A key advantage of this approach is the ability to perform high-throughput mutagenesis in an autochthonous model of GBM, in which tumors directly evolve from normal cells at the organ site in situ in immunocompetent mice, without cellular transplantation. This platform can be readily extended to study other types of cancer for tumor progression, as well as therapeutic responses in vivo. Taken together, our study provides a systematic and unbiased molecular landscape of functional tumor suppressors in an autochthonous mouse model of GBM, opening new paths for high-throughput analysis of cancer genetics directly in vivo.
Online Methods
Please see the Life Sciences Reporting Summary for additional information about the methods used in this study.
Design, synthesis and cloning of the mTSG library
Briefly, pan-cancer mutation data from 15 cancer types were retrieved from The Cancer Genome Atlas (TCGA portal) via cBioPortal51 and Synapse (https://www.synapse.org). Significantly mutated genes were calculated similar to previously described methods22–25. Known oncogenes were excluded and only known or predicted tumor suppressor genes (TSGs) were included. The top 50 TSGs were chosen, and their mouse homologs (mTSG) were retrieved from mouse genome informatics (MGI) (http://www.informatics.jax.org). A
A
uthor Man
uscr
ipt
A
uthor Man
uscr
ipt
A
uthor Man
uscr
ipt
A
uthor Man
uscr
ipt
total of 49 mTSGs were found. A total of 7 known housekeeping genes were chosen as internal controls. We designed sgRNAs against these 56 genes using a previously described method52, 53 with our custom scripts. Five sgRNAs were chosen for each gene, plus 8 non-targeting controls (NTCs), making a total 288 sgRNAs in the mTSG library. There were two sets of duplicate sgRNAs, Cdkn2a-sg2 / Cdkn2a-sg5, and Rpl22-sg4 / Rpl22-sg5, leaving a total of 286 unique sgRNAs.
Design, cloning of an AAV-CRISPR GBM vector and mTSG sgRNA library cloning
An AAV-CRISPR vector was designed for astrocyte-specific genome editing. This vector contains a cassette specifically expresses Cre recombinase under the control of a GFAP promoter for conditional induction of Cas9 expression in astrocytes in the brain when delivered to LSL-Cas9 mice54. Two sgRNA cassettes were built in this vector, one encoding an sgRNA targeting Trp53, the most frequently mutated gene in cancer22, 23, 25, with the other being an empty sgRNA cassette (double SapI sites for sgRNA cloning) enabling flexible targeting of genes of interest in either individual or pooled manner. The vector was generated by gBlock gene fragment synthesis (IDT) followed by Gibson assembly (NEB). The mTSG libraries were generated by oligo synthesis, pooled, and cloned into the double SapI sites of the AAV-CRISPR GBM vector. The library cloning was done at over 100× coverage to ensure proper representation. Plasmid library representation was readout by barcoded Illumina sequencing as described previously55 with primers customized to this vector.
AAV-mTSG viral library production
The AAV-CRISPR GBM plasmid vector (AAV-vector) and library (AAV-mTSG) were subjected to AAV9 production and chemical purification. Briefly, HEK 293FT cells (ThermoFisher) were transiently transfected with transfer (AAV-vector or AAV-mTSG), serotype (AAV9) and packaging (pDF6) plasmids using polyethyleneimine (PEI). Each replicate consist of five of 80% confluent HEK 293FT cells in 15-cm tissue culture dishes or T-175 flasks (Corning). Multiple replicates were pooled to enhance production yield. Approximately 72 hours post transfection, cells were dislodged and transferred to a conical tube in sterile PBS. 1/10 volume of pure chloroform was added and the mixture was
incubated at 37°C and vigorously shaken for 1 hour. NaCl was added to a final concentration of 1 M and the mixture was shaken until dissolved and then pelleted at 20k g at 4°C for 15 minutes. The chloroform layer was discarded while the aqueous layer was transferred to another tube. PEG8000 was added to 10% (w/v) and shaken until dissolved. The mixture was incubated at 4°C for 1 hour and then spun at 20k g at 4° C for 15 minutes. The supernatant was discarded and the pellet was resuspended in DPBS plus MgCl2 and treated with Benzonase (Sigma) and incubated at 37°C for 30 minutes. Chloroform (1:1 volume) was then added, shaken, and spun down at 12k g at 4C for 15 min. The aqueous layer was isolated and passed through a 100 kDa MWCO (Millipore). The concentrated solution was washed with PBS and the filtration process was repeated. Virus was titered by qPCR using custom Taqman assays (ThermoFisher) targeted to Cre.
A
uthor Man
uscr
ipt
A
uthor Man
uscr
ipt
A
uthor Man
uscr
ipt
A
uthor Man
uscr
ipt
Design, cloning of lentiCRISPR GBM vectors and mTSG sgRNA library, and lentivirus production
Two lentiCRISPR vectors were designed, one for constitutive, and the other for astrocyte-specific genome editing. These vectors contain a cassette astrocyte-specifically expresses Cre recombinase under the control of an EFS promoter or a GFAP promoter for conditional induction of Cas9 expression in the brain when deliver to LSL-Cas9 mice. Two sgRNA cassettes were built in this vector, one encoding an sgRNA targeting Trp53, with the other being an empty sgRNA cassette (double BsmbI sites for sgRNA cloning) enabling flexible targeting of genes of interest in either individual or pooled manner. These vectors were generated by gBlock gene fragment synthesis (IDT) followed by Gibson assembly (NEB). The mTSG libraries were generated by oligo synthesis, pooled, and cloned into the double BsmbI sites of the lentiCRISPR GBM vectors. The library cloning was done at over 100× coverage to ensure proper representation. Plasmid library representation was readout by barcoded Illumina sequencing as described above, with primers customized to the vectors. The LentiCRISPR GBM plasmid vector (Lenti-vector) and library (Lenti-mTSG) were subjected to high-titre lentivirus production and purification. Briefly, HEK 293FT cells (ThermoFisher) were transiently transfected with transfer (Lenti-vector or Lenti-mTSG), and packaging (psPAX and pMD2.G) plasmids using PEI or Lipofectamine. Each replicate consist of five of 80% confluent HEK 293FT cells in 15-cm tissue culture dishes or T-175 flasks (Corning). Multiple replicates were pooled to enhance production yield.
Approximately 48 hours post transfection, virus-containing media was collected, and purified via sucrose gradient ultracentrifugation at >=30,000 rpm for 2–3h. The supernatant was discarded and the pellet was dried and resuspended with 100 μl sterile PBS in 4 °C overnight. Virus was titered by viral protein p24 ELISA (RnD).
Animal work statements
All animal work was performed under the guidelines of Yale University Institutional Animal Care and Use Committee (IACUC) and Massachusetts Institute of Technology Committee for Animal Care (CAC), with approved protocols (Chen-2015-20068, Zhang-0414-024-17, and Sharp-0914-091-17), and were consistent with the Guide for Care and Use of
Laboratory Animals, National Research Council, 1996 (institutional animal welfare assurance no. A-3125-01).
Stereotaxic surgery and virus transduction in the mouse brain
Conditional LSL-Cas9 knock-in mice were bred in a mixed 129/C57BL/6 background. Mixed gender (randomized males and females) 6–14 week old mice were used in the experiment. Animals were maintained and breed in standard individualized cages with maximum of 5 mice per cage, with regular room temperature (65–75°F, or 18–23°C), 40– 60% humidity, and a 12h:12h light cycle. Mice were anesthetized by intraperitoneally injection of ketamine (100 mg/kg) and xylazine (10 mg/kg), or by inhalation of isoflurane at approximately 2% for 20–30 minutes. We also administered buprenorphine HCl (0.1 mg/ kg), or carprofen (5.0 mg/kg) intraperitoneally as a pre-emptive analgesic. Reflexes were tested before surgical procedures. Once subject mice were in deep anesthesia, they were immobilized in a stereotaxic apparatus (Kopf, or Stoelting) using intra-aural positioning
A
uthor Man
uscr
ipt
A
uthor Man
uscr
ipt
A
uthor Man
uscr
ipt
A
uthor Man
uscr
ipt
studs and a tooth bar to immobilize the skull. Heat is provided for warmth by a standard heating pad, or a heatlamp. According to the mouse brain stereotaxic coordinates56, we drilled a 1–2 mm hole on the surface of the skull, and used a 33 G Nanofil syringe needle (World Precision Instrument) to inject into the lateral ventricle (LV) at 0.6–1.0 mm caudal/ posterior to Bregma, 0.8–1.5 mm right-side lateral to Bregma, and 2.0–3.0 mm deep from the pial surface for injection (coordinates: A/P −0.6 to −1.0, M/L 0.8 to 1.5, D/V −2.0 to −3.0). For a small fraction of animals, injections were made into hippocampus (HPF) at the following coordinates (A/P −1.3, M/L 0.6, D/V −1.7). PBS, 8 uL AAV (Between 1 × 10¹⁰ – 1× 10¹¹ viral genome copies, or Cre copy number equivalent), or 8 uL lentivirus (Between 8 × 10⁹ – 8 × 10¹⁰ viral particles, or p24 equivalent) was injected into the right hemisphere of the brain for each mouse. Injection rates were monitored by an UltraMicroPump3 (World Precision Instruments). After injection, the incision site was closed with 6–0 Ethilon sutures (Ethicon by Johnson & Johnson), or a VetBond tissue glue (3M). Animal were
postoperatively hydrated with 1 mL lactated Ringer’s solution (subcutaneous) and housed on warmed cages or in a temperature controlled (37°C) environment until achieving ambulatory recovery. Meloxicam (1–2 mg/kg) was also administered subcutaneously directly after surgery.
MRI
MRI imaging was performed using standard imaging protocol with MRI machines (Varian 7T/310/ASR-whole mouse MRI system, or Bruker 9.4T horizontal small animal systems). Briefly, animals were anesthetized using isoflurane, and setup in the imaging bed with a nosecone providing constant isoflurane. A total of 20 – 30 views were acquired for each mouse brain using a custom setting: echo time (TE) = 20, repetition time (TR) = 2000, slicing = 0.5 mm. Raw image stacks were processed using Osirix or Slicer tools57. Rendering and quantification were performed using Slicer (www.slicer.org). For all mice with brain tumors, only 1 tumor was observed per mouse. Tumors were approximate as spheres and their sizes were calculated with the following formula:
Survival analysis
We observed that mice that developed brain tumors rapidly deteriorate in their body condition scores. Mice with observed macrocephaly and body condition score ≤ 1 were euthanized and the euthanasia date was recorded as the last survival date. Occasionally mice bearing brain tumors died unexpectedly early, and the date of death was recorded as the last survival date. Cohorts of mice stereotaxically injected with PBS, AAV-vector or AAV-mTSG virus were monitored for their survival. Survival analysis was analyzed using standard Kaplan-Meier analysis. Of note, several AAV-vector or PBS injected mice were sacrificed at time points earlier than 299 days (at times when a certain AAV-mTSG mice were found dead or euthanized due to poor body conditions), to provide time-matched histology, but those mice were healthy without brain tumors or other signs of detectable symptoms. Mice euthanized early in healthy state were excluded from calculation of survival percentage.
A
uthor Man
uscr
ipt
A
uthor Man
uscr
ipt
A
uthor Man
uscr
ipt
A
uthor Man
uscr
ipt
Mouse brain dissection, fluorescent imaging, and histology
Mice were sacrificed by carbon dioxide asphyxiation or deep anesthesia with isoflurane followed by cervical dislocation. Mouse brains were manually dissected under a fluorescent stereoscope (Zeiss, Olympus or Leica). Brightfield and/or GFP fluorescent images were taken for the dissected brain, and overlaid using ImageJ58. Brains were then fixed in 4% formaldehyde or 10% formalin for 48 to 96 hours, embedded in paraffin, sectioned at 6 μm and stained with hematoxylin and eosin (H&E) for pathology. For tumor size quantification, H&E slides were scanned using an Aperio digital slidescanner (Leica). Tumors were manually outlined as region-of-interest (ROI), and subsequently quantified using ImageScope (Leica). Sections were de-waxed, rehydrated and stained using standard immunohistochemistry (IHC) protocols as previously55, 59. The following commonly used antibodies were used for IHC: rabbit anti-Ki67 (abcam ab16667, 1:500), rabbit anti-GFP (ThermoFisher Scientific A11122, 1:300) rabbit GFAP (Dako, 1:500), and mouse anti-Cas9 (Diagenode, 1:300).
Mouse tissue collection for molecular biology
Mouse brain (targeting organ) and liver (non-targeting organ) were dissected and collected manually. For molecular biology, tissues were flash frozen with liquid nitrogen, ground in 24 Well Polyethylene Vials with metal beads in a GenoGrinder machine (OPS diagnostics). Homogenized tissues were used for DNA/RNA/protein extractions using standard molecular biology protocols.
Genomic DNA extraction from cells and mouse tissues
For genomic DNA (gDNA) extraction, 50–200 mg of frozen ground tissue was resuspended in 6 ml of Lysis Buffer (50 mM Tris, 50 mM EDTA, 1% SDS, pH 8) in a 15 ml conical tube, and 30 μl of 20 mg/ml Proteinase K (Qiagen) was added to the tissue/cell sample and incubated at 55 °C overnight. The next day, 30 μl of 10 mg/ml RNAse A (Qiagen) was added to the lysed sample, which was then inverted 25 times and incubated at 37 °C for 30 minutes. Samples were cooled on ice before addition of 2 ml of pre-chilled 7.5M ammonium acetate (Sigma) to precipitate proteins. The samples were vortexed at high speed for 20 seconds and then centrifuged at ≥ 4,000 × g for 10 minutes. Then, a tight pellet was visible in each tube and the supernatant was carefully decanted into a new 15 ml conical tube. Then 6 ml 100% isopropanol was added to the tube, inverted 50 times and centrifuged at ≥4,000 × g for 10 minutes. Genomic DNA was visible as a small white pellet in each tube. The supernatant was discarded, 6 ml of freshly prepared 70% ethanol was added, the tube was inverted 10 times, and then centrifuged at ≥4,000 × g for 1 minute. The supernatant was discarded by pouring; the tube was briefly spun, and remaining ethanol was removed using a P200 pipette. After air-drying for 10–30 minutes, the DNA changed appearance from a milky white pellet to slightly translucent. Then, 500 μl of ddH2O was added, the tube was incubated at 65 °C for 1 hour and at room temperature overnight to fully resuspend the DNA. The next day, the gDNA samples were vortexed briefly. The gDNA concentration was measured using a Nanodrop (Thermo Scientific).
A
uthor Man
uscr
ipt
A
uthor Man
uscr
ipt
A
uthor Man
uscr
ipt
A
uthor Man
uscr
ipt
Targeted capture sequencing probe design
Targeted capture sequencing probes were designed as following: the predicted cutting sites (3bp 5′ of PAM) of the 280 gene-targeting sgRNAs in the mTSG library plus the Trp53-targeting sgRNA in the vector were retrieved from mouse genome (mm10). The 140bp sequences of the flanking regions of the cutting sites (5′- 70bp and 3′- 70bp) were retrieved using Bedtools60. The regions were consolidated using NimbleDesign (Roche / NimbleGen), and probe matches were set with these parameters (Preferred Close Matches = 3, where initial selection of probes for a given region will only include probes with 3 close matches or less; and Maximum Close Matches = 20, where if there are insufficient probes available for a given region at the Preferred Close Match number, the threshold will be incrementally increased to 20 until adequate coverage is achieved. After consolidation, a number of 178 regions covering 277 sgRNAs, with a total of 33638bp were covered in the probeset, with Target Bases Covered = 32239 (95.8%) and one target sgRNA without coverage due to a lack of qualified candidate probes in the region.
Targeted capture sequencing
The mTSG-Amplicon targeted capture sequencing probes were synthesized using the SeqCap EZ Probe Pool synthesis procedure (Roche). The capture sequencing was done following standard Illumina-Roche-Illumina protocols. Genomic DNA samples from mouse organs were subjected to fragmentation, followed by a library preparation step using KAPA Library Preparation Kit (Illumina). The libraries were then amplified using LM-PCR, hybridized to the mTSG-Amplicon probe pool, washed and recovered, and amplified with multiplexing barcodes using LM-PCR. The multiplexed library was then QC’ed using qPCR, and subjected to high-throughput sequencing using the Hiseq-2500 or Hiseq-4000 platforms (Illumina) at Yale Center for Genome Analysis. 277/278 (99.6%) of unique targeted sgRNAs were captured for all samples from this experiment, with the missing one being Arid1a-sg5.
mTSG sgRNA cutting efficiency measurement
The mouse mTSG sgRNA cutting efficiency measurement was performed similar to the screen with the exception of early sampling. Briefly, AAV-mTSG library virus was injected in to LV of LSL-Cas9 mice, but instead of end-point tumor, mice were sacrificed at early time point (3.5 weeks post injection) and examined under fluorescent stereoscope, and GFP + regions from the brain were dissected. Genomic DNA was extracted, and subjected to capture sequencing.
Mouse whole-exome capture sequencing
The mouse whole-exome capture was performed using SeqCap EZ exome kit (Roche). Briefly, capture sequencing was done following standard Illumina-Roche-Illumina protocols. Genomic DNA samples from mouse organs were subjected to fragmentation, followed by a library preparation step using KAPA Library Preparation Kit (Illumina). The libraries were then amplified using LM-PCR, hybridized to the exome probe pool, washed and recovered, and amplified with multiplexing barcodes using LM-PCR. The multiplexed library was then
A
uthor Man
uscr
ipt
A
uthor Man
uscr
ipt
A
uthor Man
uscr
ipt
A
uthor Man
uscr
ipt
QC’ed using qPCR, and subjected to high-throughput sequencing using the Hiseq-2500 or Hiseq-4000 platforms (Illumina) at Yale Center for Genome Analysis.
Illumina sequencing data processing and variant calling
FASTQ reads were mapped to the mm10 genome using the bwa mem function in BWA v0.7.1361. Bam files were merged, sorted, and indexed using bamtools v2.4.062 and samtools v1.363. For each sample, indel variants were called using samtools and VarScan v2.3.964. Specifically, we used samtools mpileup (–d 1000000000 –B –q 10), and piped the output to VarScan pileup2indel (–min-coverage 1 –min-reads2 1 –min-var-freq 0.001 –p-value 0.05). To link each indel to the sgRNA that most likely caused the mutation, we took the center position of each indel and mapped it to the closest sgRNA cut site.
Calling significantly mutated sgRNAs and significantly mutated genes
We further filtered all detected indels by requiring that each indel must overlap the ± 3 base pairs flanking the closest sgRNA cut site, as Cas9-induced double-strand breaks are
expected to occur within a narrow window of the predicted cut site. We then utilized a series of criteria to identify high-confidence mutations: 1) As an initial pass to exclude possible germline mutations, we removed any sgRNAs with indels present in more than half of the control samples with greater than 5% variant frequency. In our data, this filter specifically removed Rps19_sg5 from further consideration. 2) To determine significantly cutting sgRNAs in each sample, we used a false-discovery approach based on the PBS and vector control samples. For each sgRNA, we first took the highest % variant read frequency across all control samples; in order for a mutation to be called in an mTSG sample, the % variant read frequency had to exceed the control sample cutoff. However, since the base vector contained a Trp53 sgRNA (Trp53 sg8) whose cut site was only 1 bp away from the target site of Trp53 sg4 (from mTSG library), we only considered PBS samples when calculating the false-discovery cutoff for Trp53 sg4. Nevertheless, in the current study this exception was unnecessary because of our third filter: 3) As we were most interested in identifying the dominant clones in each sample, we further set a 5% variant frequency cutoff on top of the false-discovery cutoff. These criteria gave us a binary table (i.e. not significantly mutated vs. significantly mutated) detailing each sgRNA and whether its target site was significantly mutated in each sample. None of the AAV-vector samples passed the 5% cutoff at the p53 sg4/8 target site, which is consistent with our observation that no tumors were found in vector-treated animals. To convert significantly cutting sgRNAs into significantly mutated genes, we simply collapsed the binary sgRNA scores by gene, such that if any of the sgRNAs for a gene were found to be significantly cutting, the gene would be called as significantly mutated.
Exome sequencing data analysis
For exome sequencing analysis, we imposed a modified set of criteria on each detected variant: 1) ≥ 10 supporting reads for the reference allele; 2) ≥ 10 supporting reads for the variant allele; 3) the variant is within ± 6 bp of a Cas9 PAM, NGG (or CCN on the reverse strand); 4) a variant allele frequency < 75%, as this was the maximum detected variant frequency out of the mTSG brain samples; 5) the variant was not detected in any sequenced control samples, which were considered as germline variants.
A
uthor Man
uscr
ipt
A
uthor Man
uscr
ipt
A
uthor Man
uscr
ipt
A
uthor Man
uscr
ipt
Clustering of variant frequencies to infer clonality of tumors
For each mTSG brain sample, we extracted the individual variants that comprised the SMS calls in that sample, with a cutoff of 5% variant frequency to eliminate low-abundance variants. Because of these cutoffs, 3 sequenced mTSG brain samples were not eligible for variant frequency clustering analysis. To identify clusters of variant frequencies in an unbiased manner, we modeled the variant frequency distribution with a Gaussian kernel density estimate, using the Sheather-Jones method to select the smoothing bandwidth. From the kernel density estimate, we then identified the number of local maxima (i.e. “peaks”) within the density function. The number of peaks thus represents the number of variant frequency clusters for an individual sample, which is an approximation for the clonality of the tumors.
Coding frame analysis
For coding frame and exonic/intronic analysis, we only considered the indels that were associated with a sgRNA which had been considered significantly mutated in that particular sample. This final set of significant indels was converted to .avinput format and
subsequently annotated using ANNOVAR v. 2016Feb01, using default settings65. Co-occurrence and correlation analysis
Co-occurrence analysis was performed by first generating a double-mutant count table for each pairwise combination of genes in the mTSG library. Statistical significance of the co-occurrence was assessed by hypergeometric test. For correlation analysis, we first collapsed the % variant frequency tables on the gene level (in other words, summing the % variant frequencies for all 5 of the targeting sgRNAs for each gene). Using these summed % variant frequency values, we calculated the Spearman correlation between all gene pairs, across each mTSG sample. Statistical significance of the correlation was determined by converting the correlation coefficient to a t-statistic, and then using the t-distribution to find the associated probability. A similar approach was used to analyze co-occurring mutations in human TCGA GBM data.
Testing driver combinations with sgRNA minipool
Mixtures of five sgRNAs targeting each gene were cloned as sgRNA minipool into the same astrocyte-specific AAV-CRISPR vector. For gene pair targeting, the five-sgRNA single gene minipools from both genes were mixed 1:1. Plasmid mixes were then packaged into AAV1/2. Briefly, HEK293FT cells were transfected with the minipools plasmids, pAAV1 plasmid, pAAV2 plasmid, helper plasmid pDF6, and PEI Max (Polysciences, Inc. 24765-2) in DMEM (ThermoFisher, 10569-010). 72 hours post transfection, cell culture media was discarded and cells were rinsed and pelleted via low speed centrifugation. Cells were then lysed and the supernatant containing viruses was applied to HiTrap heparin columns (GE Biosciences 17-0406-01) and washed with a series of salt solutions with increasing molarities. During the final stages, the eluates from the heparin columns were concentrated using Amicon ultra-15 centrifugal filter units (Millipore UFC910024). Titering of viral particles was executed by quantitative PCR using custom Cre-targeted Taqman probes (ThermoFisher). After packaging, AAV minipools were stereotaxically injected into the
A
uthor Man
uscr
ipt
A
uthor Man
uscr
ipt
A
uthor Man
uscr
ipt
A
uthor Man
uscr
ipt
ventricle of LSL-Cas9 mice. Survival and histology analysis followed injection as described above. Several control (uninjected, EYFP and vector) mice were sacrifice as surrogate histology although they were in good body condition and were subsequently found devoid of tumor.
Generation of Nf1 and Rb1 mutant cell lines from primary GBMs induced by AAV-CRISPR minipools
Autochthonous mouse GBMs were induced by stereotaxic injection with the Nf1 or Rb1 AAV minipool (in the AAV9-sgTrp53-sgX-GFAP-Cre vector described above). Tumor-containing brains were visually inspected under a fluorescent dissecting scope, made into single-cell suspension through physical dissociation plus Collagenase/DNase digestion, and cultured in DMEM supplemented with 10% FBS and Pen/Strep. Growing clones were further established as autochthonous mouse GBM cell lines.
Single sgRNA knockout lentiviral production
Lenti-pHKO-U6-sgBsmBI-EF1a-Puro-P2A-FLuc was generated by subcloning P2A-Fluc expression cassette into lentiviral CRISPR knockout vector by Gibson assembly. For the cloning of sgRNA targeting individual genes such as Pten, Arid1b, Mll3 (Kmt2c), B2m, and Zc3h13 (Table S1), the corresponding oligos were synthesized, annealed and cloned into BsmBI linearized lentiviral knockout vector. Lentiviruses were produced by transfecting lentiviral knockout plasmids, together with pMD2.G and psPAX2 into 80–90% confluent HEK293FT cells, with viral supernatants collected 48 and 72 h post-transfection, aliquoted and stored in −80°C.
Generation of NF1+geneX and RB1+geneX knockout cell lines
The Nf1 and Rb1 knockout tumor cells were infected by single sgRNA knockout lentiviruses at M.O.I <= 0.3 to further knockout desired geneX. 24 h post-infection, lentiviral transduced cells were selected by the addition of 4–8 μg/ml puromycin and were split 2–3 days.
Temozolomide (TMZ) treatment, Cell viability assay, and RNAseq
After 7–9 days’ culture under puromycin selection, lentiviruses-infected Nf1 and Rb1 knockout tumor cells were plated in triplicates into 96-well plate at a density of 2.5 × 10³ cells per well, and ~5 × 10⁶ cells were collected at the same time and used for cutting efficiency analysis. One day after plating, either TMZ or DMSO was added at a
concentration of 10 μM, 100 μM, 500 μM, 1 mM, and 2 mM. After 3 days of drug/vehicle treatment, cell viability was measured using CellTiter Glo (Promega) according to the manufactures’ protocol. Briefly, we first equilibrated the CellTiter Glo at room temperature for 1 h before use. The media of 96-well plates was aspirated, and then 50 μL fresh DMEM +10%FBS and 50 μL CellTiter Glo was added. The luminescent signals were readout using EnVision plate reader (PerkinElmer). For RNAseq samples preparation, cell lines harboring specific gene knockouts were cultured for 7–9 days under the selection pressure of
puromycin, and then plated into 6-well plates at a density of 2 × 10⁵ cells per well in triplicates. 24 h after plating, 1 mM TMZ or DMSO in fresh DEME + 10% FBS was added
A
uthor Man
uscr
ipt
A
uthor Man
uscr
ipt
A
uthor Man
uscr
ipt
A
uthor Man
uscr
ipt
and cultured for another 48 h. Then, cellular RNA of control or treated cells were extracted by adding 350 μL TRIzol Reagent (Invitrogen) directly into 6-well plates to lyse the cells, followed by gently shaking the plates and incubation for 5–10 min to complete and lysis and homogenization. Then, 70 μL chloroform was added, vigorously mixed, and centrifuged at 16,000 g for 15 min. Transfer the RNA containing aqueous phase to a new tube and further purified using RNeasy mini kit (Qiagen). After eluting RNA from column using Nuclease free water, the concentrations of sample RNA were normalized into 150–300 ng/uL for RNAseq.
T7 Endonuclease I (T7E1) Assays
The genomic DNA of these cells that were collected after 9 days of puromycin selection was extracted by using QuickExtract™ DNA Extraction Solution (Epicentre), mixed well and incubated at 65°C for 30–60 min. Then, 1–2 μL of genomic DNA from parental or Lenti-sgRNA transduced cells was used as the template to amplify gene of interest using surveyor primers (Table S33) with thermocycling conditions as 98°C for 1 min, 35 cycles of (98°C for 1 s, 60°C for 5 s, 72°C for 10 s), and 72°C for 1 min. The PCR products were gel-purified using QIAquick Gel Extraction Kit from 2% E-gel EX and quantified, followed by PCR products denaturing at 95°C for 5 min, and annealing by using following conditions: ramp from 95 to 85 °C at a rate of −2°C per seconds; from 85°C to 25°C at a rate of −0.1°C per second, and 4°C hold. 1 μL of T7 endonuclease I was added into annealed oligo, and incubated at 37°C for 60 min to digest the mismatched sites. The digested PCR products were loaded into 2% E-gel EX, and the amount of DNA fragments were quantified. The cutting efficiency was calculated to estimate gene editing using the following formula: Indels (%) = 100 × (1 – (1- fraction cleaved)1/2).
Transcriptome profiling of different driver combinations in the presence and absence of chemotherapy
Mixtures of five sgRNAs targeting each gene were cloned as sgRNA minipool into the same astrocyte-specific AAV-CRISPR vector. After packaging, AAV minipools were
stereotaxically injected into the lateral ventricle of LSL-Cas9 mice. Cell lines were derived from mouse GBMs by single-cell isolation, plating and culture in DMEM media. Additional driver mutations were introduced by lentiCRISPR where applicable. GBM cells with different drivers were treated with DMSO or TMZ for 48h, and harvested for mRNA-seq for transcriptome profiling. Briefly, total RNA was extracted from cancer cells derived from AAV-CRISPR minipools induced GBM treated with DMSO or TMZ, using commercially available kits (Qiagen / Thermofisher). PolyA-mRNA library was constructed using Illumina TruSeq mRNA library prep kit, and sequenced on Illumina Hiseq 2500 and/or Hiseq 4000 platform.
RNA-seq differential expression analysis
Strand-specific single-end RNA-seq read files were analyzed to obtain transcript level counts using Kallisto66, with the settings –rf-stranded -b 100. The counts were subsequently passed to the tximport R package to collapse to gene level counts. Pairwise differential expression analysis between groups was then performed using edgeR with default settings67.
A
uthor Man
uscr
ipt
A
uthor Man
uscr
ipt
A
uthor Man
uscr
ipt
A
uthor Man
uscr
ipt
Pathway enrichment analysis of differentially expressed transcripts
Using an adjusted p-value cutoff of 0.05, and a log fold change threshold of ±1, we determined the set of genes that were significantly upregulated or downregulated. We then used the resultant gene sets for DAVID functional annotation analysis68. We considered a GO category as statistically significant if the Benjamini-Hochberg adjusted p-value was less than 0.05.
GBM comparative cancer genomics analysis using TCGA datasets
Somatic mutation calls, copy number variation calls, RNA-seq expression z-scores, and clinical data containing patient survival information were obtained through cBioPortal for GBM on November 15, 2016. Pearson correlation coefficients were calculated comparing mouse and human mutation frequencies; statistical significance was calculated by converting the correlation coefficient to a t-statistic, and then using the t-distribution to calculate significance.
GBM comparative cancer genomics analysis using Yale Glioma datasets
Somatic mutation calls and copy number variation calls and partial clinical data containing diagnostic information were obtained from Yale Glioma tissue bank and data bank. All patient samples were de-identified. The general description, demographics and tumor characteristics are noted in the supplemental tables. Total event for each patient was calculated as the sum of mutation events and copy number variant events. Pearson
correlation coefficients were calculated comparing mouse and human mutation frequencies; statistical significance was calculated by converting the correlation coefficient to a t-statistic, and then using the t-distribution to calculate significance.
Histology analysis of clinical GBM samples from Yale Glioma tissue bank
Histology sections were obtained from Yale Glioma tissue bank. All patient samples were de-identified. The mutations associated with specific samples were obtained from Yale Glioma data bank. Slides stained with H&E or anti-GFAP were subsequently scanned using a slidescanner (Leica) and subjected to pathological analysis.
Statistical tests
In addition to the statistical tests detailed above, we used a two-tailed Welch’s t-test for comparisons in which group variances were unequal. If the variances were found to be sufficiently equal and the data was normally distributed, we used a standard two-tailed t-test. For evaluating differences in the incidence of tumors in different groups, we used Fischer’s exact test.
Blinding statement
Investigators were blinded for histology scoring, capture sequencing and RNA-seq collection, but not blinded for dissection, MRI, survival analysis, or sequencing analysis.