HAL Id: hal-02592869
https://hal.inrae.fr/hal-02592869
Submitted on 15 May 2020HAL is a multi-disciplinary open access archive for the deposit and dissemination of sci-entific research documents, whether they are pub-lished or not. The documents may come from teaching and research institutions in France or abroad, or from public or private research centers.
L’archive ouverte pluridisciplinaire HAL, est destinée au dépôt et à la diffusion de documents scientifiques de niveau recherche, publiés ou non, émanant des établissements d’enseignement et de recherche français ou étrangers, des laboratoires publics ou privés.
P5.2-8 Technical guide to map and describe
wildland-urban interfaces (WUIs)
C. Lampin-Maillet, Céline Bouillon, M. Long, D. Morge, M. Jappiot, G.
Herrero, L. Galiana, A. Mantzavelas
To cite this version:
C. Lampin-Maillet, Céline Bouillon, M. Long, D. Morge, M. Jappiot, et al.. P5.2-8 Technical guide to map and describe wildland-urban interfaces (WUIs). [Technical Report] irstea. 2009, pp.45. �hal-02592869�
!! " # $ % & % % ' $ $( $ " & %# ) ) " & * +* # , $ " % -* ( $ % . / " ,(* ) % ! 0 $ ) " $ % * * * 1 * ) 2 3 4 %( ( % # ! %( ' " 56 ( *() ** % ) 2 3 , % # ! * ' " 2 ( 5 "* $ * # % # " * % ) 7 $ # . / * . / ! " # $ % & ' ( )) ))* + , -() * % " ! $ ! ! * . (% $ " 7 ** , */ .# * % $ (! *! # % ) " * ( . (% $ " 7 ** , */ $/ 7 # % 0 # ) * # " * ( . (% $ " 7 ** , */ CemOA : archive ouverte d'Irstea / Cemagref
. 8 ' 9 ' 88 0 7 0 : + 88 90 7 0 8 9;0 ' 0 ' ; 0 0 < 0 ' 0 = 0 ; 20 ; 8 9 0 8 20 ' 9 > 1 8 ,0 ? 2 3 ;( % # % (* * ! % " @ A % % ( ) # * %( 2 # " $ % ! B % -C0 0 ( ! 7 ** 0 5? ! 0 " * $( % ! * * " % # A % % ( ) # !! $0 !! % $ *0 $ * " * " % ) % ! % * *! # * ( * )* % % ## ( ! ( * " $( % * ) * % ) # # ( B" (* $ # $( C ! * % " ! * # " @ * ( ( # $ A A % % ( ) # ! * " ) ! %( % * ! ( A % ! % " " 0 )( " " % " * * ) A % ! % . % !! %/ ,! % ; % A " * # A 4 &+ ! 4 A * % ! % % ! * % $( % # ! &+ * ( , - ! * # (* # *( " &+ !* " ) ! * % " $( % 1 " A % % ( ) # *0 # *D0 " (* $ # $( 0 $ * ( ( 0 $$ $ % -0 &+ ! $ 7 9 %( ' " * $ 0 %( ;E ( % * (- % * F *0 - ! 0 2 3 7 ! ( * + * # ' % %0 ,! ? ? ' G 9 8% 0 ; $ 2 : 7 8 ! ' 0 + E % " " * ' 0 7 $ #0 ? 2 -H I?? 5 52 33 ?0 - I?? 5 52 33 6 0 ! J $ # # CemOA : archive ouverte d'Irstea / Cemagref
Table of contents
1. INTRODUCTION 5
1.1. Context of Mediterranean region 5
1.2. The wildland-urban interface literature 6
1.2.1. Wildland-urban interface definitions 6
1.2.2. Wildland-urban interface mapping 6
1.3. Objectives of the technical guide 7
2. MATERIALS AND DATA 8
2.1. Study sites 8
2.2. Data, softwares 8
3. MAPPING METHODS OF THE WILDLAND-URBAN INTERFACE 10
3.1. Accurate of the WUI definition in the French context 10
3.2. Criteria to describe and map WUIs 11
3.2.1. Classifying and mapping housing configuration 11
3.2.2. Classification and mapping of horizontal structure of vegetation 13
3.2.3. Combination of the two previous criteria 14
4. TYPES OF WILDLAND-URBAN INTERFACES AND MAPPING 16
4.1. Examples 16
4.2. WUI mapping 17
5. A TOOL FOR WUI MAPPING: USER’S NOTICE 19
5.1. Requirements 19
5.2. License 19
5.3. Installation 20
5.4. Data requirements 20
5.4.1. Types of datafiles 20
5.4.2. Other requirements for a performed use of the tool WUImap 20
5.4.2.1. Geo-referencing 20
5.4.2.2. Datafile preparation 20
5.4.2.3. Raster layer resolution 21
5.5. Results coming from the WUImap tool 21
5.5.1. Map of housing configuration 22
5.5.2. Map of wildland-urban interfaces 22
5.6. Database management 24 5.7. Functioning 24 CemOA : archive ouverte d'Irstea / Cemagref
5.7.1. Setting up 24
5.7.2. Input files 25
5.7.3. Choice of directory for output data files 26
5.7.4. Calculation process 27
5.7.5. End of program 28
5.8. Program test 28
5.9. Display and results checking 28
5.10. Dis-installation 31
5.11. Sofware restrictions 32
6. ADAPTATION IN OTHER EUROPEAN COUNTRIES: EXAMPLE OF SPAIN 33
6.1. Example of the western of Madrid in Spain 33
6.2. WUImap© Cemagref 2009 - Spanish adaptation 35
7. SPECIFIC USE OF WUI MAP 36
7.1. Calculation of the Fire Hazard in WUI 36
7.2. A specific approach of fire risk assessment in WUIs by means of a total risk index 37
7.2.1. Spatial analysis based on WUI map 37
7.2.2. Total Fire risk models 39
7.2.3. Fire risk mapping in WUIs and analysis 39
8. REFERENCES 41 CemOA : archive ouverte d'Irstea / Cemagref
1. Introduction
1.1. Context of Mediterranean region
Each year, forest fires destroy about 500.000 hectares of vegetation in Europe, and more specific in the Mediterranean region. During 2007, wildfires in the five countries of southern Europe (Portugal, Spain, France, Italy and Greece) burned-over a total area of 575 531 ha (JRC, 2008; Lampin-Maillet, 2008), and scenarios of climate change indicate an increased fire risk, with as results an increased frequency of fires and extension of fire season (Rigolot, 2009).
Many large fires are linked to the dramatic land transformation that has been taking place in the Mediterranean region for some decades and that is increasing the risk of forest fire. On the one hand, agricultural fallows and orchards are slowly colonized by vegetation, while on the other hand, the forest is not sufficiently utilized, where both result in the increased accumulation of fuel loading (Lampin-Maillet et al., 2009a). In addition, urbanization - coupled to the phenomenon of forest extension - is generating new spatial configurations called “wildland-urban interfaces” (WUI), where WUIs are commonly defined as “areas where urban areas meet and interact with rural lands” (Vince et al., 2005) creating a new conjunction of housing and vegetation characteristics (Stewart et al., 2007).
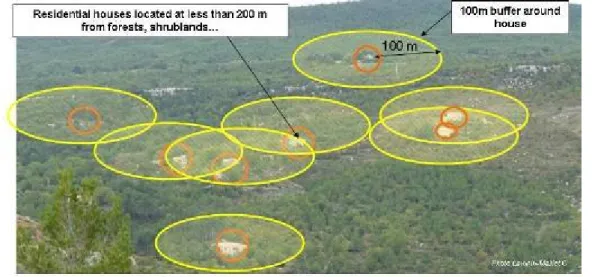
The wildland-urban interface (WUI) illustrated by the photo on the right, is also directly related to wildland fire: 90% of wildland fires are caused by human activities in Mediterranean Europe (Martin et al,, 2005) and every year a number of people living in WUIs are killed by wildland fires. Human casualties are mostly among fire fighters who loose their lives
protecting woodlands or dwellings, or populations threatened by fires, often attempting to escape. According to their environment, dwellings - especially those standing in forest areas - are to some degree sensitive to fire.
Source Cemagref/Lampin-Maillet CemOA : archive ouverte d'Irstea / Cemagref
The wildland-urban interface represents a key-area for fire risk management (Davis, 1990; Velez, 1997; Cohen, 2000), considering the fire occurrence on the one hand (hazard), and effects and damage on the other (vulnerability).
1.2. The wildland-urban interface literature
1.2.1. Wildland-urban interface definitionsIn geography, “interface” is defined as “the contact plan or contact line between two different systems” (Brunet et al. 1993). It constitutes a privileged zone to exchange and to interact between two systems, specifically between human and wildland systems (Carroue et al. 2002). In the literature, definitions present WUI as the line (area), or zone where structures and other human developments meet or mix with undeveloped wildland or vegetative fuels (United States Department of the interior, 1995). The term WUI community can also be described as “the urban-wildland interface community where humans and their development meet or intermix with wildland fuel”, where houses meet or mix with undeveloped wildland vegetation (USDA and USDI 2001). Nowadays (and more generally) the WUI, is more commonly described as “the area where urban areas meet and interact with rural lands” (Vince et al. 2005). It includes the edges of large cities and small communities, areas where homes and other structures are intermixed with forests and other land uses, and islands of undeveloped lands within urban areas (Alavalapati et al. 2005, McGee 2005, Caballero et al. 2004). In these WUI, increased human influence and land-use conversion are changing natural resource goods, services and management (Macie and Hermanser 2002).
1.2.2. Wildland-urban interface mapping
Conceptually, the WUI is a conjunction of housing and vegetation characteristics (Stewart et
al., 2007). On the one hand, human presence is measured by the density of houses and other infrastructures (Lampin et al., 2006a, 2006b; Caballero et al., 2004; Camia et al., 2003) or by the density of the population (Kamp and Sampson, 2002).
However, empirical data on the extent of WUIs and location are scarce. Some methods developed at national or regional levels allow location and mapping of WUIs providing tools for the elaboration of physical, emergency and self protection plans, but according to Dumas
et al. (2008) and Theobald and Romme (2007), more detailed data is required for planning and management activities. So the development of an efficient method for WUI mapping would be necessary in order to be used for fire risk management.
CemOA
: archive
ouverte
d'Irstea
1.3. Objectives of the technical guide
The objective of this guide is to propose and develop a methodology in order to be able to map and describe the wildland-urban interface at a large scale and over large areas, with a view of fire prevention improvement and to analyse the WUI territorial development in the landscape. It will attempt to define the wildland-urban interface precisely. The two main components of the wildland-urban interface are (i) the housing configuration and (ii) vegetation. Concerning housing configuration, houses or buildings are dedicated to dwellings organized in isolated, scattered or clustered units. Concerning vegetation, wildland vegetation is defined as the following land cover classes: (i) wildland forests (coniferous, deciduous, and mixed forest); (ii) shrubland; (iii) native grasslands/herbaceous; (iv) transitional lands (mostly clear-cuts); and (v) woody and emergent herbaceous wetlands. Excluded from wildland vegetation are low- and high-intensity residential, commercial/industrial, orchards/vineyards, pasture/ hay, arable lands (e.g., row-crops) and pasture, small wheat lands, fallow, urban/recreational grasses, bare rock/sand/clay, quarries, open water, and perennial ice/snow (Steward et al, 2003, Radeloff et al, 2005, Lampin et al, 2006a).
Many methodological questions remain to define a practical WUI mapping method:
- How to select criteria to characterize housing configuration precisely, whatever the scale, including large areas. Also, how to describe and classify vegetation structure in contact with these houses.
- How to set up an appropriate mapping method for WUI mapping at a large scale, for a large area.
- How to adapt this method in the context of different European countries.
This technical guide pursues 3 main objectives:
- To present a method to map WUI after defining WUI accurately and quantitative, from a study case developed in France;
- to allow adaptation of the method in another Mediterranean countries, taking into account another urban context or legacy context (e.g.in Spain);
- to present the user’s notice written for the use of the tool “WUImap”, developed in order to map possible WUIs on the territory automatically.
CemOA
: archive
ouverte
d'Irstea
2. Materials and data
2.1. Study sites
In order to develop the previous objectives, three study cases have been defined in three European countries: namely in France, Spain and Greece. The first is located in south-eastern France in the Metropolitan area between Aix-en-Provence and Marseille. This corresponds to site 1, in Fig.1. The second is located in the western part of Madrid. This corresponds to site 2, in Fig.1, its territorial limit of the study covers grids 508 (I, II, III, IV) and 533 (I, II), approximately 70.000 hectares. The third is located in north-eastern Greece in the western section the Thessaloniki district. This corresponds to site 3, in Fig.1.
The method for mapping and describing WUIs was developed at French site 1. It was also adapted to the Spanish site 2. It was included in Product P5.1.7, developed at Greek site 3 for hazard mapping in WUIs and for total risk mapping in WUIs.
Fig.1: Location of the three European study areas
2.2. Data, softwares
At site 1, the satellite imagery SPOT 5 (with a very high resolution), acquired within the ISIS program framework by CNES (National Centre of Spatial Studies), was used. It was dated July 2002, with a 2.5 m spatial resolution resulting from pan-sharpening of multi-spectral imagery (10 m spatial resolution) with panchromatic imagery (2.5 m spatial resolution in super mode). This image has been selected because of its good and homogenous quality over the whole of the site: it covers a large area (60 km by 60 km), and its 2.5m resolution allows results at a large scale. Other databases used were (i) BD TOPO®IGN giving the house layer, and (ii) aerial photos BD ORTHO® IGN produced by the IGN (National Geographic
CemOA
: archive
ouverte
d'Irstea
Institute) for updating house layer. At site 2, three kinds of data were used: (i) the national Forest Map of Spain (1:50.000), (ii) aerial photography (2006) at 0.5 meters of resolution and (iii) a map of settlements.
The main software used was: ArcGIS© 9.3 software
ArcGIS© version 9.3 software developed by ESRI (Environmental Systems Research Institute) allows to visualise, to explore, and to analyse spatial data. It is adapted to vector or raster dataset. It has been used with the extension « Spatial Analyst », to combine different layers and to map results, etc.
FRAGSTATS© software
FRAGSTATS© Version3.3 (McGarigal and Marks, 1994) is a spatial analysis freeware. It quantifies spatial areas and their spatial configuration inside landscape. It allows particularly calculation of aggregation metric on vegetation.
CemOA
: archive
ouverte
d'Irstea
3. Mapping methods of the wildland-urban interface
3.1. Accurate of the WUI definition in the French context
In order to map wildland urban interfaces on the territory, a precise definition of the WUI has been proposed, as follows (Lampin-Maillet et al. 2010a, b):
Wildland-urban interfaces (WUIs) are composed of residential houses, which are inhabited permanently, temporarily or seasonally (agricultural, industrial, commercial and public buildings were not taken into consideration);
• Houses are located at approximately 200 meters from forests or shrublands. This distance of 200 meters refers to the French Forest Law dated the 9th July 2002, which enforces brush-clearing around buildings closer than 200 meters from forests or shrublands (Art.L.322.3 of the Forest Law code);
• WUI are delineated by a radius of 100 meters around houses. This distance takes into account the perimeter wherein fuel reduction operations are imposed on homeowners by the French Forest Law (Art.L.321.5.3). This French forest law indicates that brush-clearing has to be applied (and maintained) within a perimeter of 50 meters from the building which can be extended to 100 meters by local regulations.
The WUI definition is illustrated on Fig.2.
Fig 2: WUI definition
Nota: This buffer size used, includes the zone exposed to flame contact and also the zone affected by flame radiation-convection (Cohen, 2002, 2003; Nowicki, 2002; Caballero et al., 2004; Caballero & Beltran, 2003; Southern Forest Alliance, 2003; Randall, 2003). This buffer
CemOA
: archive
ouverte
d'Irstea
size allows including an area that is significantly exposed to firebrands from vegetation in case of fire. “228 meters distance”, is the average distance that firebrands can be carried from a wildland fire in Mediterranean Europe (results of European Saltus program, Colin et al., 2002). The area considered in WUI is located up to 300 meters from massifs (200m +100m) (in the same way Radeloff et al., 2005 considers a buffer distance of 2.4 km corresponding to the distance that firebrands can be carried from a wildland fire to the roof of a house in USA).
3.2. Criteria to describe and map WUIs
.We considered WUI as consisting of two intermixed elements: the first concerned the spatial organization of residential houses, and the second concerned the structure of fuel vegetation. Spatial criteria were developed to specify the structure of dwellings in contact with the different vegetation structures. With regard to the structure of dwellings, after first approaches developed with housing density calculation (Lampin et al. 2007a,b,c), we proposed a real and quantitative definition of terms corresponding to (a) isolated, (b) scattered, (c) dense and (d) very dense clustered dwelling types, usually used by land managers and geographers. This classification is based on quantitative criteria described in Lampin-Maillet et al. (2010a, b) such as housing density. Concerning the structure of vegetation, the only horizontal structure of vegetation that can be recognized spatially, has also been classified ((a) no vegetation, (b) sparse vegetation and (c) continuous vegetation). Then the combination of different types of dwellings and different classes of horizontal structures of vegetation produced a wildland-urban interface typology, was considered. The method used to described/classify and map WUIs is based on three steps that are described in order below.
3.2.1. Classifying and mapping housing configuration
The first step is to classify and map the housing configuration. The houses considered as being located within the wildland-urban interface are selected (step (a) Fig.5). Then according to the definition of the dwelling types established in Lampin-Maillet et al. (2010a, b) and through the process of buffering and house counting described in the same paper, each house was classified as belonging to one of the four configurations of houses (Fig.3) : isolated, scattered, dense clustered, and very dense clustered housings (step (b) Fig.5). Then for each house belonging to the same housing class which takes into account the distance between houses and the number of houses, a buffer process with a 100-m radius around houses (step (c) Fig.5). CemOA : archive ouverte d'Irstea / Cemagref
CemOA
: archive
ouverte
d'Irstea
Fig.3: Quantitative criteria for discriminating the 4 types of housing
3.2.2. Classification and mapping of horizontal structure of vegetation
The second step is to classify and map the structure of the vegetation. The structure of vegetation reveals its horizontal continuity, which is designed for the measurement of aggregation levels of spatial patterns within the vegetation class, in a land-cover map. Among the different existing metrics in landscape ecology (McGarigal, 2002), the most appropriate index to measure aggregation of spatial patterns is the (AI) aggregation index (Lampin-Maillet et al. 2010a). This aggregation index has a spatial representation.
A vegetation map in raster format is necessary for the calculation of the aggregation index. It can be provided through the selection of the vegetation class pointed out in a land cover map performed with a classification of satellite imagery for example (step (e) Fig.5). Two classes are considered: vegetation class and no vegetation class (step (f) Fig.5). Calculated on vegetation class, the aggregation index enhances spatial organization of forests and scrublands. Aggregation metrics calculations were made within a moving window with a radius of 20 metres and a map of aggregation index values was also drawn up including three classes of AI values (step (g) Fig.5). The first class concerned values equal to zero, and the two other classes were determined by sharing the numbers of value equally into two groups or by setting a threshold value equal to 95 %: the first distribution of numbers were considered as low values of aggregation, the second one as high values (step (h) Fig.5).
Note: If the vegetation map is only available in vector format, AI calculation is not relevant. Thus the structure of the vegetation can be qualitatively assessed according to its vegetation cover. In other words:
- Continuous horizontal structure of vegetation corresponding to high AI in place
It corresponds to vegetation classes with dense vegetation covering: ground is completely covered by vegetation (resinous stands, hardwood stands, mixed stands, un-cleared vegetation, garrigues, maquis, etc.).
- Discontinuous, sparse, horizontal structure of vegetation corresponding to low AI It corresponds to vegetation classes with sparse vegetation covering: ground is not completely covered by vegetation, (managed areas, cleared areas, ornamental garden, plantations, hedges, etc.).
- No vegetation corresponding to AI equal to zero
It corresponds to bare ground, built areas, agricultural areas, etc., which are not necessary non-combustible. CemOA : archive ouverte d'Irstea / Cemagref
(1): AI=0 (2): AI=25% (3): AI=50% (4): AI=75% (5): AI=90% (6): AI=100%
Lampin & al, 2006a
The spatial Aggregation Index AI is defined on the spatial arrangement and agglomeration of objects on the image. It provides information about frequency of connections between pixels of a same class of landscape (Robbez-Masson et al. 1999). It formula is defined by:
gii = Number of contacts between the pixels of a class i
with
max – gii = Maximal number of contacts between the
pixels of a class i
The calculation was made within a moving window with a radius of 20 meters. The AI values increase with the continuity and compactness of the pixels as illustrated Fig.4.
Fig.4: Evolution of aggregation index from the arrangement of 9 grey pixels
Its calculation produces a raster map with values from 0 to 100% which are classified according thresholds below:
- Aggregation = 0 corresponds to land covers different from vegetation; - 0 < Aggregation 95% correspond to discontinuous, sparse vegetation or edges; - Aggregation > 95% which correspond to dense and continuous vegetation.
3.2.3. Combination of the two previous criteria
The third step is combining the two previous criteria through a geographical information system (GIS). After the conversion of the housing configuration type layer to raster layer and its codification (step (d) Fig.5), this housing configuration type layer has been added to the aggregation layer (step (h) Fig.5). Result of the calculation allowed mapping of the wildland-urban interfaces according to 12 types (step (i) Fig.5) by crossing four classes of dwelling types and three classes of vegetation aggregation indexes in a raster format.
(100) max = ii ii g g AI CemOA : archive ouverte d'Irstea / Cemagref
Fig.5: methodological process for WUI mapping CemOA : archive ouverte d'Irstea / Cemagref
4. Types of Wildland-urban interfaces and mapping
4.1. Examples
Twelve types of wildland-urban interfaces have been produced by combining the three vegetation aggregation classes (no aggregation, low and high aggregation) and the four housing configuration types.
The 12 wildland urban interface types are summarized in the table 1 below, and are illustrated in Fig.6.
Type 1 Isolated housing & no aggregation
Isolated housing in contact with crops, urban areas without vegetation
Type 2 Isolated housing & low aggregation
Isolated housing in contact with discontinuous, sparse vegetation
Type 3 Isolated housing & high aggregation
Isolated housing in contact with continuous, compact vegetation
Type 4 Scattered housing & no aggregation
Scattered housing in contact with crops, urban areas without vegetation
Type 5 Scattered housing & low aggregation
Scattered housing in contact with discontinuous, sparse vegetation
Type 6 Scattered housing & high aggregation
Scattered housing with continuous, compact vegetation Type 7 Dense clustered housing &
no aggregation
Dense clustered housing in contact with crops, urban areas without vegetation
Type 8 Dense clustered housing & low aggregation
Dense clustered housing in contact with discontinuous, sparse vegetation
Type 9 Dense clustered housing & high aggregation
Dense clustered housing with continuous, compact vegetation
Type 10
Very dense clustered housing & no aggregation
Very dense clustered housing in contact with crops, urban areas without vegetation
Type 11
Very dense clustered housing & low aggregation
Very dense clustered housing in contact with discontinuous, sparse vegetation
Type 12
Very dense clustered housing & high aggregation
Very dense clustered housing with continuous, compact vegetation
Table 1: WUI typology
* % " (* $ , % " (* $ 1 % * (* % " (* $ = $" $$ $ % $ 8 A $$ $ % $ 9 $ * (* % " (* $ CemOA : archive ouverte d'Irstea / Cemagref
Fig.6: Illustrated wildland urban interface typology
4.2. WUI mapping
The WUI method has been applied on different areas in France: Sections of municipalities, whole municipalities, department (613,000 ha) by different people, agencies. Fig.7 illustrates a wildland-urban interface map at the scale of a municipality.
A specific tool was developed in order to map wildland-urban interfaces and housing configuration automatically. Its name is WUImap© Cemagref 2009. The user’s notice is presented in the next paragraph whose references are:
Lampin-Maillet, C and Bouillon, C. (2010). WUImap© Cemagref 2010: Tool for mapping wildland-urban interfaces. User’s notice. 17p.
CemOA
: archive
ouverte
d'Irstea
Fig.7: Wildland urban interface map in South of France (site1) CemOA : archive ouverte d'Irstea / Cemagref
5. A tool for WUI mapping: user’s notice
WUImap
© Cemagref 2010TOOL FOR MAPPING
W
ILDLAND-
U
RBAN
I
NTERFACES
User’s Notice
[Including in the tool’s directory]
Copyright © Cemagref 2010 - Version 1.03 20/01/2010
We have used © ESRI ArcGis 9.3 software as the programming platform for the development of the tool WUImap© Cemagref 2010.
The program developed in the tool WUImap allows calculation and mapping of wildland-urban interfaces defined in Lampin-Maillet et al. (2010a, b). It can also map different configurations of housing referring to the definitions in Lampin-Maillet et al. (2009a).
5.1. Requirements
The material used for computing is a PC with specifications such as: - type of processor : © Intel Xeon - 1.6Ghz
- 3 GB RAM
- hard disk capacity : 1Go minimum The software requirements are:
- © Microsoft Windows Xp professionnel SP3 - © ESRI ArcGis 9.3
- Python 2.5.1 software (included in ArcGis)
5.2. License
The developed tool WUImap is running with a valid licence ArcGIS 9.3 type « ArcInfo » and for the raster calculations, it used the functions provided by the Spatial Analyst extension. The program used Python as computer language to write the necessary code for the implementation of the algorithms. Installator used Inno Setup Compiler.
Copyright © 2008 ESRI ArcGis, All rights reserved.
Copyright © 2001, 2002, 2003, 2004, 2005, 2006, 2007 Python Software Foundation; All Rights Reserved,
Copyright © 1997-2008 Jordan Russell. All rights reserved.
The tool is proposed according terms of license Creative Commons
Authorship-No commercial use-No modification - version 2.0 France.Creative
Commons can be reached: http://creativecommons.org/
CemOA
: archive
ouverte
d'Irstea
5.3. Installation
Copy installation file [Setup Interfaces Cemagref.exe] on the desk of your PC Execute this file for installation by a click on the icon:
Follow the process in order to create repertories and icons necessary for the application:
A data set is delivered for tests. It was located in the repertory C:\WUImap_datatest
5.4. Data requirements
5.4.1. Types of datafilesThe required datafiles have obligatory the following format: - geotiff (.tif) for raster formats
- shapefiles (.shp) for vector formats
5.4.2. Other requirements for a performed use of the tool WUImap 5.4.2.1. Geo-referencing
All the files are defined in the same coordinate system (Lambert 93, Lambert 2 Etendu…).
In some conditions if the geo-referencing and coordinate system assigned to any geographic data is missing or not one, errors can appear in the program and can stop the process.
5.4.2.2. Datafile preparation
It is necessary to prepare the different data layers. They have to correspond to the same study area. CemOA : archive ouverte d'Irstea / Cemagref
So it is recommended to consider a mask corresponding to the study area and to split the different layers according to this mask. The limits of the mask correspond to the study perimeter.
In order to map WUIs, three types of layers have to be taken into account: - residential house layer,
- layer defining the area where brush-clearing is obligatory, - layer of the index of vegetation.
For house layer: only houses whose centroid is included in the mask have to be considered. For brush-clearing layer and index of vegetation: the layers have to be split by the masked area.
INPUTS
Study area Houses polygons Vegetation aggregation indice
This preparation allows for avoiding calculation errors due to missing data in raster layers.
In the case of house layer, select houses according protocol, that is to say house considered as residential house and whose area is larger than 30m².
It is useful to be sure those polygons of the layer are correct with the command « repair geometry ». It avoids stopping the program.
5.4.2.3. Raster layer resolution
A 2.5 m resolution has been considered in the method. Calculations with WUImap have been carried out automatically with this resolution. But the tool can accept files of aggregation index with a resolution varying from 0.5 m to 10m.
5.5. Results coming from the WUImap tool
Two types of map can be produced using the WUImap tool. Their format is raster format « .tif » (GEOTIFF) compatible with many softwares.
CemOA
: archive
ouverte
d'Irstea
Data are recoded according different classes detailed in following paragraph.
5.5.1. Map of housing configuration
The produced map [housing_configuration.tif] presents the 4 types of housing:
- isolated housing, - scattered housing, - dense clustered housing - very dense clustered housing
Calculation is carried out on the chosen study area. It distinguishes houses according their belonging or not to the brush-clearing area.
Legend and codes of the map of housing types
Color / code
Types of housing Zones
No housing Isolated housing Scattered housing Dense clustered housing Very dense clustered housing
Within the area where brush-clearing is obligatory (corresponding to WUI)
Isolated housing Scattered housing Dense clustered housing
0 10 20 30 40 50 60 70
80 Very dense clustered housing
Outside the area where brush-clearing is obligatory (OWUI)
This map is carried out with a fixed 2.5 m resolution.
5.5.2. Map of wildland-urban interfaces
The map of wildland-urban interfaces [wui_types.tif] is produced by combination of the map of housing types and the map of vegetation aggregation index (AI).
This map cannot be produced if the layer of vegetation aggregation index is not available
Calculation is carried out on the chosen study area. It distinguishes houses according their belonging or not to the brush-clearing area.
Example of a map corresponding to the legend below
CemOA
: archive
ouverte
d'Irstea
Legend and codes of the map of wildland-urban interface types
Couleur / code
Typesof wildland-urban interface Zones
No housing
Isolated housing AI nul Isolated housing low AI Isolated housing high AI Scattered housing AI nul Scattered housing low AI Scattered housing high AI Dense clustered housing AI nul Dense clustered housing low AI Dense clustered housing high AI Very dense clustered housing AI nul Very dense clustered housing low AI Very dense clustered housing high AI
Within the area where brush-clearing is obligatory (corresponding to WUI)
Isolated housing AI nul Isolated housing low AI Isolated housing high AI Scattered housing AI nul Scattered housing low AI Scattered housing high AI Dense clustered housing AI nul Dense clustered housing low AI Dense clustered housing high AI Very dense clustered housing AI nul Very dense clustered housing low AI
0 11 12 13 21 22 23 31 32 33 41 42 43 51 52 53 61 62 63 71 72 73 81 82
83 Very dense clustered housing high AI
Outside the area where brush-clearing is obligatory (OWUI)
To notice: the resolution of output data of this map is equal to resolution of input data of the map of aggregation index of vegetation (AI):
Examples: 2.5 m resolution 10 m resolution CemOA : archive ouverte d'Irstea / Cemagref
5.6. Database management
The software installed automatically repertory of data on C:\WUImap_datatest.
The repertory for output data is selected by the user and will be used for creation of sub-sets of the database called « Interfaces Results » containing files created in .tif format.
A temporary info-file, TempW, is also created by the program itself and deleted by this program at the end of the process.
It is important to delete the following files before to execute new process if program doesn’t do it itself automatically:
- WUImap Results - TempWUImap
5.7.
Functioning
5.7.1. Setting upClick on the icon on the desk Windows
or on :
Program appears in a unique window with the whole of functionalities:
CemOA
: archive
ouverte
d'Irstea
5.7.2. Input files
The three following files are necessary to execute the program
- Perimeter of the study area (file type: shapefile .shp - polygone): this file presents limits of the study area. For example it corresponds to the area of a municipality. This file corresponds to a geographical mask within calculations are carried out on the other data.
- Area where brush-clearing is obligatory (file type:shapefile .shp - polygone): this file corresponds to the area where brush-clearing is obligatory (forested area surrounded with a 200 m buffer)
- Residential houses (file type:shapefile .shp - polygone ): this file is composed of polygones corresponding to residential houses whose surface is larger than 30m².
Important Remark: the referenced method used polygones (and not points) to represent houses
Choose files corresponding to the previous different categories:
CemOA
: archive
ouverte
d'Irstea
If the file corresponding to vegetation aggregation index is missing : Leave out the box Aggregation Index of vegetation AI
5.7.3. Choice of directory for output data files
This directory will be created according to the requirements of the user, but its name has not yet been specified in terms of characters or spaces. Produced maps will be stored in this directory "map of housing types" and/or "map of wildland-urban interfaces" in geo-referenced format TIF. CemOA : archive ouverte d'Irstea / Cemagref
It is always possible to modify selected files and the directory for output data files with a new selection.
5.7.4. Calculation process
Click on « RUN »
The program is running… wait some times…
A command windows Dos appears. The program which is in progress can be followed.
The end of calculation can be observed with the following message « PROGRAM
TERMINATED» CemOA : archive ouverte d'Irstea / Cemagref
5.7.5. End of program
Click on « QUIT ». The program is shutting-down.
Important remark: To execute the program again, a new output datafile repertory has to be created or the previous output datafile repertory has to be deleted !
5.8. Program test
A dataset is provided in order to test the program.
To set up the program with the present files on the repertory C:\WUImap_datase
5.9. Display and results checking
To display results click on
Execute Arcgis and load created images in : « your chosen repertory +\WUImap_Results »
CemOA
: archive
ouverte
d'Irstea
Display images: The resulting images of the test have to be similar as the images below: Types of housing : [housing_configuration.tif]
Wildland-urban Interfaces: [wui_types.tif]
CemOA
: archive
ouverte
d'Irstea
Remark: The program can manage a missing class of housing because if no house existing in this class. Mapping process takes into account this singular case without disfunctioning.
Apply the legend and predefined colours to obtain final result.
CemOA
: archive
ouverte
d'Irstea
Legend results
5.10. Dis-installation
In order to delete the program on the computer click on the menu of programs
CemOA
: archive
ouverte
d'Irstea
(It is necessary to have administrator rights)
5.11. Sofware restrictions
This program has been tested with a range of material configuration described earlier. Some limits can be exposed:
- Maximum size of raster as input data is 11000 x 14000 pixels, according 2.5 m resolution, around 100.000 ha.
- Maximum number of entities (polygones corresponding to houses) around 40 000 – (corresponding to a municipality of 80.000 inhabitants).
CemOA
: archive
ouverte
d'Irstea
6. Adaptation in other European countries: Example of
Spain
The WUI method is particularly well adapted to the French context but it can be adapted according context of different European countries.
• Criteria of distances and number of houses that were taken into account to determine housing configuration types could be changed according a specific local context of the urban organization in the country ;
• Houses considered in wildland urban interface are located at 200 meters from forests
or shrubland in French context because of vegetation clearance regulation, this distance could be changed according other regulations observed in other countries or because of spot fire distance.
• The radius of 100 m is relevant for France because considering the WUI definition,
the WUI area is located up to 300 metres from massifs (200 m + 100 m) so it is also significantly exposed to firebrands from vegetation in the case of fire. Therefore, in France, WUIs are included in the French Forest Orientation Law of July 9, 2002. This Law makes provision for brush clearing being obligatory within a 50-metre perimeter around each house located at a distance of less than 200 metres from forests or shrublands. In other European countries, the effective fuel treatments occur only with a 10-30 meter radius by specific regulation.
6.1. Example of the western of Madrid in Spain
The methodology developed in the French context - to map and characterize wildland-urban interfaces (WUIs) - was adapted for the local case of study selected within the framework of the doctoral thesis “Wildland-urban interfaces as new fire prone areas in Spain” (Herrero, 2010). The sources of information used in the WUI calculation process were National Forest Map of Spain for vegetation, aerial photography and layer of houses.
• Calculation of the aggregation index (AI) from the vegetation raster layer using the FRAGSTATS software have been carried out. The classification of the AI in three classes was realised according to the statistical results of the vegetation patterns in the study area, with as result a modification of thresholds.
The following four types of habitat were identified: isolated, group of buildings, urbanization and urban center with distances and number of houses considered differently. CemOA : archive ouverte d'Irstea / Cemagref
Delimitation of the WUI surface: a buffer of 100m around all the buildings located at a distance less of 400 m from the forest.
Thus the method can be transferred to other countries with local parameters for drawing maps adapted to others contexts. The maps are also done for the western of Madridin Spain (Fig.8 and Fig.9).
Fig.8: Map of Housing configuration in the western of Madrid in Spain (site2)
Fig.9: Map of wildland-urban interfaces in the western ofMadrid in Spain (site2)
CemOA
: archive
ouverte
d'Irstea
6.2. WUImap© Cemagref 2009 - Spanish adaptation
A Spanish version of WUImap tool was under development adapting parameters relative to housing and vegetation to the Spanish context.
A beta version was already developed and was able to calculate WUI from an area around Madrid. The interface software is represented below Fig.10.
Fig.10: Interface software of the Spanish adaptation of the WUI map tool
Lampin-Maillet, C., Bouillon, C., Herrero, G. (2009). WUImap© Cemagref 2009-Spanish adaptation: Tool for mapping wildland-urban interfaces. User’s notice. 19p.
CemOA
: archive
ouverte
d'Irstea
7. Specific use of WUI map
7.1. Calculation of the Fire Hazard in WUI
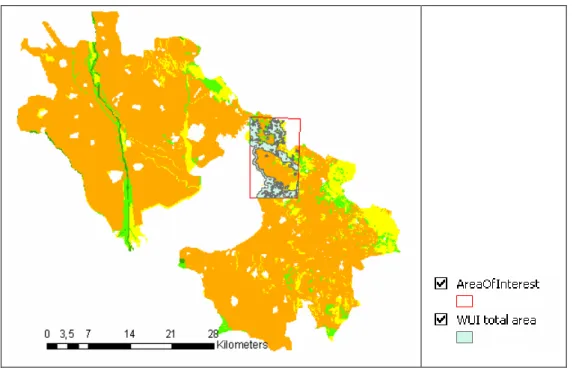
Within a part of the study area on Greek site 3, WUI were delineated. The location of the WUI total area is shown in Fig.11 below:
Fig. 11: Location of WUI delineation and WUI total area (site 3)
Fire Hazard assessment within the WUI was obtained by means of combining WUI total area with Hazard Index (HI) calculated in the internal report IR5.1.4 (Lampin-Maillet et al., 2009b) and mapped by means of the tool presented in P5.1.7 (Mantzavelas et al., 2009).
CemOA
: archive
ouverte
d'Irstea
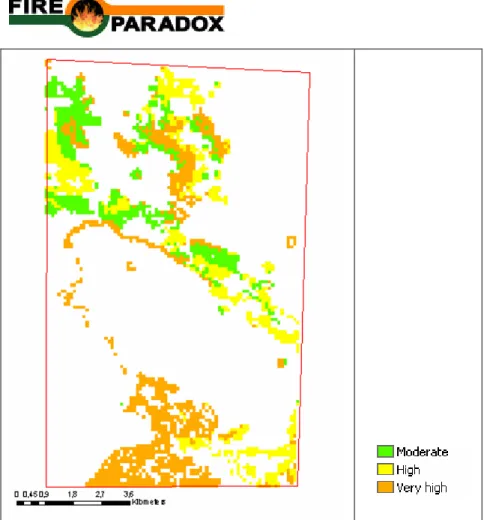
Fig. 12: Distribution of Hazard Levels in WUIs (site 3)
Results of Fig.12 showed that from 2625 Ha of the total WUI area, Hazard Index was “Moderate” for 649 Ha (24.72%), “High” for 849 Ha (32.34%) and “Very high” for 1127 Ha (42.93%).
7.2. A specific approach of fire risk assessment in WUIs by
means of a total risk index
The work presented hereafter is aiming at the definition of a process for obtaining a fire risk map through the calculation of a total fire risk index based on a WUI map elaborated according the process referenced to Lampin-Maillet et al. (2010a, b) presented in the previous paragraphs.
Considering the WUI map, a new perception of the territory is possible: WUI area, and outside WUI area. Because of their high vulnerability, ignition probability and combustibility, it is important and efficient to focus risk assessment in the WUIs. The method developed so allows assessment and mapping of fire risk levels.
7.2.1. Spatial analysis based on WUI map
CemOA
: archive
ouverte
d'Irstea
A spatial analysis on the studied territory was performed in order to establish relationships between the distribution of fire ignition points and burned area as and different land cover data, WUI types, environmental data. For that:
• A digitized database of fire ignition points created by the French National Forest Institute (ONF) was used. It comprised fire ignition points during the 1997–2007 period corresponding to a fire area of more than one hectare. Around 565 fire ignition points were located in the study area.
• A digitized database of burned area produced by the Administration of Agriculture and Forest of Bouches-du-Rhône was used. It comprised 109 wildland fires recorded study area between 1990 and 2007.
• At last, a thematic land cover layer obtained from the Spot Thema database elaborated in 2004 by CNES, Provence-Alpes-Côte-d’Azur Region and a Spot Image from Spot 5 satellite imagery on the study area were used. The detailed level describes the territory (urban, agricultural and natural components) at the 1: 10 000 scale.
Thanks to relationships established between WUIs and fire indicators calculated with past fire data (fire ignition density and burned area ratio), it is possible to point out specific WUIs which present a high level of fire risk. Fig.13 shows that WUIs corresponding to isolated dwellings present a high level of fire risk due to high levels of ignition density and burned area ratio. WUIs corresponding to very dense clustered dwellings present also a high level of ignition density linked with human activities but a low burned area ratio (high urban component and low vegetation component) (Lampin-Maillet et al. 2010a).
Fig.13: Fire ignition density and burned area ratio according to WUI types
CemOA
: archive
ouverte
d'Irstea
7.2.2. Total Fire risk models
The spatial analysis also allowed revealing a set of conditions that may fire risk exist in WUI: housing density, road density, vegetation more or less continuous…Results of this analysis are expressed through three main functions (or fire risk indicators) based on statistical multiple regressions with R2 more or less high:
Fire Ignition Density FID = Exponential function (territory type, land cover type, housing density) with R2 = 51 % ;
Wildfire Density WD = Exponential function (territory type, land cover type, housing density, resinous stands, very warm exposure) with R2 = 57 % ;
Burnt Area Ratio BAR = Polynomial function (territory type, land cover type, housing density, road density, country road density, garrigues, altitude, low aggregation of vegetation) with R2 = 36 %.
A total index of wildfire risk was performed combining the three previous indicators (Lampin-Maillet, 2009). In reference to fire risk definition, each of the three indicators is bearer of information of hazard and/or vulnerability: Fire Ignition Density FID and Wildfire Density WD are particularly concerned by fire occurrence (ignition probability and wildfire probability) and Burnt Area Ratio BAR is related to hazard and vulnerability through the intensity element. Their combination can contribute to a pertinent and efficient assessment of fire risk. So a Fire risk total index RI has been built corresponding to a linear combination of the three indicators having the same weight but corrected by their explanation level (R2 value).
In the case of the study area the equation is:
Fire risk total index RI = 0.89 FID + WD + 0.63 BAR
With respectively a correction of 0.89 corresponding to the ratio 51% / 57% for FID, a value of 1 (the best R2 value) corresponding to the ratio 51% / 57% for WD and a correction of 0.63 corresponding to the ratio 36% / 57% for BAR.
7.2.3. Fire risk mapping in WUIs and analysis
CemOA
: archive
ouverte
d'Irstea
BD Ortho®IGN Houses in WUIs Very low fire risk index IR Low fire risk index IR Moderate fire risk index IR High fire risk index IR Very high fire risk index IR
A map of this fire risk total index can be produced as illustrated at Fig.14 in the South of France.
Fig.14:Map of wildfire risk global index in WUIs in South of France
Certain types of WUIs represent a high level of fire risk in terms of fire ignition density, wildfire density and burned area ratio. Regarding fire ignition density and burned area ratio, isolated WUIs with low and high aggregation indices of vegetation presented the highest values. Scattered WUIs with both low and high aggregation indices of vegetation also represented a high level of fire ignition density and burned area ratio even if these values were lower than those for isolated WUIs. Results also highlighted the fact that the burned area ratio generally decreased from isolated WUIs to dense and very dense clustered WUIs, and also decreased from a high aggregation index to a zero aggregation index (Lampin-Maillet et al. 2010a).
A tool has been carried out in the Product P5.1.7 Development of a gis tool to produce fire
hazard maps User’s manual (Mantzavelas et al., 2009) in order to map the IR Index which
is a combination between the Ignition Density Index (DE), the Wildfire Density Index (DI) and the Burned Area Index (SB). The function uses as input WUI typology, ecological, topographical and socioeconomic data. Data are processed according to the methodologies described in the internal report IR5.1.4 of Fire Paradox (Lampin-Maillet et al., 2009b). The output is an IR map. CemOA : archive ouverte d'Irstea / Cemagref
8. References
Avalapati, J.R.R., Carter, D.R., Newman, D.H. 2005. Wildland-urban interface: Challenges and Opportunities. Forest policy and Economics. 7:705-708.
Brunet, R., Ferras, R., Théry, H. 1993 (3ème éd.). Les mots de la géographie. Paris, Montpellier. La documentation française, 518 p
Caballero, D., Giroud, F., Picard, C, Xanthopoulos, G. 2004. EUFIRELAB/ Euro-Mediterranean Wildland Fire Laboratory, a "wall-less" laboratory for wildland fire Sciences and technologies in the Euro-Mediterranean Region - Deliverable D-10-01-
Wildland-Urban Interface Management: A state of the art.
http://www.eufirelab.org/deliverable.php?unit=10. 28p.
Caballero, D., Beltran, I. 2003. Concepts and ideas of assessing settlement fire vulnerability in the W-UI zone. In Proceedings (Eds Xanthopoulos, G.) of the international workshop WARM, Forest fires in the wildland-urban interface and rural areas in Europe: an integral planning and management challenge. Athens, Greece. pp 47-54.
Camia, A., Valera, V., Marzano, R., Etchifidis, G. 2003. Spatial analysis in European Wildland-urban interface environment using GIS. In Proceedings (Eds Xanthopoulos, G.) of the international workshop WARM, Forest fires in the wildland-urban interface and rural areas in Europe: an integral planning and management challenge. Athens, Greece. p185-196.
Carroue, L., Claval, P., Di Meo, G., Miossec, A., Renard, J.P., Simon, L., Veyret, Y. 2002. Limites et discontinuité en géographie. Dossiers des images économiques du monde. Edition SEDES, 159p.
Cohen, J. D. 2003. Preventing residential fire disasters during wildfires. In Proceedings (Eds Xanthopoulos, G.) of the international workshop WARM, Forest fires in the wildland-urban interface and rural areas in Europe: an integral planning and management challenge, Athens, Greece. p5-12.
Cohen, J. D. 2002. Wildland-urban fire - A different approach. In: Proceedings of the Firefigther Safety Summit, International Association of Wildland Fire Missoula, MT, November 6-8 (2001).
Cohen, J.D. 2000. Preventing disaster : Home ignitability in the wildland-urban interface.
Journal of Forestry. 98 (3). 15-21.
Colin, P.Y., Lampin, C., Delboulbe, E., Coste, N., Marcillat, J., Pereira, J.C., Bingelli, F., Gaulier, A., Bothelho, H., Loureiro, C., Loddo, G., Ditana, E., Guijarro, M., Hernando, C., Diez, C., Martinez, E., Madrigal, J., Vega, J.A., Gorostiaga, P., Alexandrian, D., Dimitrakopoulos, A. 2002. SALTUS program-Spot fires. Knowledge and modelling. Proceedings of the IV International Conference on Forest Fire Research - 18 novembre au 22 novembre 2002, Luso (Portugal).
Davis, J. B. 1990. The wildland-urban interface : paradise or battleground ?. Journal of
forestry. 6, 88 (1), 26-31.
Dumas, E., Jappiot, M., Tatoni, T. 2008. Mediterranean urban-forest interface classification (MUFIC): A quantitative method combining SPOT5 imagery and landscape ecology indices. Landscape and Urban Planning. 84, 183–190.
Herrero, G. 2010. Wildland-urban interfaces as new fire prone areas in Spain: analysis and characterization. PhD Program: “Territory, environment and Society” in the department of Geography of the University Autonomous of Madrid. Report in progress.
JRC. 2008. Statistics 1980-2008, data source JRC-IES Report n°7/2008.
Kamp, M., Sampson, N. 2002. Using GIS to identify potential wildland-urban interface areas based on population density. www.sampsongroup.com/Papers/wui_paper.pdf. 9 p.
CemOA
: archive
ouverte
d'Irstea
Lampin-Maillet, C., Jappiot, M., Long, M., Bouillon, C., Morge, D., Ferrier, J.P. 2010a. Mapping wildland-urban interfaces at large scales integrating housing density and vegetation aggregation for fire prevention in the South of France. Journal of
Environmental Management, 91 (2010) 732–741, doi:10.1016/j.jenvman.2009.10.001 Lampin-Maillet, C., Mantzavelas, A., Galiana, L., Jappiot, M., Long, M., Herrero, G.,
Karlsson, O., Apostolopoulou, I., Lazaridou, T., Partozis, T. 2010b. Wildland urban interfaces, fire propagation and vulnerability: Characterization, Mapping and Assessment of the Vulnerability and Fire Risk. Fire paradox White Book.
Lampin-Maillet, C., Bouillon, C. 2010. WUImap© Cemagref 2010: Tool for mapping wildland-urban interfaces. User’s notice. Included in Product P.5.2-8 of the Integrated project “Fire Paradox”, Project no. FP6-018505, European Commission, 17 p.
Lampin-Maillet, C., Jappiot, M., Long, M., Morge, D., Ferrier, J.P. 2009a. Characterization and mapping of dwelling types for forest fire prevention. Computers, Environment and
urban systems 33 (2009), pp. 224-232. DOI
information:10.1016/j.compenvurbsys.2008.07.003.
Lampin-Maillet, C., Mantzavelas, A., Apostolopoulou, I., Lazaridou, T., Partozis, T., Topaloudis, T., 2009b. Adapted method to assess and map fire hazard in Wildland-urban interface: Internal report IR5.1-4 of the Integrated project “Fire Paradox”, Project no. FP6-018505, European Commission, 19 p.
Lampin-Maillet, C., Bouillon, C., Herrero, G. 2009c. WUImap© Cemagref 2009-Spanish adaptation: Tool for mapping wildland-urban interfaces. User’s notice. Included in Product P.5.2-8 of the Integrated project “Fire Paradox”, Project no. FP6-018505, European Commission 19p.
Lampin-Maillet, C. 2009. Caractérisation de la relation entre organisation spatiale d’un territoire et risque d’incendie : Le cas des interfaces habitat-forêt du sud de la France. Thèse de doctorat de l’université Aix-Marseille, mention Lettres et Sciences humaines (Géographie- Structures et dynamiques spatiales). 325 pages + annexes.
Lampin-Maillet, C. 2008. 2007, Summer Fires in the European Mediterranean – The Cases of Greece, Italy and Spain. Mediterranean yearbook. European Institute of the Mediterranean. Med.2008, Economy and Territory- Sustainable Development, 243-247.
http://www.iemed.org/anuari/2008/aarticles/EN243.pdf.
Lampin-Maillet, C., Long, M., Jappiot, M. 2008. Une méthode pour caractériser et cartographier les interfaces habitat-forêt, un enjeu pour la prévention des incendies de forêt. Revue Forestière Française, Mai-juin 2008.n°3 /2008, 363-380.
Lampin-Maillet, C, Long, M, Jappiot, M, Morge, D, Bouillon, C (Cemagref), Mantzavelas, A, Apostolopoulou, I, Lazaridou, T, Partozis, T, Topaloudis, T (OMIKRON Ltd), Galiana, L, Herrero, G, Solana, J L (UCM), 2007a. Fire paradox program Project no. FP6-018505. D.5.2-1 Method to characterize and to map wildland urban interface Part1- State of the art on the methods to characterize and to map wildland urban interfaces Deliverable
D5.2.1.Part1. 30 p.
Lampin-Maillet, C, Long, M, Jappiot, M, Morge, D, Bouillon, C (Cemagref), Mantzavelas, A, Apostolopoulou, I, Lazaridou, T, Partozis, T, Topaloudis, T (OMIKRON Ltd), Galiana, L, Herrero, G, Solana, J L (UCM), Loddo,G, Brigaglia, S, Dettori, G, Delogu, G (CFVA). 2007b. D.5.2-1 Method to characterize and to map wildland urban interface Part2- Methods developed in France, Spain and Greece. Application of the different methods to characterize and to map wildland urban interfaces in Sardinia. Fire paradox program Project no. FP6-018505 Deliverable D5.2.1.Part1. 60 p.
Lampin-Maillet, C, Long, M, Jappiot, M, Morge, D, Bouillon, C (Cemagref), Mantzavelas, A, Apostolopoulou, I, Lazaridou, T, Partozis, T, Topaloudis, T (OMIKRON Ltd), Galiana, L, Herrero, G, Solana, J L (UCM), Loddo,G, Brigaglia, S, Dettori, G, Delogu, G (CFVA).
CemOA
: archive
ouverte
d'Irstea
2007c. Method to characterize wildland-urban interfaces. Fire paradox program Project no. FP6-018505 Deliverable D5.2.2. 15p.
Lampin, C., Jappiot, M., Long, M., Borgniet, L. 2006a. Cartographie des interfaces habitat-forêt. Une approche spatiale pour estimer le risque d’incendie de forêt, Revue
internationale de Géomatique. European journal of GIS and Spatial analysis. Information géographique et gestion des risques, vol16, n°3-4 : 2006, 320-340.
Lampin, C., Jappiot, M., Long, M., Mansuy, N., Borgniet, L. 2006b. WUI and road networks/vegetation interfaces characterizing and mapping for forest fire risk assessment.
Forest Ecology and Management. 234S, pp. S137-S140.
Mantzavelas, A., Lampin-Maillet, C., Apostolopoulou, I., Lazaridou, T., Partozis, T., Topaloudis, T. 2009. Development of a GIS tool to produce fire hazard maps ; Users manual: Product P5.1-7 of the Integrated project “Fire Paradox”, Project no. FP6-018505, European Commission, 21 p.
Martin P, Bonora L, Conese C, Lampin C, Martinez J, Molina D, Salas J. 2005. Towards methods for investigating on wildland fire causes. Deliverable D-05-02 EUFIRELAB. 55p.
Macie, E.A., Hermansen, LA, eds. 2002. Human influences on Forest Ecosystems: The Southern Wildland-Urban lnterface Assessment.
McGarigal, K. 2002. Landscape Pattern Metrics. Chapitre du livre Encyclopedia of Environmentrics, Volume 2, John Wiley & sons, Sussex, England. Pp 1135-1142.
McGarigal, K., Marks, B. 1994. Spatial patterns analysis program for quantifying landscape structure. FRAGSTATS version 2.0. Forest Science Dept, Oregon State Univ., Corvallis, OR, USA.
McGee, T. K. 2005. "Completion of recommended WUI fire mitigation measures within urban households in Edmonton, Canada." Environmental Hazards 6: 147-157.
Nowicki, B. 2002. The Community protection Zone: Defending houses and Communities from the threat of forest fire. Center for Biological Diversity. http://www.sw-center.org/swcbd/Programs/fire/wui1.pdf . 4/15/03.
Radeloff, V.C., Hammer R.B., Stewart, S.I., Fried, J.F., Holcomb, S.S., McKeefry, J.F. 2005. The wildland urban interface in the United States. Ecological applications. 15 (3), 799-805.
Randall, C.K. 2003. Fire in the wildland-urban interface:Understanding fire behaviour. University of Florida. Institute of Food and Agricultural Science. 6p.
Rigolot, E. 2009. Perspectives : incendies et changement climatique. Forêt-Entreprise. N° 185 – Mars 2009. pp 47-48.
Southern Forest Alliance. 2003. Southwest, F.F.i.t.A. Forest Fire in the American Southwest Analysis: The Wildland urban interface. Southern Center for Wildland-Urban Interface Research and Information. 2003. "Interface South." http://www.interfacesouth.org/ 4/14/03. Website developed by the U.S. Forest Service “to heighten awareness of and provide information about WUI issues.”
Stewart, S.I., Radeloff, V.C., Hammer, R.B., Hawbaker, T.J. 2007. Defining the Wildland-Urban Interface. Journal of Forestry, 201- 207.
Stewart, S.I., Radeloff, V.C., Hammer, R.B. 2003. Characteristics and location of the Wildland-Urban-Interface in the United States. p. 6. Proceedings of the 2nd International Wildland Fire Ecology and Fire Management Workshop, November 16-20, 2003, Orlando, Florida.
Theobald, D.M., Romme, W.H. 2007. Expansion of the US wildland-urban interface.
Landscape and Urban Planning. 83, 340-354.
CemOA
: archive
ouverte
d'Irstea
USDA-USDI. 2001. U.S.Department of Agriculture and U.S.Department of Interior. Urban wildland interface communities within vicinity of Federal lands that are athigh risk from wildfire. Fed.Reg. 66. pp.751-777.
Vélez, R. 1997. Recent history of forest fires in Mediterranean area. In: Balabanis P, Eftichidis G, Fantechi R (eds) Forest fire risk and management. Proceedings of the European School of Climatology and Natural Hazards , Greece, 27 May–4 June 1992. European Commission, Brussels, 15–26.
Vince, S.W., Duryea, M.L., Macie, E.A., Hermansen, L.A. 2005. Forests at the wildland-urban interface: conservation and management (Boca Raton, CRC Press).
CemOA
: archive
ouverte
d'Irstea
QUALITY EVALUATION REPORT (QER) General comments Specific comments Issue # Page # Line #
* Comments and suggested modifications 1 2 3 4 5 …
* Use a for add, r for replace and d for delete.
CemOA
: archive
ouverte
d'Irstea